148
THE FREQUENCY OF DISTRIBUTION OF SOMATIC CELL COUNT IN DAIRY EWE’S MILK
Sharaf Eldeen Idriss
1, Vladimír Tančin*
1,2, Milan Margetín
1,2, Dana Tančinová
1, Petr Sláma
3, Zdeněk Havlíček
3Address(es): prof. Ing. Vladimír Tančin, DrSc. 1
Slovak University of Agriculture in Nitra, T rieda A. Hlinku 2, 949 76 Nitra, Slovak Republic :
2National Agricultural and Food Centre, RIAP Nitra, Hlohovecká 2, 951 41 Lužianky, Slovak Republic, 00421 903
546 401
3Mendel University Brno, Zemědelská 1, 613 00 Brno, Czech Republic
*Corresponding author: [email protected]
ABSTRAC T
Ke ywords: Dairy ewes, milk, somatic cell count
INTRO DUC TIO N
Dairy sheep breeding in Slovakia is designed to last 15 years particular, on increasing milk production (Oravcová et al., 2005), but increasingly also focuses on the functional properties that indirectly affect the economy of farming (Mile rski et al., 2005).
T he somatic cell count (SCC) is the basis for abnormal milk control programs for cows, goats and sheep (Bergonier-Berthelot, 2003). The SCC has evolved into an accepted parameter for the evaluation of milk quality and the price of raw milk within the dairy industry and as a management tool of udder health for dairymen worldwide. Ewes with a higher number of somatic cells have lower milk production and negatively affect other variables (lactose) and positive on fat and protein contents (Olechnowicz et al., 2009; Rupp et al., 2003). T he SCC has evolved into an accepted parameter for the evaluation of milk quality and as a management tool of udder health for dairymen worldwide (Paape e t al., 2007). T hough SCC is mainly related to udder health but also varies because of a number of non-infective factors such as breed, stage of lactation, parity, type of lambing, type of milking, estrus, as well as diurnal, monthly and seasonal etc. (Kukovics et al., 2006; Raynal -Ljutovac et al., 2007).
In Slovakia, the milk from dairy ewes is used for making the cheese. Although the SCC is not considered as factor influencing the price of milk, it is also an important factor determining its yield and quality of the final product (Oravcová
et al.,2007; Margetín et al., 2013). Individual SCC (SCC) is a useful predictor of infected gland, though there is no accepted threshold that can permit to differentiate between “healthy” and “infected” udders in dairy ewes (Be rthelot et al., 2006). Last mentioned authors consider the udder as healthy if individual SCC is lower than 0.5x10⁶ cells.ml-1, and infected if at least two individual SCC were higher than 1 or 1.2x10⁶ cells.ml-1. In the European Union (EU) countries as in Slovakia, the legal limit for cows is 400×103 cells.ml-1 and there is no legal limit for goats and sheep.
T he objective of this study was to evaluate the situation in somatic cell counts in one selected herd throughout three-years period with the possible relation to genetic and non-genetic factors.
MATERIALS AND METHO DS
Study area and e xperimental animals
T he study was performed in the experimental herd of the NPPC Research Institute for Animal Production Nitra, Slovakia, between 2010 and 2013. Genotypes of purebred T sigai (TS), Improved Valachian (IV) and Lacaune (LC) and their crossbred (Tsigai× Lacaune (TS×LC) and Improved Valachian × Lacaune (IV×LC) ewes were investigated.
T he ewes were milked twice daily at 7.00 and 19.00 hours. Machine milking was carried out in a 1 x 24 low-line, side by side milking parlour equipped with 12 milking units, by a single milking technician. Milking machine was set to provide 160 pulsations per minute (1:1 ratio with a vacuum level of 38 kPa). Milking was performed without any contact of hand with udder before cluster attachment (no stimulation, pre-dipping and fore-stripping). During each milking the ewes received in parlour 0.1 kg concentrate per head. Machine stripping with hand pressure to udder was done 10-20 s prior to removal of clusters.
Main period of lambing of ewes was detected during last week of January till the middle of March. Regular milk yield recording was performed during the morning milking in around the middle of April, May, June, July, and in some animals in August depending of the year. Individual milk samples were obtained from whole milk collection as an average sample. Milk samples were analyzed for somatic cells count. A total of 2632 milk samples from dairy ewes were individually collected.
T he objective of this study was to evaluate the situation in somatic cell counts in one selected herd throughout three-years period T he was study performed in the experimental herd of the RIAP Nitra, Slovakia, between 2010 and 2013. Genotypes of purebred T sigai (TS), Improved Valachian (IV) and Lacaune (LC) and their crossbred Tsigai× Lacaune (TS×LC) and Improved Valachian × Lacaune
(IV×LC) ewes on their 1-3 lactation were investigated. SCC of milk was determined in 2632 milk samples collected from lactating dairy
ewes. On the basis of SCC the dairy ewes were divided into the five groups: G1= SCC <100×103 cells.ml-1, G2= SCC between 100-300×103 cells.ml-1, G3= SCC between 300-600×103 cells.ml-1, G4= SCC between 600-1000×103 cells.ml-1 and G5= SCC >106 cells.ml-1 to study the frequency of distribution of health problems of mammary gland in selected group of ewes throughout experimental per iod. In total the percentage of samples in first three groups was 78 %. T he ewes of T S and IV had higher percentage of samples in G1 and lower in G5 as compared with L, TSxLC and IVxLC. In conclusion, the high percentage of ewes in a groups under 600×103 cells.ml-1 could indicate possible legislative limit for SCC related to good udder health in a future legislative.
ART ICLE INFO
Received 27. 11. 2014 Revised 3. 12. 2014 Accepted 4. 12. 2014 Published 2. 2. 2015
Regular article
J Microbiol Biotech Food Sci / Tančin et al. 2015 : 4 (special issue 3) 148-151
149 Laboratory analysis
Milk samples from each udder were transported to the certificated Central
laboratory of Plemenárske služby š.p. Bratislava for milk analysis.
C ate gorie s of somatic ce ll count (SC C )
According to animals, the dairy ewes were divided into the five groups on the
basis of individual SCC (G1= SCC <100×103 cells.ml-1, G2= SCC between 100-300×103 cells.ml-1, G3= SCC between 300-600×103 cells.ml-1, G4= SCC between 600-1000×103 cells.ml-1 and G
5= SCC >106 cells.ml-1 to study the frequency of distribution of animals in selected group of ewes throughout experimental period. T he frequency of distribution of ewes in different SCC sorting groups was also study depending on year of study (three years), the parity (three parities – first, second and third), stage of lactation (calculated from the date of lambing till the date of milk recording to set up first month, second, third, fourth, fifth and sixth month), season (sampling periods – April, May, Jun, July, August) and breed and cross-breed. Statistical analysis was done by Microsoft Excel program.
RESULTS AND DISC USSIO N
T he detection of udder health in cattle, especially subclinical mastitis, is based on SCC. However in dairy sheep the physiological and pathophysiological
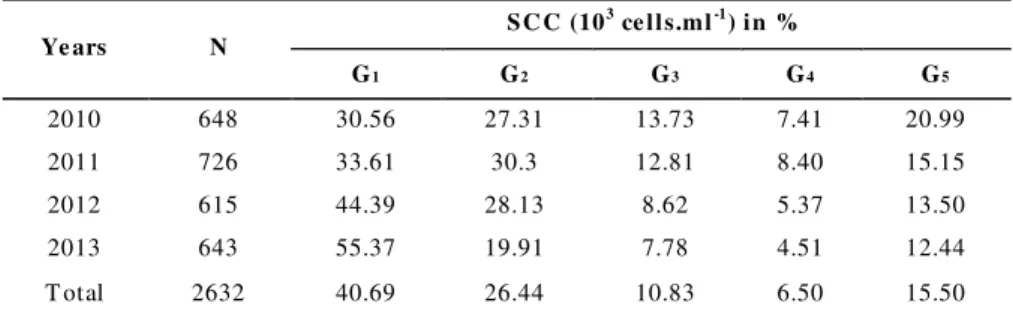
thresholds of SCC are still no established (Berthe lot et al., 2006). Our results showed that from total of 2632 examined milk samples, the most milk samples were classified within G1 SCC group ( <100×103 cells.ml-1) with 40.69 %. T he year of study positively influenced the frequency of distribution of animals in groups. T he udder health status of ewes had clearly improved during the following years and caused the rise of percentages of samples in SCC less than 100×103 cells.ml-1 (G
1) and decreased the percentages of samples in SCC >106 cells.ml-1 (G5) in milk at the end of the survey. In total the percentage of samples in first three groups was 78 %, even in 2013 the value was 83 %. Improving the SCC status in ewes from year to year of study and high % of animals under 106 cells/ml correspond to results of another authors (Berthelot et al., 2006) which could be explained by the high percentage of bacteriologically negative milk samples in another study from Slovakia (Vasil et al., 2013). T he presences of microorganisms also influence the SCC if the udder is infected by “minor” or
“major” pathogens (Suarez et al., 2002). Last mentioned author found out those
negative samples (free of microorganisms) had arithmetic means 244 470 cells.ml-1, samples contaminated with minor pathogens reached means 1 044 100 cells.ml-1 and samples with major pathogens 2 045 652 cells.ml-1. Thus the study of relationship between infection (presence of pathogens in udder) and SCC in milk is required under condition of sheep dairy farming in Slovakia more in detail. T he changes in milk samples distribution throughout evaluated years indicate great possibilities to improve udder health in the dairy practice.
Table 1 Frequency of distribution of SCC in milk samples from ewes during 2010 -2013
Ye ars N
SC C (103 ce lls.ml-1) in %
G1 G2 G3 G4 G5
2010 648 30.56 27.31 13.73 7.41 20.99
2011 726 33.61 30.3 12.81 8.40 15.15
2012 615 44.39 28.13 8.62 5.37 13.50
2013 643 55.37 19.91 7.78 4.51 12.44
T otal 2632 40.69 26.44 10.83 6.50 15.50
G1= Group1 of (SCC <100×103 cells.ml-1), G2= (SCC between 100-300×103 cells.ml-1), G3= (SCC between 300-600×103 cells.ml-1 , G
4= (SCC between 600-1000×103 cells.ml-1) and G5= (SCC >106 cells.ml-1), N= T he number of ewes.
According to the individual breeds and their crossbreds in G1, the lowest percentage was calculated in crossbreds Improved Valachian cross Lacaune (IV×LC) with 38.63 %, followed Lacaune (LC) with 38.82 %, crossbred of
Tsigai and Lacaune (TS×LC) with 41.03 % and the highest in T sigai (T S) with
47.39 % (T able 2). Whilst, in Improved Valachian (IV) it is very difficult to
interpret the results of this breed, because the number of ewes was low (only 54 milk samples). Margetín et al. (2013) did not find out significant differences among above mentioned genotype groups. Higher SCC was found out in L as compared with Manchega ewes (Rovai et al., 2014).
Table 2 Frequency of distribution of SCC in milk samples from different breeds and their crossbreds
Bre eds N
SC C (103 ce lls.ml-1) in %
G1 G2 G3 G4 G5
T S 211 47.39 29.38 9.00 5.21 9.00
TS×LC 814 41.03 23.10 12.41 6.63 16.83
LC 577 38.82 27.4 11.61 6.7 16.46
IV 54 66.67 24.7 5.56 3.70 0.00
IV×LC 976 38.63 28.38 9.73 7.7 16.19
SCC- Somatic cell count, T S- T sigai, LC- Lacaune, IV- Improved Valachian, TS×LC- crossbreeds,
IV×LC- crossbreeds
For groups see table 1.
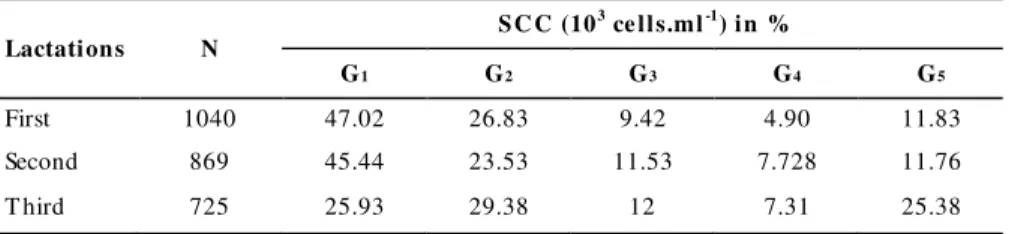
T he frequency of distribution of SCC in milk samples in different numbers of lactation (parity) of dairy ewes were recorded in Table 3. The highest percentages of ewes in G1 group were in first lactating ewes, followed by second and third lactating ones. With the exception of 1-year-old ewes, no significant differences were observed in SCC as affected by age or parity (Suarez et al., 2002). Similar results were published by Arias et al. (2012), who did not see the effect of parity on SCC except first lactation. Paape et al. (2007) did not find out changes in SCC with increasing of parity.
J Microbiol Biotech Food Sci / Tančin et al. 2015 : 4 (special issue 3) 148-151
150 udder ewes increased after fifth months which correspond to our results (T able 4). SCC changes throughout lactation are connected to the parity in dairy ewes (Paape et al., 2007). Las mentioned authors found out similar changes throughout lactation as we are presenting but not in all parities. In general,
mentioned authors pointed out that non-infectious factors such as parity and stage of lactation had minimal effects on SCC for sheep.
Table 3 Frequency of distribution of SCC in milk samples in different numbers of lactation (parity)
Lactations N
SC C (103 ce lls.ml-1) in %
G1 G2 G3 G4 G5
First 1040 47.02 26.83 9.42 4.90 11.83
Second 869 45.44 23.53 11.53 7.728 11.76
T hird 725 25.93 29.38 12 7.31 25.38
For groups see table 1.
Table 4 Frequency of distribution of SCC in milk samples in different stage of lactation
Month in
milk N
SC C (103 ce lls.ml-1) in %
G1 G2 G3 G4 G5
First 47 44.68 36.17 8.51 4.26 6.38
Second 603 35.16 28.19 11.61 5.31 19.73
T hird 547 43.30 25.87 8.62 6.6 16.15
Fourth 662 41.84 23.56 11.93 7.55 15.12
Fifth 648 42.90 27.16 10.80 7.10 12.4
Sixth 127 36.22 29.13 11.81 6.30 16.54
For groups see table 1.
Table 5 shows the frequency of distribution of SCC in milk samples in different months (season) of the year. Higher frequency of SCC in G1 was shown during the period of June, July and August (summer month), compared with April and May (spring months). Arias et al. (2012) found out significant lower SCC during spring than during summer and winter period which does not corresponds to our findings. Our experimental animals were lambing in winter period and thus the
seasonal changes in the frequency of SCC distribution are related to the stage of lactation (T able 4) though housing of ewes in April was inside the sheepfold, which is warm and, humid, supplying increased susceptibility to environmental pathogens (Marogna et al., 2010).
Table 5 Frequency of distribution of SCC in milk samples in different season (months)
Se ason/
(months) N
SC C (103 ce lls.ml-1) in %
G1 G2 G3 G4 G5
April 603 34.16 29.19 11.61 5.14 19.90
May 499 40.68 27.5 9.22 7.21 15.83
June 708 43.79 21.89 12.1 6.78 15.54
July 716 42.04 29.33 10.6 7.12 11.45
August 103 47.57 18.45 11.65 4.85 17.48
For groups see table 1.
C O NC LUSIO N
In our study in total the percentage of samples in first three groups below 600×103 cells.ml-1 was 78 %, which indicate possible good health status of experimental ewes. T he ewes of T S and IV had higher percentage of samples in G1 and lower in G5 as compared with L, T SxLC and IVxLC. Obtained results could indicate possible legislative limit for SCC related to good udder health in a future legislative. However more detail study is needed to see relationship between high SCC and presence of microorganisms to better understanding the reasons the physiological and pathological SCC in the udder.
Acknowle dge me nts: T his publication was written during realization of the project "MLIEKO No 26220220196" supported by the Operational Programme Research and Development funded from the European Regional Developm ent Fund. Kega 006SPU-4/2014 “Modernization of teaching of domestic animal hygiene“.
REFERENC ES
ANTONIČ, J., JACKULIAKOVÁ, L., UHRINČAŤ, M., MAČUHOVÁ, L., ORAVCOVÁ, M., TANČIN, V. 2013. Changes in milk yield and composition after lamb weaning and start of machine milking in dairy ewes. Slovak Journal of
Anim al Science, 46(3), 93-99.
ARIAS, R., OLIET E, B., RAM, M., ARIAS, C., GALLEGO, R., MONT ORO, V., GONZALO, C. AND EZ-GUZM, M. D. P . 2012. Long-term study of environmental effects on test -day somatic cell count and milk yield in Manchega sheep. Sm all Rum inant Research, 106(2-3), 92–97. http://dx.doi.org/10.1016/j.smallrumres.2012.03.019
BERGONIER, D., BERT HELOT, X. 2003: New advances in epizootiology and control of ewe mastitis. Livestock Production of Science, 79(1), 1-16. http://dx.doi.org/10.1016/s0301-6226(02)00145-8
BERT HELOT X., LAGRIFFOUL, G., CONCORDET , D., BARILET T , F., BERGONIER. D. 2006. Physiological and pathological thresholds of somatic cell counts in ewe milk. Sm all Rum inant Research, 62(1-2), 27-31.
http://dx.doi.org/10.1016/j.sm allrum res.2005.07.047
KUKOVICS, S., MOLNAR, A., ABRAHAM, M., NEMETH, T., KOMLOSI, I. 2006. Effects of udder traits on the milk yield of sheep. Archiv fur Tierzucht, 49(2), 165-175.
J Microbiol Biotech Food Sci / Tančin et al. 2015 : 4 (special issue 3) 148-151
151 quality of milk and udder health status of ewes during machine milking. Journal
of Central European Agriculture, 14(1), 328-340.
http://dx.doi.org/10.5513/jcea01/14.1.1203
MAROGNA, G., ROLESU, S., LOLLAI, S., T OLA, S., LEORI, G. 2010. Clinical findings in sheep farms affected by recurrent bacterial mastitis. Small Ruminant Research, 88(2-3), 119-125. http://dx.doi.org/10.1016/j.smallrumres.2009.12.019
MILERSKI, M., MARGETÍN, M., APOLEN, D., ČAPISTRÁK, A., ŠPÁNIK, J. 2005. Udder cistern size and milkability of ewes of various genotypes, in: Conference on „Physiological and technical aspects of machine milking, Nitra, 2005, ICAR Technical series No. 10, pp. 63 -69 (ISSN 1563-2504, ISBN 92-95014-07-3).
OLECHNOWICZ, J., JAŚKOWSKI, J. M., ANTOSIK, P., BUKOWSKA, D. 2009. Milk yield and composition in line 05 dairy ewes as related to somatic cell counts. Journal of Anim al and Feed Sciences, 18, 420–428.
ORAVCOVÁ, M., GROENEVELD, E., KOVAČ, M., PEŠKOVIČOVÁ, D., MARGET IN, M. 2005. Estimation of genetic and environmental parameters of milk production traits in Slovak purebred sheep using test -day model. Sm all
Rum inant Research, 56(1-3), 113–120.
http://dx.doi.org/10.1016/j.smallrumres.2004.03.002
ORAVCOVÁ M., M. MARGET, D. PEŠKOVIČOVÁ, J. DAŇO, M. MILERSKI, L. HETÉNYI, P. POLÁK 2007: Factors affecting ewe’s milk fat and protein content and relationships between milk yield and milk components.
Czech Journal of Anim al Science, 52(7), 189–198.
PAAPE, M. J., WIGGANS, G. R., BANNERMAN, D. D., T HOMAS, D. L., SANDERS, A. H., CONT RERAS, A., MORONI, P., MILLER, R. H. 2007. Monitoring goat and sheep milk somatic cell counts. Small Rum inant Research, 68(1-2), 114–125. http://dx.doi.org/10.1016/j.smallrumres.2006.09.014
RAYNAL-LJUTOVAC, K., PIRISI, A., DE CRÉMOUX, R., GONZALO, C. 2007: Somatic cells of goats and sheep milk: Analytical, sanitary, productive and technological aspects. Sm all Rum inant Research, 68(1-2), 126-44. http://dx.doi.org/10.1016/j.smallrumres.2006.09.012
ROMEO, M., EST NAL, A., CONTRERAS, A., ADURIZ, J.J., GONZALEZ, L., MARCO, J.C. 1996. Evolution of milk somatic cell counts along the lactation period in sheep of the Laxtra breed. Somatic cell and milk of Small Ruminants. In. Proceedings of the International Symposium, vol. 77, Bella, Italy. EAAP Publication, pp. 21-25.
ROVAI, M., CAJA, G., SALAMA, A. A. K., JUBERT, A., LÁZARO, B.,
LÁZARO, M., LEITNER, G. 2014. Identifying the major bacteria causing
intramammary infections in individual milk samples of sheep and goats using traditional bacteria culturing and real-time polymerase chain reaction. Journal of
Dairy Science, 97 :5393–5400. http://dx.doi.org/10.3168/jds.2014-7988
RUPP, R., LAGRIFFOUL, G., AST RUC, J. M., BARILET T F. 2003. Genetic Parameters for Milk Somatic Cell Scores and Relationships with Production T raits in French Lacaune Dairy Sheep. Journal of Dairy Science, 86(4), 1476– 1481. http://dx.doi.org/10.3168/jds.s0022-0302(03)73732-1
SUAREZ, V.H, BUSET T I, M.R., MIRANDA, A.O., CALVINHO, L.F., BEDOT TI, D.O., CANAVESIO, V.R. 2002. Effect of infectious status and parity on somatic cell count and California mastitis test in pampinta dairy ewes. Journal of veterinary m edicine series b-infectious diseases and veterinary public health, 49(5), 230-234. http://dx.doi.org/10.1046/j.1439-0450.2002.00552.x