Enhancement of nutritional and bioactive compounds by
in vitro
culture
of wild
Fragaria vesca
L. vegetative parts
Maria Inês Dias
a,b,c, Lillian Barros
a,c, Maria João Sousa
a, M. Beatriz P.P. Oliveira
b, Celestino Santos-Buelga
d,
Isabel C.F.R. Ferreira
a,⇑aMountain Research Centre (CIMO), ESA, Polytechnic Institute of Bragança, Campus de Santa Apolónia, 1172, 5300-253 Bragança, Portugal
bREQUIMTE/LAQV, Science Chemical Department, Faculty of Pharmacy of University of Porto, Rua Jorge Viterbo Ferreira, 228, 4050-313 Porto, Portugal
cLaboratory of Separation and Reaction Engineering (LSRE), Associate Laboratory LSRE/LCM, Polytechnic Institute of Bragança, Campus de Santa Apolónia, 1134, 5301-857 Bragança,
Portugal
dGrupo de Investigación en Polifenoles (GIP-USAL), Facultad de Farmacia, Universidad de Salamanca, Campus Miguel de Unamuno s/n, 37007 Salamanca, Spain
a r t i c l e
i n f o
Article history:
Received 19 January 2017
Received in revised form 3 May 2017 Accepted 11 May 2017
Available online 12 May 2017
Keywords: Fragaria vescaL.
In vitroculture Nutritional value Phenolic compounds
a b s t r a c t
In vitroculture emerges as a sustainable way to produce bioactives for further applicability in the food industry. Herein, vegetative parts ofFragaria vescaL. (wild strawberry) obtained byin vitroculture were analyzed regarding nutritional and phytochemical compounds, as well as antioxidant activity. These samples proved to have higher content of protein, polyunsaturated fatty acids, soluble sugars, organic acids (including ascorbic acid) and tocopherols (mainlya-tocopherol) than wild grownF. vesca, as well as containing additional phenolic compounds. The antioxidant activity of hydromethanolic extracts could be correlated with the content of different phenolic groups and other compounds (sugars and organic acids). It was demonstrated thatin vitroculture could enhance nutritional and bioactive compounds of Fragaria vescaL. plants, providing a very interesting biotechnological tool for potential food applications.
Ó2017 Elsevier Ltd. All rights reserved.
1. Introduction
Wild strawberry (Fragaria vesca L., Rosaceae family) can be commonly found in Europe, Japan, North America and Canada, growing wild in mountain zones, forests, on slopes and roadsides (Castroviejo et al., 1998). The plant is mainly appreciated for its sweet small fruits; however the vegetative parts have been described as important sources of macro and micronutrients and also phenolic compounds (procyanidins, ellagic acid and hydrox-ycinnamoyl derivatives) with strong antioxidant activity (Dias, Barros, Fernandes, et al., 2015;Dias, Barros, Morales, et al., 2015). Vegetative parts fromF. vescacould provide tonic, antiseptic and detoxifying properties. Furthermore, its decoctions and infusions have been traditionally used to treat urinary tract infections and hypertension, presenting also antidiarrheal and anticoagulant activity (Camejo-Rodrigues, Ascensão, Bonet, & Vallès, 2003; Pawlaczyk, Czerchawski, Pilecki, Lamer-Zarawska, & Gancarz, 2009; Savo, Giulia, Maria, & David, 2011; Özüdoru, Akaydin, Erik, & Yesilada, 2011).
The growing demand for natural products that complement their nutritional role with additional functional properties requires innovation in the ways to obtain these products, in order to protect wild populations from where they are obtained, and also to avoid competing directly with crops that are used for food (Godfray et al., 2012). Plant tissue culture appears as a valuable technique to produce secondary metabolites, being an ecological and sustain-able alternative for the production of endangered species (by over-exploitation), as well as a means to obtain bioactive extracts and compounds that can be further applied in pharmaceutical/medical fields or in the food industry. Indeed, this approach has been endorsed by FAO as a safe process to produce compounds for food applications (Dias, Sousa, Alves, & Ferreira, 2016). Regardless of cli-mate or geographical conditions, this technique allows a continu-ous production of natural compounds under a very restricted controlled regime (Anand, 2010; Karuppusamy, 2009).
The nutritional value and chemical profile of vegetative parts of F. vesca were previously reported by our research group (Dias, Barros, Morales, et al., 2015). The presence of sugars and organic acids was also described in its fruits (Doumett et al., 2011; Ornelas-Paz et al., 2013), while phenolic compounds and related bioactive properties were reported in different plant parts (fruits, leaves and roots) (Dias et al., 2016;Dias, Barros, Fernandes, et al., 2015; Dias, Barros, Oliveira, Santos-Buelga, & Ferreira, 2015c).
http://dx.doi.org/10.1016/j.foodchem.2017.05.060 0308-8146/Ó2017 Elsevier Ltd. All rights reserved.
⇑Corresponding author.
E-mail address:[email protected](I.C.F.R. Ferreira).
Contents lists available atScienceDirect
Food Chemistry
These compounds were also described inF. vescaobtained from in vitroculture, after optimization of growth conditions (concen-tration of plant regulators and regeneration enhancers) (Yildirim & Turker, 2014). Nevertheless and to the author’s best knowledge, no other components have been studied.
In the present work, vegetative parts ofFragaria vescaL. were obtained byin vitroculture and further characterized in terms of macronutrients, fatty acids, soluble sugars, organic acids, toco-pherols and phenolic compounds; their antioxidant activities were also studied. The studies were carried out with lyophilized mate-rial, hydromethanolic extracts and aqueous consumption forms (infusions and decoctions).
2. Materials and methods
2.1. Standards and reagents
Acetonitrile (99.9%),n-hexane (95%) and ethyl acetate (99.8%) were of HPLC grade from Fisher Scientific (Lisbon, Portugal). Ace-tonitrile (fluorescence grade) was bought from Fisher Scientific (Madrid, Spain). Formic acid was purchased from Prolabo (VWR International, France). Fatty acids methyl ester (FAME) reference standard mixture (standard 47885-U) was purchased from Sigma (St. Louis, MO), alongside other individual fatty acid methyl ester isomers, Trolox (6-hydroxy-2,5,7,8-tetramethylchroman-2-car boxylic acid), l-ascorbic acid, tocopherol, sugar and organic acid standards. Phenolic standards were from Extrasynthèse (Genay, France). 2,2-Diphenyl-1-picrylhydrazyl (DPPH) was obtained from Alfa Aesar (Ward Hill, MA,). All other general laboratory reagents were purchased from Panreac Química S.L.U. (Barcelona, Spain). Water was treated in a Milli-Q water purification system (TGI Pure Water Systems, USA).
2.2. Samples and establishment of an in vitro culture of Fragaria vesca L
The samples of wildFragaria vesca L. fruits were collected in Serra da Nogueira, Bragança, north-eastern Portugal, in July 2013. The establishment of thein vitro culture was achieved by using the wild fruits with seeds. The fruits were washed with tap water and sterilized with bleach and detergent for 5 min under agitation, washed with sterilized water and inoculated in a basic medium for seed germination with water and agar (0.9%) and kept in the dark until germination. The seedlings were then detached from the fruit and placed in a modified culture medium (Murashige & Skoog, 1962) supplied with macronutrients, l mg/L thiamine, 1 mg/L nico-tinic acid, 1 mg/L pyridoxine, 2% sucrose, 0.5 mg/L BAP (benzy-laminopurine) and 0.5 mg/L IBA (indole-3-butyric acid). The pH culture medium was adjusted to 5.7 before autoclaving. The cul-ture conditions were Tmin [16–18]°C, Tmax [24–26]°C with a
photoperiod of 16/8 h (light/dark) supplied by light bulbs (Silvana day light; Philips, Eindhoven, Netherlands). The plants were kept under the same culture conditions and subcultured every month, collecting the aerial parts obtained underin vitroconditions and keeping the roots and shoots for further growth and collection of new material. The collected aerial parts were stored at 20°C,
lyo-philized and reduced to a fine powder for further analysis.
2.3. Preparation of the aqueous consumption forms
For infusions preparation, the lyophilized plant material (500 mg) was added to 100 mL of boiling distilled water (pH 6.6) at 100°C, left to stand at room temperature for 5 min and then
fil-tered (0.22
l
m) under reduced pressure.For decoctions preparation, the lyophilized plant material (500 mg) was added to 100 mL of distilled water, heated and boiled for 5 min. The mixture was left to stand for 5 min and then filtered under reduced pressure. The extracts obtained by infusion and decoction were lyophilized for further analysis of phenolic com-pounds and antioxidant activity.
2.4. Nutritional value of the lyophilized plant material
2.4.1. Proximate composition
The lyophilized plant material was analyzed for proteins, fat, carbohydrates and ash according to AOAC procedures (AOAC, 2005). The crude protein content (N6.25) was estimated by the macro-Kjeldahl method (AOAC, 991.02); the crude fat (AOAC, 989.05) was determined by extracting a known weight of pow-dered sample with petroleum ether, using a Soxhlet apparatus; the ash content (AOAC, 935.42) was determined by incineration at 550 ± 15°C; Total carbohydrates were calculated by difference.
Total energy was calculated according to the following equation:
Energyðkcal=100gÞ ¼4 ðgproteinsþgcarbohydratesÞ þ9 ðgfatÞ;
according to the (Regulation (EC) No 1169/2011, 2011).
2.4.2. Fatty acids
Fatty acids were determined in the lyophilized plant material, after a transesterification process, as previously described (Barros et al., 2013). The fatty acids profile was analyzed using a gas chro-matograph (model GC 1000 instrument; DANI, Contone, Switzer-land) equipped with a split/splitless injector and a flame ionization detector (GC-FID, 260°C) and a Macherey-Nagel (Düren,
Germany) column (0.5 g/kg cyanopropyl-methyl-0.5 g/kg phenyl-methylpolysiloxane, 30 m0.32 mm i.d.0.25
l
m film thick-ness). The oven temperature program was as follows: the initial temperature of the column was 50°C, held for 2 min, then a30°C/min ramp to 125°C, 5°C/min ramp to 160°C, 20°C/min
ramp to 180°C, 3°C/min ramp to 200°C, 20°C/min ramp to
220°C and held for 15 min. The carrier gas (hydrogen) flow rate
was 4.0 mL/min (61000 Pa), measured at 50°C. Split injection
(1:40) was carried out at 250°C. Identifications were made by
comparing the relative retention times of FAME (fatty acid methyl esters) peaks of the samples with commercial standards. The results were recorded and processed using Clarity 4.0.1.7 Software (DataApex, Prague, Czech Republic) and expressed as a relative percentage of each fatty acid.
2.5. Chemical characterization of the lyophilized plant material and aqueous consumption forms
2.5.1. Soluble sugars
The extraction of soluble sugars from the lyophilized plant material was carried out following the procedure described by Barros et al. (2013), while for the aqueous preparations the analy-sis was carried out directly. Soluble sugars were determined by high-performance liquid chromatography equipment consisting of an integrated system with a pump (Smartline system 1000; Knauer, Berlin, Germany), degasser system (Smartline Mmanager 5000) and autosampler (AS-2057; Jasco, Easton, MD), coupled to a refractive index detector (HPLC-RI; Smartline system 1000; Knauer, Berlin, Germany), as previously described (Barros et al., 2013). The chromatographic separation was achieved with a Euro-spher 100–5 NH2column (5mm, 2504.6 mm i.d., Knauer) oper-ating at 35°C. The mobile phase was acetonitrile:deionized water
quan-tification was performed using the internal standard (melezitose) method and by using calibration curves obtained from commercial standards of each compound. The results were expressed in g per 100 g dry weight or in mg per 100 mL in the case of infusions and decoctions.
2.5.2. Organic acids
The extraction of organic acids from the lyophilized plant mate-rial was carried out following the procedure described byBarros et al. (2013), while for the aqueous preparations the analysis was carried out directly. Vitamin C and other organic acids were deter-mined by ultra-fast liquid chromatography coupled to photodiode array detection (UFLC-PDA; Shimadzu Corporation, Kyoto, Japan) and following a procedure previously described (Barros et al., 2013). Separation was achieved on a SphereClone (Phenomenex, Torrance, CA) reverse phase C18 column (5mm, 2504.6 mm) thermostatted at 35°C. The elution was performed with sulfuric
acid (3.6 mmol/L) using a flow rate of 0.8 mL/min. The quantifica-tion was performed by comparison of the area of the peaks recorded at 215 nm and 245 nm (for ascorbic acid) as preferred wavelengths with calibration curves obtained from commercial standards of each compound. The results were expressed in g per 100 g of dry weight or in mg per 100 mL in the case of infusions and decoctions.
2.5.3. Tocopherols
The extraction of tocopherols from the lyophilized plant mate-rial was carried out following the procedure described byBarros et al. (2013), while for the aqueous preparations the analysis was carried out directly using HPLC coupled to a fluorescence detector (FP-2020; Jasco, Easton, MD) programmed for excitation at 290 nm and emission at 330 nm. The chromatographic separation was achieved with a Polyamide II normal-phase column (5mm, 2504.6 mm i.d.; YMC, Waters Corporation, Milford, MA), operat-ing at 35°C. The mobile phase used was a mixture ofn-hexane and
ethyl acetate (70:30,v/v) at a flow rate of 1 mL/min. The identifica-tion was performed by chromatographic comparisons with authentic standards, while the quantification was based on the flu-orescence signal response of each standard, using the internal stan-dard (tocol) method and by using calibration curves obtained from commercial standards of each compound. The results were expressed in
l
g per 100 g of dry weight or inl
g per 100 mL in the case of infusions and decoctions.2.6. Analysis of phenolic compounds and antioxidant activity of hydromethanolic extracts and aqueous consumption forms
2.6.1. Preparation of the hydromethanolic extracts
The lyophilized plant material (1 g) was submitted to an extrac-tion with a methanol:water mixture (80:20,v/v; 30 mL) at 25°C
and 150 rpm for 1 h, followed by filtration through a Whatman No. 4 filter paper. The residue was then extracted with one addi-tional 30-mL portion of the hydromethanolic mixture. The com-bined extracts were evaporated under reduced pressure (R-210 rotary evaporator; Büchi, Flawil, Switzerland) and further lyophilized.
2.6.2. Phenolic compounds
The lyophilized extracts, infusions and decoctions were re-dissolved in methanol:water (80:20,v/v) and pure water, respec-tively, to determine the phenolic profiles by HPLC (Hewlett-Packard 1100, Agilent Technologies, Santa Clara, CA), as previously described (Guimarães et al., 2013). Detection was carried out with a diode array detector (DAD) using 280 nm and 370 nm as the pre-ferred wavelengths connected in line with a mass spectrometer (API 3200 Qtrap; Applied Biosystems, Darmstadt, Germany). The
phenolic compounds were identified by comparison of their reten-tion times, UV–Vis and mass spectra with those obtained from standard compounds, if existing. Otherwise, peaks were tentatively identified by comparing the obtained information with previous studies performed in our laboratory (Dias, Barros, Fernandes, et al., 2015; Dias, Barros, Oliveira, et al., 2015; Dias, Barros, et al., 2016) and data in the literature (Del Bubba et al., 2012; Gasperotti et al., 2013; Simirgiotis & Schmeda-Hirschmann, 2010; Sun, Liu, Yang, Slovin, & Chen, 2014; Yildirim & Turker, 2014). For quantitative analysis, individual standards calibration curves were constructed based on the area of the peaks recorded at 280 nm or 370 nm. For the identified phenolic compounds with no available commercial standard, the quantification was per-formed based on the calibration curve of a similar compound belonging to the same phenolic group. The results were expressed in mg per g of plant material.
2.6.3. Antioxidant activity
The lyophilized extracts, infusions and decoctions were re-dissolved in methanol:water (80:20,v/v) and water, respectively, to obtain stock solutions of 0.625 mg/mL, which were further diluted to obtain a range of six concentrations below the stock solution for antioxidant activity evaluation.
DPPH radical-scavenging activity was evaluated by using an ELX800 microplate reader (Bio-Tek Instruments, Inc., Winooski, VT), mixing 270
l
L of DPPH solution (6105mol/L) with 30l
L of sample concentrations; mixtures were left for one hour in the dark at room temperature. The percentage of DPPH discoloration was calculated using the formula: [(ADPPH AS)/ADPPH]100, whereASis the absorbance of the solution containing the sample at 515 nm, and ADPPH is the absorbance of the DPPH solution (Barros, Heleno, Carvalho, & Ferreira, 2009; Barros et al., 2013).Reducing power was evaluated by the capacity to convert Fe3+ into Fe2+by mixing an aliquot of the extract solutions (0.5 mL) with 0.5 mL of sodium phosphate buffer (200 mmol/L, pH 6.6) and 0.5 mL of potassium ferricyanide (1%w/v) and incubating at 50°C
for 20 min. The mixture (0.8 mL) was then placed in 48-well micro-plates containing 0.8 mL of deionised water and 0.16 mL of ferric chloride (0.1%w/v), measuring the absorbance at 690 nm in the microplate reader mentioned above (Barros et al., 2009; Barros et al., 2013). Inhibition of b-carotene bleaching was evaluated
through theb-carotene/linoleate assay; briefly a 0.2 mg/mL
solu-tion ofb-carotene was prepared to which was added linoleic acid
(40 mg), Tween 80 (400 mg) and distilled water (100 mL) in a flask, followed by vigorous shaking. Different concentrations of the extracts (0.2 mL) were added to test tubes and mixed with aliquots of the previously prepared emulsion (4.8 mL) and zero time absor-bance was measured at 470 nm. The test tubes were put in a water bath at 50°C for 2 h, after which the absorbance was measured.
The neutralization of linoleate free radicals prevents b-carotene
bleaching, which is measured by the formula:
ðb carotene absorbance after 2 h of assay=initial absorbanceÞ
100
(Barros et al., 2009; Barros et al., 2013).
Lipid peroxidation inhibition in porcine brain homogenates was evaluated by the decrease in thiobarbituric acid reactive sub-stances (TBARS). Firstly, a pig brain tissue (Sus crofa) homogenate was prepared with ice-cold Tris-HCl buffer (20 mM, pH 7.4). The obtained supernatant was incubated with extract solutions (0.2 mL), FeSO4 (10
l
M; 0.1 ml) and ascorbic acid (0.1 mM; 0.1 mL) at 37°C for 1 h. The reaction was then stopped withtri-chloroacetic acid (28%w/v, 0.5 mL), followed by thiobarbituric acid (TBA, 2%w/v, 0.38 mL), and the mixture was then heated at 80°C
malondialdehyde-thiobarbituric acid (MDA-TBA) was measured by its absorbance at 532 nm; the inhibition ratio (%) was calculated using the formula: [(A B)/A]100%,whereAandBwere the absorbances of the con-trol and the sample solution, respectively (Barros et al., 2013; Barros, Heleno, Carvalho, and Ferreira, 2009). The final results were expressed as EC50values (
l
g/mL), sample concentration providing 50% of antioxidant activity or 0.5 of absorbance in the reducing power assay. Trolox was used as positive control.2.7. Statistical analysis
All the extractions were performed in triplicate and all the assays were also carried out in triplicate. The results are expressed as mean values and standard deviation (SD). The results were ana-lyzed using Student’st-test, in order to determine the significant difference between two different samples, with
a
= 0.05. This treatment was carried out using SPSS v. 22.0 program.3. Results and discussion
3.1. Nutritional and chemical characterization of the lyophilized plant material and aqueous consumption forms
Data on the nutritional and chemical composition of thein vitro cultured vegetative parts ofF. vescaare shown inTable 1. Carbohy-drates (including fiber) were the most abundant macronutrient (84 g/100 g dw), followed by proteins, ash and fat (7, 6.5 and 2 g/100 g dw, respectively). Compared to wild grown vegetative parts ofF. vesca(Dias, Barros, Morales et al., 2015), thein vitro
sam-ple had higher content of protein and lower content of ash, whereas the values of fat and carbohydrates were similar.
Fourteen different fatty acids were found, more than half being polyunsaturated fatty acids (PUFA), mainly linoleic acid (C18:2n–6, 16%) and
c
-linolenic acid (C18:3n–6, 38%). Palmitic acid (C16:0) was also found at high levels (22%).Dias, Barros, Morales et al. (2015)reported lower percentages of total polyunsaturated fatty acids (41%) and higher levels of saturated fatty acids (53%) in wild-grown vegetative parts ofF. vesca. These results are motivat-ing, since PUFA are components of membrane phospholipids, serve as precursors of some hormones with vital roles in the human body and are also important in the protection against some diseases, such as rheumatoid arthritis, psoriasis and some age-related dis-eases, such as Alzheimer’s (Patil & Gislerød, 2006).The profile of soluble sugars in the lyophilized plant material (Table 1) and in the aqueous preparations (Table 2) was very sim-ilar, glucose being the most abundant in all samples (4 g/100 g dw in the dry sample, 9 mg/100 mL in the infusion and 10 mg/mL in the decoction). Fructose was the second major sugar found in the lyophilized plant material and in the decoction (3 g/100 dw and 7 mg/100 mL, respectively), while for the infusion sucrose (6 mg/100 mL) appeared as the second major sugar. Compared with the results obtained byDias, Barros, Morales, et al. (2015), thein vitrosample showed higher content of soluble sugars than the wild grown vegetative parts (total sugars = 6 g/100 g dw); fur-thermore, xylose was not previously described in the dry sample of F. vesca. These findings might indicate that the plant is producing larger amounts of sugars to maintain its vital functions of growth and development, since it is limited by thein vitroculture itself. In vitro plants have an incipient photosynthesis, and for that a higher amount of sugars in the medium is required, but some plants, underin vitroconditions, have a photosynthetic apparatus more developed than others, and if so, they can produce and store more sugars, like glucose, mannose, xylose or even raffinose; the type of sugar depends on the type of transportation in phloem, and that depends on the genetic characteristics of the plant species (Yaseen, Ahmad, Sablok, Standardi, & Hafiz, 2013).
Table 1
Nutritional value, fatty acids, soluble sugars, organic acids and tocopherols content of
in vitrocultured vegetative parts from wildFragaria vescaL. (mean ± SD). Nutritional value (g/100 g dw) Soluble sugars g/100 g dw Fat 2.37 ± 0.01 Xylose 0.98 ± 0.02 Proteins 7.27 ± 0.12 Fructose 2.55 ± 0.17 Ash 6.53 ± 0.20 Glucose 3.94 ± 0.17 Total carbohydrates 83.83 ± 0.06 Sucrose 2.20 ± 0.01 Energy
(kcal/100 g dw)
385.73 ± 0.57 Trehalose 0.35 ± 0.06
Sum 10.04 ± 0.26 Fatty acids (relative percentage) Organic acids g/100 g dw C6:0 0.16 ± 0.01 Oxalic acid 3.76 ± 0.06 C8:0 0.34 ± 0.01 Quinic acid 0.85 ± 0.05 C10:0 0.22 ± 0.02 Shikimic acid 0.002 ± 0.001 C12:0 2.65 ± 0.12 Ascorbic acid 0.02 ± 0.01 C14:1 3.03 ± 0.07 Succinic acid 1.58 ± 0.20 C15:1 0.61 ± 0.04 Fumaric acid tr C16:0 21.37 ± 0.17 Sum 6.20 ± 0.21 C16:1 0.56 ± 0.09
C17:0 0.57 ± 0.004 C18:1n9 5.62 ± 0.08 C18:2n6 16.11 ± 0.05
C18:3n6 37.54 ± 0.46 Tocopherols mg/100 g dw C20:1 6.85 ± 0.05 a-Tocopherol 98.54 ± 0.90 C22:1n9 4.38 ± 0.01 b-Tocopherol 4.90 ± 0.04 SFA 25.01±0.15 c-Tocopherol 24.86 ± 0.23
MUFA 21.34±0.56 d-Tocopherol 11.04 ± 0.10 PUFA 53.56±0.41 Sum 139.35 ± 1.27 nd- not detected; tr- traces. SFA- saturated fatty acids, MUFA- monounsaturated fatty acids, PUFA- polyunsaturated fatty acids. Calibration curves for organic acids: oxalic acid (y= 9x10⁶x+ 377946,R2= 0.994); quinic acid (y= 6010607x+ 46061,
R2= 0.9995); shikimic acid (y =7x10⁷ x+ 175156, R2= 0.9999); ascorbic acid (y= 108x+ 751815,R2= 0.998); succinic acid (y= 603298x+ 4994.1,R2= 1) and fumaric acid (y= 154862x+ 1x10⁶,R2= 0.9977). (<LOD: 12.6, 24, 6, 3, 19 and 0.080 mg/mL for oxalic, quinic, shikimic, ascorbic, succinic and fumaric acid respectively);
(<LOQ: 42, 81, 19, 11, 64 and 0.26mg/mL for oxalic, quinic, shikimic, ascorbic,
succinic and fumaric acid respectively).
Table 2
Soluble sugars, organic acids and tocopherols contents in infusions and decoctions prepared fromin vitrocultured vegetative parts of wildFragaria vescaL. (mean ± SD).
Infusions Decoctions t-Student p-value
Soluble sugars mg/100 mL mg/100 mL
Xylose 2.85 ± 0.07 2.89 ± 0.20 0.572 Fructose 6.12 ± 0.15 7.15 ± 0.39 < 0.001 Glucose 9.49 ± 0.05 10.14 ± 0.80 0.013 Sucrose 6.48 ± 0.27 3.29 ± 0.20 < 0.001 Trehalose 1.17 ± 0.14 0.66 ± 0.14 < 0.001 Sum 26.13 ± 0.23 24.13 ± 1.46 < 0.001 Organic acids mg/100 mL mg/100 mL
Oxalic acid 6.44 ± 0.01 5.55 ± 0.01 < 0.001 Quinic acid 4.958 ± 0.003 5.572 ± 0.001 < 0.001 Shikimic acid 0.086 ± 0.001 0.117 ± 0.001 < 0.001
Fumaric acid tr tr –
Sum 11.48 ± 0.26 11.24 ± 0.24 < 0.001 Tocopherols lg/100 mL lg/100 mL
a-Tocopherol 0.16 ± 0.02 0.17 ± 0.01 0.310
b-Tocopherol 1.82 ± 0.08 1.49 ± 0.01 < 0.001
Sum 1.98 ± 0.06 1.66 ± 0.01 < 0.001
tr- traces. Calibration curves for organic acids: oxalic acid (y= 9106x+ 377946,
R2= 0.994); quinic acid (y= 6010607 x+ 46061, R2= 0.9995); shikimic acid (y= 7107x+ 175156,R2= 0.9999); ascorbic acid (y= 108x+ 751815,R2= 0.998); succinic acid (y= 603298 x+ 4994.1, R2= 1) and fumaric acid (y= 154862 x
+ 1106,R2= 0.9977).(<LOD: 12.6, 24, 6 and 0.080mg/mL for oxalic, quinic,
shi-kimic and fumaric acid respectively); (<LOQ: 42, 81, 19 and 0.26mg/mL for oxalic,
Regarding organic acids, oxalic acid was the major one found in the lyophilized plant material (3.76 g/100 g dw) followed by suc-cinic acid (1.58 g/100 g dw); other acids, and among them ascorbic acid, were found at very low levels. Oxalic acid was also the pre-dominant acid found in the infusions, although in that case fol-lowed by quinic acid (6 and 5 mg/100 mL, respectively), and quite similar amounts of these two organic acids were found in decoctions. As for sugars and fatty acids, the organic acids content in thein vitrocultured samples was significantly higher than the one reported byDias, Barros, Morales, et al. (2015)in wild-grown vegetative parts and corresponding infusions (5.48 g/100 g dw, 9.99 mg/100 mL, respectively).
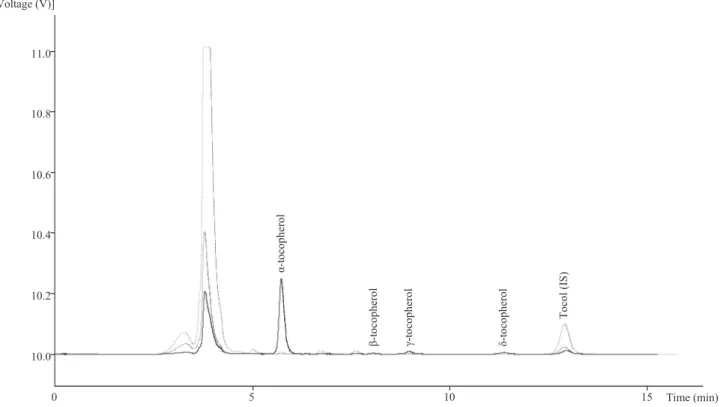
The four tocopherol isoforms were found in the lyophilized plant material, with
a
-tocopherol as predominant (99 mg/100 g dw) fol-lowed byc
-tocopherol (25 mg/100 g dw). However, onlya
- andb-tocopherol were detected in the infusions and decoctions, the latter being the major one in both preparations, as can be seen inFig. 1. The lower content of tocopherols in the aqueous preparations was expected, due to their lipophilic character. Quite interestingly, the lyophilized plant material, infusions and decoctions of thein vitro cultured samples herein studied showed much higher tocopherol levels (139 mg/100 dw, 1.98 and 1.66
l
g/100 mL, respectively) than the equivalent ones obtained from wild-grown vegetative parts ofF. vesca(7 mg/100 g dw, 0.19 and 0.22l
g/100 mL, respec-tively), in which only one isoform (a
-tocopherol) was reported in the infusions and decoctions (Dias, Barros, Morales, et al., 2015).3.2. Phenolic profile and antioxidant activity of the hydromethanolic extracts and aqueous preparations
Table 3presents the peak characteristics (retention time, wave-length of maximum absorption and mass spectral data), tentative identification and quantification of the phenolic compounds pre-sent in the hydromethanolic extracts, infusions and decoctions of thein vitrocultured vegetative parts ofF. vesca.An example pheno-lic profile of the hydromethanopheno-lic extract recorded at 280 and 370 nm is shown in Fig. 2. Thirty different phenolic compounds
where identified in the samples, four phenolic acids (peaks 8, 11, 12 and 14), twelve ellagic acid derivatives (peaks 1, 3, 9, 10, 15, 17, 18, 24, 25, 28, 29 and 30), four flavan-3-ols (peaks 2, 4, 6, and 7), nine flavonols (peaks 5, 13, 16, 19, 20, 21, 23, 26 and 27) and one dihydroflavonol (peak 22). The hydromethanolic extracts and the aqueous preparations showed a very similar profile, only distinguished at the quantification level and by the absence of some compounds in infusions and decoctions.
Most of the detected compounds (i.e., peaks 1–6, 8–10, 13, 15, 17–30) have been previously described in wildF. vescaand other Fragariaspecies (Del Bubba et al., 2012; Dias et al., 2016; Dias, Barros, Fernandes, et al., 2015; Dias, Barros, Oliveira, et al., 2015; Gasperotti et al., 2013; Simirgiotis & Schmeda-Hirschmann, 2010; Sun et al., 2014), so that their identities are assumed herein. To the author’s best knowledge, peaks 7, 11, 12, 14 and 16 have not been reported before inF. vesca. Although no information could be obtained regarding mass characteristics of peak 7, it was tenta-tively associated to a flavan-3-ol, based on the characteristic shape of its UV spectrum; the observedkmaxat 272 nm would point to a gallocatechin or a derived proanthocyanidin (e.g., a prodelphini-din), expected to have maximum wavelength at lower values than catechins and related procyanidins (278–280 nm). Peaks 11 and 12 were tentatively identified as coumaroylquinic acid isomers according to their pseudomolecular ion [M–H]–atm/z337, releas-ing fragments atm/z191 andm/z163 corresponding to the depro-tonated quinic acid and the coumaric acid moiety, respectively. Peak 14 was identified as feruloylquinic acid based on its pseudo-molecular ion [M–H]– m/zat 367 and the production of a major daughter ion atm/z193 [ferulic acid–H]–. Peak 16 showed a UV spectrum withkmaxat 368 nm, a pseudomolecular ion [M–H]– atm/z477 and MS2fragments atm/z315 and 301, which allowed its tentative identification as isorhamnetin-O-glucoside.
The methanolic extract presented higher concentrations of total phenolic compounds (44 mg/g) than the aqueous preparations (26–31 mg/g), mainly due to its greater content of ellagic acid derivatives (19 mg/g). Peak 17 (sanguiin H10 isomer) was the major compound found in the methanolic extracts, followed by
peak 4 (procyanidin dimer). Different observations regarding the phenolic profile ofin vitro-grown leaves ofF. vescawere made by Yildirim and Turker (2014), who only reported two compounds in common with those detected in our study (i.e., (+)-catechin and a procyanidin dimer), and in much lower amounts.
Smaller contents of phenolic compounds were determined in the present study than previously found in wild grown vegetative parts (Dias, Barros, Fernandes, et al., 2015a). A possible explanation might be the short stationary phase in the growth of thein vitro-cultured plants, which would lead to lower yields in the production of sec-ondary metabolites, due to the inhibition of the action of enzymes normally present in mature plants (Dias et al., 2016). Furthermore, in vitro-grown plants are not as subjected to environmental stress as wild plants, a factor that is known to influence phenolic accumula-tion. All in all, this could mean thatin vitro-grownF. vescawould need to be elicited to produce higher amounts of phenolics.
3.3. Antioxidant activity of the hydromethanolic extracts and aqueous preparations
The results on the antioxidant activity of the hydromethanolic extract, infusions and decoctions of in vitro cultured vegetative
parts are collected inTable 4. The hydromethanolic extract showed the highest DPPH-scavenging activity and reducing power (EC50= 83 and 57
l
g/mL, respectively), while for b-carotene bleaching inhibition and TBARS inhibition the lowest EC50values were observed for the infusions (EC50= 52 and 25l
g/mL, respec-tively). The results found for reducing power can be moderately correlated with the contents of phenolic acid derivatives in the samples (r2= 0.777), while for TBARS inhibition the results were highly correlated with these compounds (r2= 0.903), especially with ellagic acid derivatives (r2= 0.9908), as well as with flavonols (r2= 0.915).The antioxidant activities found for the hydromethanolic extract in the DDPH scavenging, reducing power andb-carotene
assays were higher than those observed for the extracts of wild grown vegetative parts ofF. vescaL., despite the latter contained higher concentrations of phenolic compounds (138 mg/g) (Dias, Barros, Fernandes, et al., 2015). This could be due to the different phenolic profiles existing in both types of samples, but also to the presence of other components in the extracts, such as sugars, organic acids or tocopherols, which occur in higher levels in the in vitro-cultured sample, and may also have an influence on the antioxidant potential.
Table 3
Retention time (Rt), wavelengths of maximum absorption (kmax), mass spectral data, tentative identification and quantification of phenolic compounds in hydromethanolic
extracts, infusions and decoctions of thein vitrocultured vegetative parts of wildFragaria vescaL.
Peak Rt (min)
kmax
(nm)
[M-H]
-(m/z)
MS2(m/z) Tentative identification Extracts Infusions Decoctions
Phenolic compounds (mg/g dw)
1 4.7 258 783 481(3),301(30) Bis-HHDP-hexosideB 0.027 ± 0.001a 0.027 ± 0.001c 0.028 ± 0.003b
2 5.6 278 451 289(100) (Epi)catechin hexosideA 0.060 ± 0.001b 0.081 ± 0.004c 0.173 ± 0.001a
3 6.05 256 783 481(25),301(14) Bis-HHDP-hexosideB 0.006 ± 0.002c 0.015 ± 0.03b 0.033 ± 0.002a
4 6.87 278 577 451(33), 425(65), 407(100), 289(75), 287(17)
Procyanidin dimerA 0.09 ± 0.01a 0.071 ± 0.002b 0.07 ± 0.01b
5 7.19 356 639 463(69),301(59) Quercetin glucuronyl-hexosideE 0.001 ± 0.0001c 0.003 ± 0.001b 0.004 ± 0.001a
6 7.76 278 289 245(35), 203(32), 137(32) (+)-CatechinA 0.051 ± 0.002c 0.102 ± 0.001b 0.117 ± 0.004a
7 8.35 272 – 425(65), 407(), 289(100) Gallocatechin-related flavan-3-olA 0.039 ± 0.001a 0.033 ± 0.001c 0.051 ± 0.001b
8 9.63 332 355 193(18),175(100),161(20) Ferulic acid hexosideC 0.006 ± 0.001a 0.005 ± 0.001c 0.006 ± 0.001b
9 14.5 270 935 633(25),301(21) Galloyl-bis-HHDP-glucose isomerB 0.031 ± 0.001 nd nd
10 15 372 463 301(100) Ellagic acid hexosideB 0.006 ± 0.001a 0.007 ± 0.001b 0.005 ± 0.001c
11 15.45 316 337 191(7),173(35),163(10),155 (5)
Coumaroylquinic acid isomerF 0.008 ± 0.001a 0.010 ± 0.001b 0.010 ± 0.001b
12 15.7 316 337 191(8),173(38),163(12),155 (6)
Coumaroylquinic acid isomerF 0.003 ± 0.001b 0.009 ± 0.002a 0.005 ± 0.001b
13 16.61 352 623 301(100) Quercetin rhamnosyl-glucuronideE 0.003 ± 0.001b 0.004 ± 0.001b 0.005 ± 0.001a
14 16.75 320 367 193(100),191(16),173 (14),149(25)
Feruloylquinic acidC 0.003 ± 0.001c 0.008 ± 0.001b 0.007 ± 0.001a
15 17.07 372 433 301(100) Ellagic acid pentosideB 0.004 ± 0.001 tr nd
16 17.59 368 477 315(35),301(100) Isorhamnetin-O-glucosideD 0.016 ± 0.001a 0.021 ± 0.001b 0.017 ± 0.001c
17 17.93 262 1567 935(95), 783(5),631(2),613 (13), 301(6)
Sanguiinh10 isomerB 0.146 ± 0.002 nd nd
18 19.29 250/sh370 447 301(100) Ellagic acid rhamnosideB 0.004 ± 0.001b 0.011 ± 0.001a 0.006 ± 0.001b
19 19.3 346 607 285(100) Kaempferol rhamnosyl-glucuronideH 0.01 ± 0.001b 0.015 ± 0.001b 0.019 ± 0.001a
20 19.87 356 477 301(100) Quercetin glucuronideE 0.007 ± 0.001a 0.010 ± 0.001c 0.010 ± 0.001b
21 20.04 354 637 315(95),300(26) Methylquercetin rhamnosyl glucuronideE 0.003 ± 0.001c 0.005 ± 0.001b 0.006 ± 0.001a
22 20.18 292/sh338 435 303(100) Taxifolin-pentosideG 0.039 ± 0.001a 0.048 ± 0.002b 0.035 ± 0.004c
23 20.56 356 463 301(100) Quercetin 3-O-glucosideE 0.003 ± 0.001 nd nd
24 21.11 254/sh370 301 284(4),256(3),229(4), 185(4) Ellagic acidB 0.012 ± 0.001b 0.037 ± 0.001a tr
25 23.35 378 447 315(28),300(100) Methyl ellagic acid pentosideB tr tr 0.034 ± 0.002
26 23.9 348 461 285(100) Kaempferol-glucuronideH 0.004 ± 0.001a 0.006 ± 0.001b 0.006 ± 0.001a
27 24.21 348 447 285(100) Kaempferol-hexosideH 0.002 ± 0.001a 0.002 ± 0.001c 0.002 ± 0.001b
28 24.83 364 447 315(12),300(100) Methyl ellagic acid pentosideB tr tr tr
29 25.26 248/sh372 461 315(89),301(38) Dimethyl ellagic acid pentosideB 0.024 ± 0.001a 0.021 ± 0.001b 0.011 ± 0.001c
30 26.98 368 461 315(37),301(100) Dymethyl ellagic acid pentosideB tr tr tr
Total phenolic acids 0.019 ± 0.001b 0.032 ± 0.001a 0.027 ± 0.001c
Total ellagic acid derivatives 0.26 ± 0.01a 0.119 ± 0.001b 0.118 ± 0.001b
Total flavan 3-ols 0.089 ± 0.001a 0.113 ± 0.002b 0.104 ± 0.006c
Total flavonols 0.235 ± 0.003b 0.287 ± 0.002c 0.409 ± 0.003a
Total phenolic compounds 0.6 ± 0.01a 0.551 ± 0.003c 0.658 ± 0.001b
Different letters mean significant statistical differences between samples (p<0.05), where ‘‘a” and ‘‘c” correspond to the highest and lowest values, respectively. tr-traces; nd- not detected. Standard calibration curves: (A) catechin (y= 158.42x+ 11.38,R2= 0.999); (B) ellagic acid (y= 32.748x+ 77.8,R2=0.9994); (C) ferulic acid (y= 525.36x+
233.82,R2= 0.9994); (D) isorhametin-3-O-glucoside (y= 218.26x 0.98,R2= 1); (E) quercetin-3-O-glucoside (y= 253.52x 11.615,R2= 0.9984); (F)p-coumaric acid
Overall, the plant tissue culture technique applied toFragaria vescaL. proved to be a suitable approach to obtain higher contents of proteins, polyunsaturated fatty acids, soluble sugars, organic
acids (including ascorbic acid) and tocopherols (mainly
a
-tocopherol). Furthermore, the hydromethanolic extracts of the in vitro-grown samples showed greater antioxidant activity thanthe ones obtained from wild-grownF. vesca. In contrast, although the phenolic profile was similar to that observed in wild-grown plants, lower levels of total phenolic compounds were accumu-lated in thein vitro-cultured samples. Further studies are required to check if this limitation might be overcome by elicitation of plant growth.
Acknowledgements
The authors are grateful to Fundação para a Ciência e a Tecnologia (FCT, Portugal) for financial support to CIMO (strategic project UID/AGR/00690/2013) and to REQUIMTE (national funds and co-financed by FEDER, under the Partnership Agreement PT2020) and to POCI-01-0145-FEDER-006984 (LA LSRE-LCM) funded by ERDF through POCI-COMPETE2020 and FCT. L. Barros and M.I. Dias thank FCT for their grants (SFRH/BPD/107855/2015 and SFRH/BD/84485/2012, respectively). The GIP-USAL is financially supported by the Spanish Government through the pro-ject AGL2015-64522-C2-2-R.
References
Anand, S. (2010). Various approaches for secondary metabolite production through plant tissue culture.Pharmacia.
AOAC (2005). Official methods of analysis of AOAC international. In G. L. W. Horwitz (Ed.) (18th ed. (18th ed.). Gaithersburg: AOAC International.
Barros, L., Heleno, S. A., Carvalho, A. M., & Ferreira, I. C. F. R. (2009). Systematic evaluation of the antioxidant potential of different parts of Foeniculum vulgare Mill. from Portugal.Food and Chemical Toxicology, 47, 2458–2464.
Barros, L., Pereira, E., Calhelha, R. C., Dueñas, M., Carvalho, A. M., Santos-Buelga, C., & Ferreira, I. C. F. R. (2013). Bioactivity and chemical characterization in hydrophilic and lipophilic compounds ofChenopodium ambrosioidesL.Journal of Functional Foods, 5(4), 1732–1740. http://dx.doi.org/10.1016/j. jff.2013.07.019.
Camejo-Rodrigues, J., Ascensão, L., Bonet, M. À., & Vallès, J. (2003). An ethnobotanical study of medicinal and aromatic plants in the Natural Park of ‘‘Serra de São Mamede” (Portugal).Journal of Ethnopharmacology, 89(2–3), 199–209.http://dx.doi.org/10.1016/S0378-8741(03)00270-8.
Castroviejo, S., Aedo, C., Cirujano, S., Laínz, M., Montserrat, P., Morales, R., ... Soriano, C. (1998). Flora Ibérica 6. In Real Jardín Botánico (Ed.). Madrid: CSIC. Del Bubba, M., Checchini, L., Chiuminatto, U., Doumett, S., Fibbi, D., & Giordani, E.
(2012). Liquid chromatographic/electrospray ionization tandem mass spectrometric study of polyphenolic composition of four cultivars ofFragaria vescaL. berries and their comparative evaluation.Journal of Mass Spectrometry, 47(9), 1207–1220.http://dx.doi.org/10.1002/jms.3030.
Dias, M. I., Barros, L., Fernandes, I. P., Ruphuy, G., Oliveira, M. B. P., Santos-Buelga, C., ... Ferreira, I. C. F. R. (2015). A bioactive formulation based on Fragaria vesca L. vegetative parts: Chemical characterisation and application inj-carrageenan gelatin.Journal of Functional Foods, 16, 243–255.http://dx.doi.org/10.1016/j. jff.2015.04.044.
Dias, M. I., Barros, L., Morales, P., Cámara, M., Alves, M.-J., Oliveira, M. B. P., ... Ferreira, I. C. F. R. (2016). Wild Fragaria vesca L. fruits: a rich source of bioactive phytochemicals. Food & Function, 4523–4532. http://dx.doi.org/10.1039/ c6fo01042c.
Dias, M. I., Barros, L., Morales, P., Sánchez-Mata, M. C., Oliveira, M. B. P. P., & Ferreira, I. C. F. (2015). Nutritional parameters of infusions and decoctions obtained from
Fragaria vescaL. roots and vegetative parts.LWT - Food Science and Technology, 62(1), 32–38.http://dx.doi.org/10.1016/j.lwt.2015.01.034.
Dias, M. I., Barros, L., Oliveira, M. B. P. P., Santos-Buelga, C., & Ferreira, I. C. F. R. (2015). Phenolic profile and antioxidant properties of commercial and wild
Fragaria vescaL. roots: A comparison between hydromethanolic and aqueous extracts.Industrial Crops and Products, 63, 125–132.http://dx.doi.org/10.1016/j. indcrop.2014.10.021.
Dias, M., Sousa, M., Alves, R., & Ferreira, I. F. R. (2016). Exploring plant tissue culture to improve the production of phenolic compounds: A review.Industrial Crops and Products, 82, 9–22.http://dx.doi.org/10.1016/j.indcrop.2015.12.016. Doumett, S., Fibbi, D., Cincinelli, A., Giordani, E., Nin, S., & Del, M. (2011).
Comparison of nutritional and nutraceutical properties in cultivated fruits of Fragaria vesca L. produced in Italy.FRIN, 44(5), 1209–1216.http://dx.doi.org/ 10.1016/j.foodres.2010.10.044.
Gasperotti, M., Masuero, D., Guella, G., Palmieri, L., Martinatti, P., Pojer, E., ... Vrhovsek, U. (2013). Evolution of ellagitannin content and profile during fruit ripening in Fragariaspp.Journal of Agricultural and Food Chemistry, 61(36), 8597–8607.http://dx.doi.org/10.1021/jf402706h.
Godfray, H., Beddington, J., Crute, I., Haddad, L., Lawrence, D., Muir, J., ... Toulmin, C. (2012). Food security the challenge of feeding 9 billion people.Science, 327, 812. http://dx.doi.org/10.4337/9780857939388.
Guimarães, R., Barros, L., Dueñas, M., Carvalho, A. M., Queiroz, M. J. R. P., Santos-Buelga, C., & Ferreira, I. C. F. R. (2013). Characterisation of phenolic compounds in wild fruits from Northeastern Portugal.Food Chemistry, 141(4), 3721–3730. http://dx.doi.org/10.1016/j.foodchem.2013.06.071.
Karuppusamy, S. (2009). A review on trends in production of secondary metabolites from higher plants by in vitro tissue, organ and cell cultures.Journal of Medicinal Plants Research, 3(13), 1222–1239.http://dx.doi.org/10.1117/12.644514. Murashige, T., & Skoog, F. (1962). A revised medium for rapid growth and bioassays
with tobacco tissue cultures.Physiologia Plantarum, 15, 473–497.
Ornelas-Paz, J., Yahia, E. M., Ramírez-Bustamante, N., Pérez-Martínez, J. D., Escalante-Minakata, M., Ibarra-Junquera, V., ... Ochoa-Reyes, E. (2013). Physical attributes and chemical composition of organic strawberry fruit (Fragaria x ananassa Duch, Cv. Albion) at six stages of ripening. Food Chemistry, 138(1), 372–381.http://dx.doi.org/10.1016/j.foodchem.2012.11.006. Özüdoru, B., Akaydin, G., Erik, S., & Yesilada, E. (2011). Inferences from an ethnobotanical field expedition in the selected locations of Sivas and Yozgat provinces (Turkey).Journal of Ethnopharmacology, 137(1), 85–98.http://dx.doi. org/10.1016/j.jep.2011.04.050.
Patil, V., & Gislerød, H. R. (2006). The importance of omega-3 fatty acids in diet.
Current Science, 90(7), 908–909.
Pawlaczyk, I., Czerchawski, L., Pilecki, W., Lamer-Zarawska, E., & Gancarz, R. (2009). Polyphenolic-polysaccharide compounds from selected medicinal plants of Asteraceae and Rosaceae families: Chemical characterization and blood anticoagulant activity. Carbohydrate Polymers, 77(3), 568–575.http://dx.doi. org/10.1016/j.carbpol.2009.01.030.
Regulation (EC) No 1169/2011 (2011). Regulation (EC) No 1169/2011 of the European Parliament and of the Council, of 25 October 2011, on the provision of food information to consumers.Official Journal of the European Union, 1169, 18–63.
Savo, V., Giulia, C., Maria, G. P., & David, R. (2011). Folk phytotherapy of the Amalfi Coast (Campania, Southern Italy). Journal of Ethnopharmacology, 135(2), 376–392.http://dx.doi.org/10.1016/j.jep.2011.03.027.
Simirgiotis, M. J., & Schmeda-Hirschmann, G. (2010). Determination of phenolic composition and antioxidant activity in fruits, rhizomes and leaves of the white strawberry (Fragaria chiloensisspp. chiloensis form chiloensis) using HPLC-DAD-ESI-MS and free radical quenching techniques.Journal of Food Composition and Analysis, 23(6), 545–553.http://dx.doi.org/10.1016/j.jfca.2009.08.020. Sun, J., Liu, X., Yang, T., Slovin, J., & Chen, P. (2014). Profiling polyphenols of two
diploid strawberry (Fragaria vesca) inbred lines using UHPLC-HRMS n.Food Chemistry, 146, 289–298.http://dx.doi.org/10.1016/j.foodchem.2013.08.089. Yaseen, M., Ahmad, T., Sablok, G., Standardi, A., & Hafiz, I. A. (2013). Review: Role of
carbon sources forin vitroplant growth and development.Molecular Biology Reports.http://dx.doi.org/10.1007/s11033-012-2299-z.
Yildirim, A. B., & Turker, A. U. (2014). Effects of regeneration enhancers on micropropagation of <i>Fragaria vesca<i/> L. and phenolic content comparison of field-grown and <i>in vitro<i/>-grown plant materials by liquid chromatography-electrospray tandem mass spectrometry (LC-ESI-MS/MS).
Scientia Horticulturae, 169, 169–178. http://dx.doi.org/10.1016/ j.scienta.2014.01.038.
Table 4
Antioxidant activity of the hydromethanolic extracts, infusions and decoctions of
in vitrocultured vegetative parts of wildFragaria vescaL.
EC50values (lg/mL) Hydromethanolic Infusion Decoction
DPPH scavenging activity 82.5 ± 3.1b 86.9 ± 0.9ab 93.6 ± 10.1a
Reducing power 57.0 ± 0.1c 75.9 ± 0.4a 62.0 ± 0.3b b-carotene bleaching
inhibition
54.4 ± 1.9a 52.4 ± 1.0b 54.2 ± 0.1a
TBARS inhibition 230.3 ± 16.1a 25.3 ± 0.8b 27.1 ± 1.6b
EC50values correspond to the sample concentration achieving 50% of antioxidant
activity or 0.5 of absorbance in reducing power assay. Trolox EC50 values: