ABSTRACT:Sugar snap pea (Pisum sativum L. var. macrocarpon Ser.) is an edible-podded sweet pea that is being considered as a new totally mechanized crop to supply raw material to the agri-food industry of the Ebro Valley (Northern Spain). It is of great interest from an agronomic and commercial standpoint but neither its agronomic behaviour nor its adaptation to the area are known. The objective of this study was to determine the effect of sowing date and seed density on the growth and yield of the sugar snap pea at industrial scale. Six randomized blocks experiments with four replicates were conducted on irrigated land in Villafranca (Navarra, Spain) in 1998, 1999, and 2000. Three experiments for testing sowing dates (Mar., Apr., and May) and another three for seed densities (from 75 to 150 plants m–2) were performed. Phenological
development, thermal integral and qualitative and quantitative yield controls were performed. Sugar snap pea required 960 ºC d–1 (T
b = 3 ºC) from sowing to harvest. The early sowings gave
more biomass, but yield was similar. However, Harvest Index and crop morphology varied. The sowing densities had similar yields sowing that sugar snap pea has a bigger adaptation availabil-ity. Sugar snap peas can be satisfactorily cultivated at industrial scale in the zone with sowings between Mar. and May and with seeding densities between 75 and 150 plants m–2.
Keywords: Pisum sativum, edible pod, heat sums,industrial agriculture, new crops
Introduction
The Ebro Valley is an agricultural irrigated area specialized in growing vegetables for industrial canning and freezing. The diversification of crop rotations with new short-cycle legumes is of great interest from an agronomic and commercial viewpoint. New short-cycle legume crops increase biodiversity, reduce the period
in which soil is uncovered and, in addition, symbiot-
symbiot-ic fixation of atmosphersymbiot-ic nitrogen (N) by these crops makes these leguminous crops have high N levels, whose plant residues improve soil conditions. Besides this, new crops lead to an increase in diversification of the supply of new marketable agri-food products. New crops for this area should be totally mechanized, and be supplied to the processing industry during an annual season that is as long as possible.
The sugar snap pea (Pisum sativum L. var.
mac-rocarpon Ser.) is considered suitable for cultivation in this area and fulfils all the above-mentioned require-ments. The sugar snap pea is a legume whose tender pods are used for human consumption. These edible pods are a highly regarded vegetable because of their sweet flavour and their dietetic fibre content (Myers et al., 2001). The main production centres of this crop have traditionally been the United States, Guatemala, and Zimbabwe.
Although seed peas have traditionally been grown in the Ebro Valley, sugar snap peas have never been culti-vated in this part of the Mediterranean. Therefore, man-aging this new crop is uncertain and knowledge about its agronomic response is required. Clarification of the ef-fect of sowing date and seeding density on the yield and quality is especially needed. There is no published
infor-mation on the effect of these factors on the snap pea, but similar studies have been conducted on peas (Johnston et al., 2002; Kumar et al., 2009; Baird et al., 2009; Spies et al., 2010) and other leguminous crops (Adisarwanto and Knight, 1997; Ratan and Biswas, 2010).
Edible-pod peas prefer consistently cool grow-ing conditions rather than hotter areas (Slinkard et al., 1994). For the emergence, vegetative, and reproductive
stages, the base (Tb), optimum (Tm), and maximum
tem-peratures (Tx), are 3, 28, and 38 °C respectively (Olivier
and Annandale, 1998). In the Ebro Valley, flowering and pod set might sometimes be interrupted by frost even in May. On the other hand, temperatures can reach 38 ºC during this month, which is high enough to have a negative effect on yield. Knowledge of the consequenc-es of delayed sowing for yield and frost risk can be used to define optimum sowing dates.
Seed density affects parameters of seed peas, such as yield, weed control, and pod distribution. Therefore seed density that produces the highest yield depends on growing conditions (Heath et al., 1991; Adisarwanto and Knight, 1997; Uzun and Açikgöz, 1998; Tawaha and Turk, 2004; Pageau et al., 2007; Baird et al., 2009). The sugar snap crop is harvested in the green pod phase with a degree of maturity that must be set based on crop morphological characteristics. Given that the har-vest is mechanical, it is very important that pod mat-uration in the various areas where the crop is grown should be as homogenous as possible in order to ensure both pod yield and quality.
The effect of sowing date and seeding density on the yield and quality of sugar snap peas for the proc-ess vegetable industry in Ebro Valley were evaluated in this study.
Received August 22, 2011 Accepted March 08, 2012
1Universidad Pública de Navarra – Depto. de Producción
Agraria, Campus de Arrosadia – 31006 – Pamplona, Navarra – España.
2Universidad Pública de Navarra – Depto. de Ciencias del
Medio Natural.
3Universidad Pública de Navarra/Instituto de
Agrobiotecnología/CSIC – Gobierno de Navarra, Campus de Arrosadia E – 31192 – Mutilva Baja, Navarra – España. *Corresponding author <[email protected]>
Edited by: Daniel Scherer de Moura
Yield and quality of sugar snap pea in the Ebro Valley: Sowing date and seed density
Materials and Methods
Experimental design
In 1998, 1999, and 2000 six randomized field trials with four replicated were conducted on irrigated fields in the district of Villafranca de Navarra in Spain (42º16´ N, 1º45´ W, 291 m a.s.l.). Sugar snap pea cultivar “Sugar Boys” (Novartis Seeds S.A.) was sown. The experimental
treatment unit was 1.000 m2. Each year, two trials were
performed: one for testing different sowing dates and an-other for testing seeding densities. Sowing times tested were: early (first fortnight in Mar.), mid-season (first fort-night in Apr.), and late (first fortfort-night in May). The
seed-ing densities tested were 75, 105, and 125 seeds m–2 in
1998 and 1999, and 105, 125, and 150 seeds m–2 in 2000.
The climate in Villafranca is classified as
temper-ate Mediterranean with oats, (Avena sativa L.) in winter
and corn (Zea mays L.) in summer, and its stream flow
regimen is dry Mediterranean at 380 L m–2 (Elias and
Ruiz, 1986). Weather parameters (temperature and rain-fall) were measured using an automatic meteorological station located 2 km from the experiment site. The soil
was a Calcixerolic Xerocrepts. The soil for the tests is
sandy loam, which is deep and alkaline (pH 8.3 to 8.5), with a high calcium carbonate content (30.6 - 49.5 %) and a moderate organic matter content (1.50 - 1.95 %). The total N content by plot and year fluctuated between
0.06 and 0.13 %, that of P between 4.4 and 12.2 mg kg–1
and of K between 85 and 208 mg kg–1.
In all the experiments, the previous crop was corn. Primary tillage was with a mouldboard plough, followed by a harrow plough, and a cultivator. Sowing was with a pneumatic precision cereal drill. Sprinkler irrigation was applied twice a week and the dose was determined according to the ETc calculated from the date of the weather station following FAO-56 methodology. At the phenological stage of 8 nodes, 125 kg of N were applied. Phytosanitary treatments were not necessary. All man-agement was performed on a large scale with the ma-chinery typically used by farmers in the area.
Determinations
In every experimental unit, a representative area
of 1 m2 was identified in which ten plants were
perma-nently and randomly marked in each treatment. These plants were used to for the weekly changes of pheno-logical stages in the crop using the BBCH coding of pea phenological stages (Feller et al., 1995). From the weather data recorded by the weather station, the ther-mal integral (TI) was calculated as follows according to
Olivier and Annandale (1998): TI = ∑(Tdm-Tb) , in which
the minimal biological temperature (Tb = 3 ºC) of the
crop is subtracted from the average daily temperature
(Tdm). Once the time for harvest of each treatment
ar-rived, all plants within 1 m2 were hand harvested and
the following measurements were made: plant density, fresh weight of the shoot, fresh weight of pods (total and by node), number of pods (total and by node), pod
length, and L N–1 ratio of the pods by nodes. The L N–1
ratio is obtained by dividing the magnitude L (L is the long cross-sectional axis of the pod) by its magnitude N (N is the narrow cross-sectional axis of the pod) (Figure 1), and it defines the commercial maturity of a pod. It is
considered to be optimal when the L N–1 ratio fluctuates
between 1.2 and 1.3 (Matamoros et al., 2010).
Carbohydrates contents in commercial maturity pods were determined on 12 pods hand harvested from
the first three nodes of each elementary plot. The extrac-
extrac-tion to determine the carbohydrates content in pods and grains involved boiling 0.5 g of crushed fresh material four times in 80 % ethanol for 30 s and then washing with cold ethanol a further three times, the supernatant and insoluble solid residue were kept. The supernatant was collected, and the solvents evaporated to dryness on a Turbo-Vap LV Evaporator. The resulting pellet was re-suspended in 10 mL of distilled water and the carbohy-drates total content measured as described Spiro (1966), and glucose, fructose and sucrose content was measured as described Gordon et al. (1987). The starch content of pod was determined in the insoluble solid residue from the extraction as described by MacRae (1971).
Data from each trial were subjected to one-way variance analysis (ANOVA), and when differences were
significant (α=95 %) the Student-Newman-Keuls (SNK)
test was applied. The SPSS v. 17.0 statistical software was used for this purpose.
Results
The temperature and rainfall conditions for the three years were typical for this time of year in the re-gion, although 2000 was slightly rainier and colder (Fig-ure 2). All treatments were successfully carried out and crop cycles were completed satisfactorily with the excep-tion of the 1998 late sowing in which a breakdown in the irrigation system caused a water shortage that hindered collection of results for this treatment.
Sowing date
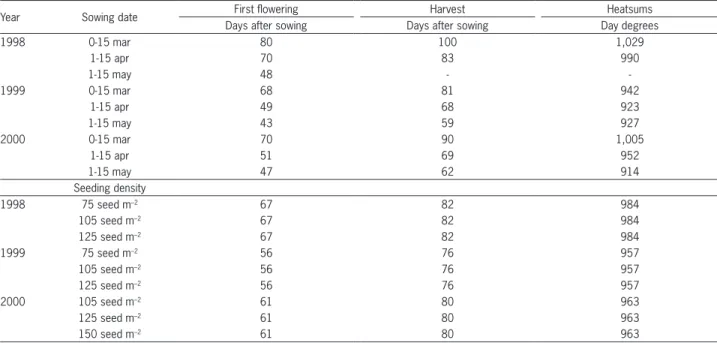
The crop cycle was three months for the earliest sowings and two months for the May sowings,
accumu-lating 960 ºC d–1 (T
b = 3 ºC) (SD = 42) from sowing to
commercial maturity (Table 1).
Figure 2 – Maximum, average and minimum aerial temperature and rainfall during 1998, 1999 and 2000.
Table 1 – Snap pea development (days to first flowering and to harvest) and heatsums requirements depending on sowing date and seeding density in 1998, 1999 and 2000.
Year Sowing date First flowering Harvest Heatsums
Days after sowing Days after sowing Day degrees
1998 0-15 mar 80 100 1,029
1-15 apr 70 83 990
1-15 may 48 -
-1999 0-15 mar 68 81 942
1-15 apr 49 68 923
1-15 may 43 59 927
2000 0-15 mar 70 90 1,005
1-15 apr 51 69 952
1-15 may 47 62 914
Seeding density
1998 75 seed m–2 67 82 984
105 seed m–2 67 82 984
125 seed m–2 67 82 984
1999 75 seed m–2 56 76 957
105 seed m–2 56 76 957
125 seed m–2 56 76 957
2000 105 seed m–2 61 80 963
125 seed m–2 61 80 963
150 seed m–2 61 80 963
In 1999 and 2000, the biomass produced by the early sowings was 53 and 33 % more than in the late sowings (Table 2). However, differences in yield were much lower. The plant density was similar for all the treatments except in 2000 when it increased in the late sowings. Yield was high with a downward trend for the later sowings. These sowings produced slightly fewer and shorter pods. Early sowings increased the number
of pods m–2 at harvest. The Harvest Index (HI) for late
sowings was higher. Eighty percent of the yield was dis-tributed over the first five nodes in the early sowings but only over three nodes in late sowings (Figure3). The
L N–1 ratio was higher in upper nodes and the effect of
sowing date on this parameter was unclear.
Seeding density
In the seeding density test, all plants flowered and attained commercial maturity simultaneously. The
cumu-lative thermal integral for the treatments was 968 ºC d–1
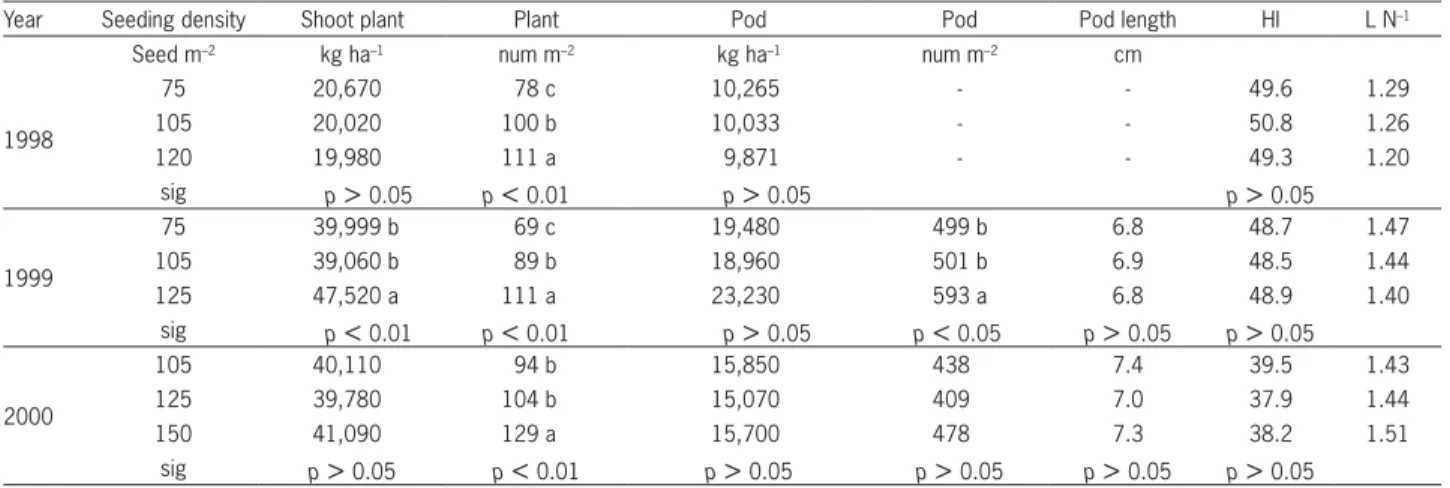
(Tb = 3 ºC) (SD = 14). Biomass production was similar at
all densities except in 1999 when biomass was increased at the highest seeding density (Table 3). The number of plants
m–2 also increased with seeding density but had virtually
Table 2 – Snap pea yield parameters, shoot fresh weight and plant number, pod weight, pod number and pod length, fresh Harvest Index (HI) and L N–1 ratio depending on sowing date in 1998, 1999 and 2000.
Year Sowing date Shoot plant Plant Pod Pod Pod length HI L N–1
kg ha–1 num m–2 kg ha–1 num m–2 Cm
1998
0-15 mar 35,290 65 14,190 - - 40.2 1.52
1-15 apr 43,370 74 18,860 - - 43.5 1.42
1-15 may - - -
-sig p
> 0.05
p> 0.05
p> 0.05
p> 0.05
1999
0-15 mar 33,710 a 87 13,140 479 a 6.0 39.0 1.32
1-15 apr 34,630 a 85 12,830 504 a 6.4 37.0 1.52
1-15 may 22,270 b 83 9,930 335 b 6.1 44.6 1.28
sig p
< 0.01
p> 0.05
p> 0.05
p< 0.01
p> 0.05
p> 0.05
2000
0-15 mar 40,990 a 91 b 14,790 483 a 7.1 a 36.1 b 1.46
1-15 apr 33,300 b 84 c 12,000 398 b 6.5 b 36.0 b 1.44
1-15 may 30,420 b 102 a 13,910 425 b 6.1 b 45.7 a 1.30
sig p
< 0.01
p< 0.01
p> 0.05
p< 0.01
p< 0.01
p< 0.01
Figure 3 – Contribution of each node yield to total yield and L N–1 ratio per node of snap peas sowed in different dates during 1998, 1999 and 2000.
Table 3 – Snap pea yield parameters, shoot fresh weight and plant number, pod weight, pod number and pod length, fresh Harvest Index (HI) and L N–1 ratio depending seeding density in 1998, 1999 and 2000.
Year Seeding density Shoot plant Plant Pod Pod Pod length HI L N–1
Seed m–2 kg ha–1 num m–2 kg ha–1 num m–2 cm
1998
75 20,670 78 c 10,265 - - 49.6 1.29
105 20,020 100 b 10,033 - - 50.8 1.26
120 19,980 111 a 9,871 - - 49.3 1.20
sig p
> 0.05
p< 0.01
p> 0.05
p> 0.05
1999
75 39,999 b 69 c 19,480 499 b 6.8 48.7 1.47
105 39,060 b 89 b 18,960 501 b 6.9 48.5 1.44
125 47,520 a 111 a 23,230 593 a 6.8 48.9 1.40
sig p
< 0.01
p< 0.01
p> 0.05
p< 0.05
p> 0.05
p> 0.05
2000
105 40,110 94 b 15,850 438 7.4 39.5 1.43
125 39,780 104 b 15,070 409 7.0 37.9 1.44
150 41,090 129 a 15,700 478 7.3 38.2 1.51
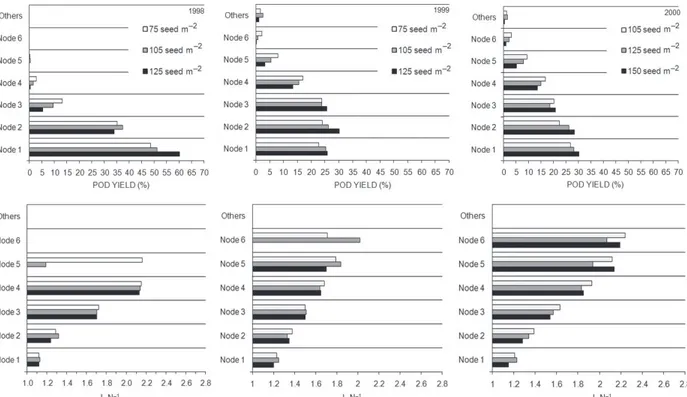
m–2 was significant in 1999 but was less clear in 2000. The
length of pods, the HI or the L N–1 ratio was not affected by
the tested seeding densities. In 1998, the number of nodes was fewer than in 1999 and 2000 (Figure 4). When seed-ing density was increased, yield tended to be slightly more concentrated at the lower nodes. The effect of seeding
den-sity on the L N–1 ratio for each node was reduced.
There were no differences in carbohydrate con-tents between treatments. In grains total carbohydrates
content was 79 mg g–1 of fresh weight, starch content
13.4 mg g–1 and sucrose 59 mg g–1. Glucose and
fruc-tose content in grain were very low 0.6 and 0.9 mg g–1
respectively. Nevertheless in pods (without grain) total carbohydrate and starch content were similar to those
measured in grain, 60 and 18 mg g–1 respectively while
glucose and fructose content were higher, 24 and 2 mg
g–1 respectively, and sucrose smaller 25 mg g–1.
Discussion
The yield obtained in the sowing date tests clearly indicates that the climate of the Ebro Valley is suitable for the cultivation of the sugar snap pea sown between Mar. and May. From sowing to commercial maturity, it
accumulates 962 ºC d–1 (SD = 36 ºC d–1) regardless of
the year of cultivation, sowing date, or seeding density. Olivier and Annandale (1998) found that different variet-ies of seed peas accumulated between 770 and 890 ºC
d–1 from sowing to flowering and from sowing to
matu-rity (tenderometer reading of 130) from 1,370 °C d–1 to
1,450 °C d–1. Sugar boys snap pea has a short cycle and
it is green harvested.
Figure 4 – Contribution of each node to total yield and L N–1 ratio per node of snap peas sowed at different densities during 1998, 1999 and 2000.
Variations in the sowing date changed the dura-tion of the number of days from sowing to flowering. However, the duration of the flowering to harvesting phase varied less. In contrast, Adisarwanto and Knight (1997) studied the effect of the sowing date on the
growth cycle of faba bean (Vicia faba L.) and found that
the duration in days of the vegetative phase hardly var-ied, although the pod development period was affected. Seeding densities tested did not affect the phenologi-cal development of the crop. In the absence of stress, crop phenological development has traditionally been defined by temperature and photoperiod conditions that are independent of seeding density but are clearly affected by the sowing date and the latitude (Roche et al., 1999). The high repetitiveness of the sugar snap pea thermal integral calculations indicate that it could be used as a tool for planning sowing dates and being able to predict harvest dates and the availability of raw ma-terial for the processing industry.
radiation, because of thus the accumulated biomass was greater. The yield differences were less than in biomass production given that the plants modify their morphol-ogy, concentrating yield on fewer nodes, which caused an increase in the HI. Other studies conducted with peas concluded that in general early sowing increases yield. Tawaha and Turk (2004) attributed these differences to larger temperatures faced by later sown crops in Jordan area. Sowing early other leguminous crops like chick pea were less affected by diseases like dry root rot and wilt (Ratan and Biswas, 2010). Uzun and Açikgöz (1998) also found greater yield of autumn sown seed peas than from spring sowings.
The possible advantage of early sowings is vari-able with the weather and was less particularly in cold years (e.g. 2000). Low minimum temperatures in Mar. and Apr. of 2000, with seven days of frost, may have been the reason for the reduction in the number of harvestable plants. Further, plants that survived modi-fied their morphology, and produced pods over fewer nodes, and distributed yield more uniformly on the dif-ferent plant nodes (Figure 3). Late sowings gave fewer
pods m–2 but their average weight was 10 % higher.
Pods from the higher nodes of the early sowings were between 16 and 31 % longer than those from the later sowings (data not shown).
With regard to seeding densities, a priori a greater
seeding density can be assumed to have a productive advantage in facilitating greater radiation interception and allowing earlier access to high Leaf Area Index (LAI) values. However, a disadvantage may also be the increased competition among plants for resources (wa-ter, nutrients, light). In this experiment, competition for water and nutrients among plants was reduced by the use of fertilizer and irrigation. The effect of seeding densities on yield was minimal. Sugar snap, like the
seed peas mg g–1, has considerable capacity to adapt,
with the ability to reach yield levels that are near-opti-mal with planting densities as wide-ranging as 75 and
150 plants m–2 (Gan et al., 2003; Tawaha and Turk 2004;
Pageau et al., 2007). However, the effect was not the same every year. In 1999, for instance, a year with good weather for growth, when the seeding density was in-creased there was a trend towards inin-creased yield up to 19 % (sig = 0.059). Heath et al. (1991) found that near maximum yields were maintained between 70 -
140 plants m–2 due to the ability of the seed pea crop
to make compensatory increases in the number of pods per plant as sowing density declined. Spies et al. (2010) found the optimum economic plant density for the seed
pea cultivars was 50 to 84 plants m–2.
Different pea cultivars may respond differently. Field seed pea cultivars, with high basal branching, achieved their maximum yield at lower seed densities. In these experiments, sugar snap pea showed significant basal branching ability. Johnston et al. (2002) also found yield component compensation at different seeding rates. They concluded that the yield of field seed peas
grown under relatively weed-free conditions should
be optimized with a seeding rate of 50 to 75 seed m–2.
Townley-Smith and Wright (1994) concluded that seed-ing density should be increased when there was poor weed control. Thus, Baird et al. (2009) recommended a
120 plant m–2 density for organic pea yield in Canada in
order to achieve a better weed control. Under cool
cli-mate conditions seeding rates higher than 100 grains m–2
increase grain pea lodging (Pageau, 2007). However this is not a problem with snap pea because it is harvested in a younger phonological stage. According to pod and grain sugar content, sucrose is the main responsible of the sweetness of sugar snap pea.
Sugar snap peas, like seed pea, have a considerable capacity to modify their morphology to optimize growth at a wide range of seeding densities. However, the sow-ing density that gives maximum yield may vary from year to year because of the year to year weather varia-tions and the incidence of other biotic factors such as the presence of more or fewer weeds.
Seed purchase comprises more than 50 % of the
crop cost. Sowing at 150 seeds m–2 instead of 75 seeds
m–2 doubles the seed costs. Therefore, when deciding on
the seeding density to be used, an economic evaluation is necessary to determine if the increase in crop cost is com-pensated by the uncertain and reduced yield increase.
Conclusions
It appears possible to cultivate snap pea in the Ebro Valley with seeding between Mar. and May at
seeding densities 75 to 150 plants m–2 with a required
thermal accumulation of 962 ºC d–1. Yield levels are
similar in all cases. With late sowing, yield is concen-trated at lower nodes, the number of pods decreases, and there is an increased of the Harvest Index. How-ever, when seeding density is increased, crop costs in-crease, yield is concentrated at lower nodes, the num-ber of pods decreases and, in some cases, yield and
the number of pods m–2 may increase slightly.
Acknowledgments
To INDUSTRIAL GELAGRI SLU and MCYT (AGF97-0458), for providing funding for the trials.
References
Adisarwanto, T.; Knight, R. 1997. Effect of sowing date and plant density on yield and yield components in the faba bean. Australian Journal of Agricultural Research 48: 1161– 1168.
Baird, J.M.; Walley, F.L.; Shirtliffe, S.J. 2009. Optimal seeding rate for organic production of field pea in northern Great Plains. Canadian Journal of Plant Science 89: 455–464. Elias, F.; Ruiz, L. 1986. Agroclimatic Characterization of
Feller, C.; Bleiholder, H.; Buhr, L.; Hack, H.; Hess, M.; Klose, R.; Meier, U.; Stauss, R.; Boom, T.; Weber, E. 1995. Phenological growth stages of vegetable crops. II. Fruit vegetables and pulses. Coding and description according to the extended BBCH scale with illustrations. Nachrichtenblatt des Deutschen Pflanzenschutzdienstes 47: 217–232. Gan, Y.T.; Miller, R.R.; McConkey, B.G.; Zentner, R.R.; Liu,
P.H.; McDonald, C.L. 2003. Optimum plant population density for chickpea and dry pea in a semiarid environment. Canadian Journal of Plant Science 83: 1–9.
Gordon, A.J.; Mitchell, D.F.; Ryle, G.J.A.; Powell, C.E. 1987. Diurnal production and utilization of photosynthate in nodulated white clover. Journal of Experimental Botany 38: 84–98.
Heath, M.C.; Knott, C.M.; Dyer, C.J.; Rogers-Lewis, D. 1991. Optimum plant densities for three semi-leafless combining pea (Pisum sativum) cultivars under contrasting field conditions. Annals of Applied Biology 118: 671–688. Johnston, A.M.; Clayton, G.W.; Lafond, G.P.; Harker, K.N.;
Hogg T. J.; Johnson, E.N.; May, W.E.; McConnell, J.T. 2002. Field pea seeding management. Canadian Journal of Plant Science 82: 639–644.
Kumar, L.; Kumar, S.; Rathi, A.S. 2009. Effect of different sowing time on pod yield of early cultivars of garden pea
(Pisum Sativum L.) var. Hortense. Green Farming 13: 915–
916.
MacRae, J.C. 1971. Quantitative measurement of starch in very small amounts of leaf tissue. Planta 96: 101–108.
Matamoros, M.A.; Loscos, J.; Dietz, K.J.; Aparicio-Tejo, P.M.; Becana, M. 2010. Function of antioxidant enzymes and metabolites during maturation of pea fruits. Journal of Experimental Botany 61: 87–97.
Myers, J.R.; Baggett, J.R.; Lamborn, C. 2001. Origin, history, and genetic improvement of the snap pea (Pisum sativum L.). Plant Breeding Review 21: 93–128.
Olivier, F.C.; Annandale, J.G. 1998. Thermal time requirements for the development of green pea (Pisum sativum L.). Field Crops Research 56: 301–307.
Pageau, D.; Lajeunesse, J.; Lafond, J. 2007. Effect of seeding rate on productivity of dry pea under cool climate. Canadian Journal of Plant Science 87: 41–48.
Ratan, V.; Biswas, S.K. 2010. Influence of date of sowing on incidence of dry root rot and wilt diseases of chick pea. Annals of Plant Protection Sciences 18: 258–259.
Roche, R.; Jeuffroy, M.H.; Ney, B. 1999. Comparison of different models predicting the date of beginning of flowering in pea
(Pisum sativum L.) Ecological Modelling 118: 213–226.
Slinkard, A.E.; Bascur, G.; Hernandez-Bravo, G. 1994. Biotic and abiotic stresses of cool season food legumes in the western hemisphere. p. 195–203. In: Muehlbauer, F.J.; Kaiser, W.J., eds. Expanding the production and use of cool season food legumes. Kluwer Academic, Dordrecht, The Netherlands. Spies, J.M.; Warkentin, T.; Shirtliffe, S. 2010. Basal branching in
field pea cultivars and yield-density relationship. Canadian Journal of Plant Science 90: 679–690.
Spiro, R.G. 1966. Analysis of sugars found in glycoproteins. p. 3–36. In: Neufeld, E.F.; Ginsburg, V., eds. Methods in enzymology. Academic Press, New York, NY, USA. v.8. Tawaha, A.M.; Turk, M.A. 2004. Field pea seeding management
for semi-arid mediterranean conditions. Journal of Agronomy and Crop Science 190: 86–92.
Townley-Smith, L.; Wright, A.T. 1994. Field pea cultivar and weed response to crop seed rate in western Canada. Canadian Journal of Plant Science 74: 387–393.