THE IMPACT OF AGEING ON SAVINGS: A PANEL
DATA STUDY AMONG THE OECD COUNTRIES
Mariana Miguel dos Reis Ferreira
Dissertation submitted as partial requirement for the conferral of Master of Sciences in Business Administration
Supervisor:
PhD, Sofia de Sousa Vale, Assistant Professor Economics Department
I would like to express an enormous gratitude to my supervisor Professor Sofia de Sousa Vale, for all the time, dedication and guidance and mostly for the knowledge and motivation shared, that allowed me to complete this project.
Abstract
Ageing has been pointed out as the most prominent demographic trend of the 21st century and is expected to impact economies at a micro and macro scale. One of the main consequences of this global phenomenon is the change in savings behaviour, which has been resulting in a decrease on the rate of savings. This thesis aims to study the impact of ageing on the gross savings rate through a panel data of 28 OECD countries observed between 1990 and 2013. The main ageing determinant considered in this study is the old age dependency ratio but some control variables as life expectancy, health expenditure and social expenditure with elderly, education level, unemployment and interest rate are also included. Non-stationarity and co-integration properties between gross savings and its drivers are studied and the long-run relationship is estimated using the Group Means Panel-Dynamic Ordinary Least Squares (PDOLS) framework. The findings suggest that ageing has a negative impact on savings, mainly through the negative influence of old age dependency ratio, health expenditure and social expenditure with elderly on the gross savings rate.
Key words: ageing, savings, life-cycle model, panel data JEL: C23, J14
Resumo
O envelhecimento da população tem sido indicado como a tendência demográfica mais relevante do século XXI, sendo expectável que os seus efeitos afetem de forma determinante a economia aos níveis micro e macro. A alteração no comportamento-padrão de aforro individual é uma das consequências deste fenómeno global, que tem vindo a resultar numa diminuição da taxa de poupança. Este estudo tem como objetivo a análise do impacto do envelhecimento populacional na taxa de poupança bruta, com recurso a um painel de 28 países da OCDE, durante o período de 1990 a 2013. Para medir o envelhecimento foi usado neste estudo o índice de dependência de idosos, como variável nuclear. A esperança média de vida, despesa pública com saúde, despesa pública com idosos, bem como, o nível de escolaridade, taxa de desemprego e taxa de juro, foram também incluídas na qualidade de variáveis de controlo.Nesta análise foram realizados testes à não-estacionariedade e cointegração das variáveis e o modelo foi estimado através do método de Group Means Panel-Dynamic Ordinary Least Squares (PDOLS). Os resultados obtidos apontam para um impacto negativo do envelhecimento na poupança, explicado maioritariamente pela influência negativa do índice de dependência de idosos, despesa pública com saúde e despesa pública com idosos.
Palavras-chave: envelhecimento, poupança, ciclo de vida, painel de dados. JEL: C23, J14
i Table of Contents
Sumário Executivo ... v
1. Introduction ... 1
2. Theoretical Framework: Savings and Ageing ... 3
2.1. Origin of Savings ... 3
2.2. The importance of savings – savings and economic growth ... 4
2.3. The life-cycle model ... 6
2.4. The relation between savings and ageing – an overview on the literature ... 8
3. Conceptual Framework and Statistical Data ... 12
3.1. Ageing ... 12
3.1.1. Ageing – a global phenomenon ... 12
3.1.2. The economic effects of population ageing ... 19
3.2. Savings ... 23
3.2.1. World distribution of savings ... 23
3.2.2. Savings decreasing tendency ... 24
3.3. Ageing vs. Savings – statistical overview ... 25
4. Empirical Analysis of the Model ... 29
4.1. The Model ... 29
4.2. Variables Definition ... 29
4.2.1. Old age dependency ratio ... 30
4.2.2. Life Expectancy ... 30
4.2.3. Health Expenditure ... 31
4.2.4. Social Expenditure with Old Age Population ... 32
4.2.5. Education Level ... 32
4.2.6. Unemployment ... 33
ii
4.3. Data Statistical Analysis ... 34
4.4. Empirical Analysis ... 36
4.4.1. Panel Unit Root Tests ... 36
4.4.2. Panel Co-integration ... 37
4.4.3. Estimators ... 39
4.4.4. Results ... 40
5. Concluding Remarks ... 46
References ... 48
iii List of Abbreviations
OCDE Organização para a Cooperação e Desenvolvimento Económico PDOLS Panel-Dynamic Ordinary Least Squares
LCM Life-Cycle Model
OECD Organization for Economic Cooperation and Development R&D Research and Development
GDP Gross Domestic Product PAYG Pay-As-You-Go
PPP Purchasing Power Parity OADR Old Age Dependency Ratio GER Gross Enrolment Ratio IPS Im Pesaran and Shin ADF Augmented Dickey Fuller CD Cross-sectional Dependence
List of tables
Table 1: Fertility rate ... 14
Table 2: Life expectancy in years at birth ... 16
Table 3: Old age dependency ratio ... 18
Table 4: Youth age dependency ratio ... 19
Table 5: Evolution of the gross rate of savings ... 25
Table 6: Variables’ definition and sources ... 29
Table 7: Variables’ descriptive statistics ... 34
Table 8: Panel unit root test ... 37
Table 9: Panel unit root test in first differences... 37
Table 10: Panel co-integration analysis ... 38
Table 11: Cross-sectional dependence ... 39
Table 12: Group-Means PDOLS estimation ... 40
iv List of figures
Figure 1: Old Age Dependency Ratio ... 13
Figure 2: Fertility rate ... 14
Figure 3: Life expectancy in years at birth ... 15
Figure 4: Average percentage of elderly people ... 17
Figure 5: Percentage of elderly people ... 17
Figure 6: Comparison between Old (>65) and Youth (<15) dependency ratios (15-64) in the OECD Countries ... 18
Figure 7: Gross Rate of Savings in percentage of GDP in the main regions of the World ... 24
Figure 8: Comparison between the gross rate of savings in percentage of GDP in the OECD member countries and World average ... 25
v Sumário Executivo
Este estudo tem por objetivo medir o impacto que o envelhecimento da população tem na taxa de poupança, através de um painel de dados que contempla 28 países da OCDE observados durante o período de 1990 a 2013. Foram aplicados métodos econométricos, pretendendo-se concluir sobre o presumível efeito que o aumento do envelhecimento da população tem na diminuição da poupança registada ao longo das últimas décadas. Numa primeira fase de revisão da literatura observa-se que, dada a complexidade do tema, a dualidade de resultados não permite uma conclusão única e pragmática.
Por um lado, o modelo do ciclo de vida – uma das mais conceituadas ferramentas nesta matéria – prevê que o envelhecimento da população tenda a contribuir para um decréscimo aforrista, antevendo que a população idosa usará as poupanças acumuladas durante a idade ativa, no período da aposentação, para que possa compensar o decréscimo no rendimento e manter o mesmo padrão de consumo. Esta conclusão está assente no pressuposto de que poupar equivale a consumo futuro e, portanto, os indivíduos poupam com o intuito de manter constante o seu padrão de consumo ao longo do ciclo de vida. Por outro lado, as motivações para poupar podem não estar limitadas à necessidade de padronizar o consumo, como assume o modelo do ciclo de vida. A intenção de deixar uma herança ou a prevenção contra incidentes futuros constituem outras razões para poupar. Para além disso, o modelo do ciclo de vida não contempla o eventual efeito de fatores externos que podem influenciar as decisões de consumo e o rendimento disponível durante o período da aposentação, como a existência de um serviço nacional de saúde e as dinâmicas características de cada regime de reforma e segurança social. É razoável assumir que, perante uma expetativa de descida nas comparticipações de saúde e benefícios de reforma, a motivação de um indivíduo em idade ativa para poupar, aumente, com vista a prevenir eventuais necessidades durante a aposentação.
O estudo empírico centra-se em 28 economias da OCDE analisadas no período de 1990 a 2013, onde as dinâmicas de envelhecimento e de poupança têm vindo a tornar-se objeto de análise e discussão devido à crescente preocupação com as consequências que o aumento do envelhecimento populacional terá na estrutura demográfica da sociedade, na economia dos países e consequentemente na sustentabilidade dos sistemas públicos. O estudo efetuado contempla a realização de testes à não-estacionariedade e cointegração das variáveis e à estimação do modelo através do método de Group Means Panel-Dynamic Ordinary Least Squares (PDOLS). Para medir o envelhecimento foi incluído no
vi
estudo, como variável nuclear, o índice de dependência de idosos; a esperança média de vida, despesa pública com saúde, despesa pública com idosos, nível de escolaridade, taxa de desemprego e taxa de juro foram também incluídas na qualidade de variáveis de controlo. Numa primeira fase, foi analisado o painel de dados como um todo e, posteriormente, país-a-país, no sentido de saber que países se revelam determinantes no modelo.
Através do estudo realizado foi possível concluir que o envelhecimento da população está a influenciar negativamente a taxa de poupança, o que demonstra que o decréscimo verificado nos aforros é, em parte, explicado pelo crescente envelhecimento populacional. Importa referir que esta relação não é igual em todos os países, sendo válida para alguns deles individualmente e para o conjunto no painel analisado.
Igualmente importante é o facto de esta conclusão ser limitada e não passível de generalizações, considerando a multiplicidade de variáveis que podem ser usadas para medir o envelhecimento. Assim, assumem prevalência neste estudo o índice de dependência de idosos, esperança média de vida, despesa pública com saúde e despesa pública com idosos, nível de escolaridade e taxa de desemprego, como variáveis estatisticamente significantes para explicar o modelo.
A análise econométrica realizada permite-nos concluir que parte do decréscimo da taxa de poupança registado nas últimas décadas pode ser explicado pelo aumento do envelhecimento populacional. Desta forma, os resultados são coincidentes com alguma da literatura apresentada, nomeadamente o modelo de ciclo de vida, evidenciando a relação negativa entre os conceitos em estudo. Assim, concluímos que quando medido através do índice de dependência de idosos, o aumento do envelhecimento populacional tende a contribuir para um decréscimo na taxa de poupança.
1 1. Introduction
Over the past decades, the world has seen a decrease in fertility rate and an increase in life expectancy that, among other reasons, led to an increase in population ageing, turning it into the most prominent demographic trend of the 21st century. The increase in the percentage of elderly has been changing the age structure of the population and consequently impacting the economies at a micro and macro scales. One of the effects of ageing phenomena that has been widely investigated is the impact that it will have in households’ consumption pattern that will ultimately affect their savings behaviour. In fact, over the past decades a decrease in savings started to be registered which is raising concern among governments due to the extreme importance that they have as a mean for resources’ accumulation and further economic growth.
Life-cycle model, the most known framework to study consumption, predicts a smooth in the consumption pattern during an individual’s lifetime. Accordingly, savings as merely future consumption, will allow an individual to have the same consumption level in their whole life regardless the income received in a particular moment. If this assumption applies, ageing would contribute to decrease savings because as retirees tend to have lower incomes during retirements (compared to working life), they will compensate the decrease in income by using their savings to keep the same consumption pattern.
However, this theory does not account for other external factors that impact in consumption decisions and disposable income during retirement, namely the existence of public health care, dynamics of pension scheme and welfare systems. For instance if one anticipate a decrease in public health care and retirement benefits, the motivation to save may increase, leading younger people to save more to prevent hard times during retirement – causing an increase in savings. On the other hand, with increased longevity and by working longer, people may feel they need to save less once their retirement period is shortened. Also, as LCM is based on the assumption that people save solely to smooth consumption during lifetime, other reasons to save, (e.g.: bequests, precautionary reasons) are immediately excluded, even though they may be valid for some people. For instance, the intention of leaving a bequest may lead older people to increase their savings pattern which would mean an increase in savings as a consequence of population ageing. This study aims to provide an answer for this problem, determining about the impact that ageing is having on savings. We perform an econometric analysis through a panel of 28
2
OECD countries between 1990 and 2013. The main ageing determinant considered in this study is the old age dependency ratio but some control variables as life expectancy, health expenditure, social expenditure with elderly, education level, unemployment and interest rate are also included to account for societies’ economic and social development which might as well influence the concepts under analysis. Initially the analysis is performed for the panel as a whole and afterwards to each country individually to better track down which countries are driving the model.
To sum up, our findings led to one major conclusion: ageing is impacting negatively the gross savings rate, showing that there is a close relation between the decreasing trend in savings and the permanent increase in ageing. This relation is different across countries, even though it applies for some of them and for the panel as a whole. Also worth mention, is the fact that ageing is quite subjective to measure thus this conclusion is valid only when applying these variables to control for ageing, namely old age dependency ratio as the main variable to measure ageing.
This research adds value to the existent literature providing that there is not much work done on this matter that follows a PDOLS methodology. Also, by analysing a considerable number of countries that belong to the OECD we are introducing countries in different development states that follow different types of economic and public policies that allow us to benefit from a heterogeneous sample and consequently avoiding bias results. Finally, the combination of variables used enabled us to analyse the ageing topic in a more broad way, not being limited to the OADR or life expectancy, giving this analysis unique characteristics.
Our study is organized as follows. Section two covers the related literature in savings and ageing theories. In section three we present a more conceptual framework and some statistical data. Section four is the analysis of the empirical model and finally section five sums up the work done with some concluding remarks.
3 2. Theoretical Framework: Savings and Ageing
2.1. Origin of Savings
Savings have been a matter of concern over decades among the economic community due to the importance that it has both at a micro level, in a family’s future living conditions, and at a macro level, in the sustainability of a country. Indeed, for households, savings will determine their ability to fight against recessions, deal with unexpected life events and establish at least part of their income during retirement. For a country, although the perspective is different a parallelism can be found given that savings will work as a warranty for long-term economic stability and prosperity. The motivation and importance of savings differ between private and public even though they are definitely linked. Modigliani & Brumberg (1954), Ando & Modigliani (1963), Carroll & Summers (1991), Carroll (1996) and Deaton (1991) are some of the main contributors to the research in savings’ field. They took part in the development, improvement and modification of the life cycle model which was designed to explain consumption decisions and to study households’ savings behaviours along their lifetime, based on microeconomic principles. Personal savings refer to households’ choice of delaying present consumption to the future. In this sense, by saving, individuals are dividing their permanent income between their current needs and possible future ones, i.e., they are allowing themselves the option to satisfy consumption needs later on. This is one of the three main motivations to save and is the basis of the life cycle model. More specifically, the motivation to save comes from the intention to smooth consumption along the lifetime to avoid major fluctuations in consumption levels during the lifecycle that would eventually lead to a decrease in the utility level (Modigliani & Brumberg, 1954; Ando & Modigliani, 1963; Gersovitz, 1988a). The second one is precautionary saving that is related with the intention of having a reserve against bad outcomes derived from uncertainties (Carroll & Summers, 1991; Carroll, 1996). Finally, the investment motivation that occurs when individuals are motivated to save by rates of return that they may receive. Another reason is also starting to be pointed out and consists on one’s desire to leave a bequest. Accordingly, besides maximizing their own utility, individuals will try to maximize their descendants’ utility. In this sense, their savings intend to fulfil a multigenerational mission, and not only the smooth of their own consumption patterns.
The sum of savings of all individuals and households correspond to the national level of personal savings (Gersovitz, 1988). As mentioned above, the motivations for having
4
personal savings differ according to specific demographic characteristics of the population, such as age or level of lifetime resources, ending up in different levels of private savings, thus influencing national savings. Nonetheless, personal savings are just a source of national savings which are also composed by government and corporate sector ones. However, the theory of the paradox of thrift introduced by John Maynard Keynes states that individual saving behavior is harmful for the economy at a macro scale. Accordingly, by saving instead of spending, households are contributing to decrease businesses earnings and consequently increasing unemployment which would eventually cause a decrease in total savings. This theory is quite controversial since it questions all the previous ones and is criticized based on the assumption that if personal savings increased, banks would have higher money availability to lend which allows companies to invest and develop their businesses.
The first step in this research was to know where the reserves come from and what the population’s motivations to save are. Having done this, it matters to assess to which extent do savings really matter and what are its implications to the economic growth.
2.2. The importance of savings – savings and economic growth
As a mean for resources’ accumulation, savings play a crucial role in economies, once they provide the availability of capital to invest. According to the Solow Growth Model (Solow, 1956) the rate of saving can be seen as the fraction of output allocated to investment, given that from the income received, people consume part and save the rest. Consequently if investment increases, economic growth will also increase since investment opportunities are greater in a growing environment. Indeed, in the long run, the rate of saving determines the capital stock and consequently the production level, meaning that a higher saving rate leads to increase in capital stock which contributes to an increased amount of output, i.e., increased economic growth. However, this increase in economic growth is only temporary until the economy reach the new steady-state1 level of output, providing that the increase in savings has a level effect on income per person (Solow, 1956). Concluding, the Solow model stands that there is in fact a positive link between the two variables but solely savings will not generate continuous growth in the long run.
1 The steady state represents the long-run equilibrium of the economy. It is an important concept because
“an economy at the steady state will stay there. (…) an economy not at the steady state will go there”(Mankiw, 2013:210).
5
Despite being very different from the Solow model, also the Keynesian model proposed by Harrod (1939) and Domar (1946) finds evidence that savings and economic growth have a positive relation, in which savings positively influence economic growth through investment.In fact, in the Harrod-Domar model, capital formation and savings are the drivers of economic growth. In addition to the previous researchers, the Nobel Economist Arthur Lewis (1954) reached the same conclusion. Deaton (1997) made a deep study in this matter by comparing and analysing the different approaches and pointing out that there is empirical evidence that shows “a significant positive and robust relationship across countries between saving rates and growth” (Deaton, 1997:2). The question is to know if it is saving causing growth or growth causing saving, or both simultaneously – which he stresses as the most likely hypothesis.
On the other hand,several long-run growth theories – endogenous growth models – namely AK theory (Romer, 1986) establish a different relation between savings and economic growth compared to the previous Solow Growth Model. According to this perspective, the long run growth of an economy depends on its saving rate, given that savings and investment lead to permanent instead of temporary growth. The reasoning behind this comes from the assumption that the accumulation of capital can be translated in intellectual capital that promotes technological progress which does not diminish returns to capital, as in the Solow Model. Therefore, it is implicit that a country can grow faster by investing more, in human or physical capital or in R&D (Aghion et al., 2009). In this sense, savings should be a matter of national concern considering that a low savings rate would mean less disposable resources to invest in and lower economic development, including fewer jobs.
The relation between savings and GDP has been largely investigated and discussed in the literature and many researchers concluded that, as a source of capital stock, savings eventually boost economic growth. However, following Aghion et al. (2009) the above theory applies only in developed countries considering that in underdeveloped countries growth requires the participation of a foreign investor who brings the technological inputs needed and a local that understands how the domestic environment works. Thus, domestic saving loses importance in the growth process when compared to developed countries because of the vital need for a foreign investor. Nevertheless, it matters to highlight that many research done on savings in developing countries came to the conclusion that the alignment of high income rates with high savings rates proofs the existence of virtuous
6
cycles of poverty traps and insufficient savings (Loayza, Schmidt-Hebbel, & Servén, 2000) that prevents investment autonomy and demands the need for foreign investment as mentioned above.
Despite the different theories and the different levels of importance attributed to savings in the development of a country, considering that economic growth is attainable through investment stimulation and that national savings are one of the sources of funds that allows for investment, it becomes commonly accepted that the increase of savings is of great importance. Governments should influence households’ saving rate through policies that encourage savings, namely through saving-related tax incentives, as a mean for individual long-term stability, in this way it would become easier to keep savings rate constant (Oxford Economics, 2014). However, as mentioned before there are other factors, namely demographic, that affect the propensity to save. Given the changes in the demographic structure of the population, more specifically in society’s age distribution, it is relevant to study the implications of these variations in savings.
2.3. The life-cycle model
The relation between savings, consumption, investment and ageing was studied over the 50’s and 60’s by several economists and later on, along with other researchers it was worth the Nobel Prize to Franco Modigliani. Together with Brumberg, Modigliani developed the life-cycle model – that was later a matter of research for other economists (Modigliani & Brumberg, 1954; Ando & Modigliani, 1963; Friedman, 1957) – that became the most common framework used as basis for empirical investigations in this field.
The main concept behind the Life Cycle Model is the permanent-income hypothesis. Accordingly, people divide their resources, i.e., income, in equal parts among their lifetime, which implies that consumption in a certain moment is not determined by income in that period, but by income over one’s entire life (Romer, 2012). Consequently saving and borrowing are merely tools to balance the consumption path among lifetime. This first proposition of permanent-income hypothesis (Modigliani & Brumberg, 1954; Friedman, 1957) has led to the definition of savings as future consumption. In fact, unless the individual saves for the sake of saving, i.e., valuing saving itself, the reasoning for saving is to consume in the future. So, the division of income in immediate consumption and future consumption (savings) can be understood as the possibility of having the same
7
life standards in each period of life by having always the same amount of money fully available to consume.
In a simplified way, and as referred by El Mekkaoui de Freitas & Oliveira Martins (2014), there are two periods in life: the first one where people work and earn their wage and the second one in which they retire. Applying the life-cycle model, people would save part of their wage during the first period of life to accumulate resources for future expenditures and to provide themselves the same consumption level during retirement. In this sense, according to (Modigliani, 1986) it is legitimate to expect savings to be positive for households in their working period and negative for the ones in retirement age. Still, when one take a look at a country’s statistics easily concludes that it is not always true, i.e., retirement period is not by rule a period of dissaving. Poterba (1994) developed a research in which he concluded precisely that: the premises in which LCM is based do not apply totally since there are high values for savings in older ages in some countries. However “uncertainty, precautionary saving and accidental bequests may affect the age after which one should start observing wealth decumulation” (Jappelli & Modigliani, 1998:141). Thus, high savings rate at old age may be perhaps justified in some models in which savings are treated according to specific circumstances such as the need to leave a large bequest or irrational behaviours of consumers that did not prepare conveniently their funds for retirement period and consequently need to save right in the moment.
Other issues that go against LCM have come to discussion even though there is much empirical evidence supporting the model. For instance, the theory that consumption tends to decrease in old age is incompatible with the idea that consumption is equal in every stage of one’s life. If this verifies there would be no need to sacrifice current consumption for the benefit of future expenditure. Following Aguiar & Hurst (2013), the disaggregation of consumption data allows to better understand the behaviour of the composite consumption good. Indeed, the average consumption of goods that belong to the categories of clothing, food and transportation falls sharply after middle age whereas the consumption of other types of goods does not only not fall but even increases. This decrease may be explained by the nature of this work-related products that are replaced by household home production, e.g.: food/meals starts to be home-produced. Also savings rate in old age may be influenced by several risks that households face late in life. For instance medical expenses shocks, even though long term care services may be often provided within families, the consumption of health-related goods/services is usually
8
higher in postretirement age. Indeed, expenditures of long-term care are mainly determined by age (El Mekkaoui de Freitas & Oliveira Martins, 2014). In this sense it becomes crucial to consider that in different periods of life the basket of goods consumed is different, namely during active life and then during retirement, which implies a careful analysis of the increase/decrease in consumption rates.
2.4. The relation between savings and ageing – an overview on the literature
How is population ageing likely to affect national saving rates, levels of retirement wealth and income, and retirement security? This is the question most commonly raised concerning the impacts of ageing on savings. Despite having been a matter of research for many scholars, no unique conclusion has been yet found providing the specificities of each model and the counterarguments found, as mentioned above. Indeed it seems that there are more motives for saving other than capital accumulation to use in retirement period and there are other context factors affecting savings rate. The effects that ageing population will have on savings rate are influenced by several other external factors that should be included in the discussion, such as the country’s pension scheme, its health care system, and welfare contributions. By reviewing the studies made throughout the last decades in this matter it is possible to conclude that there are still contradictory results about the effects of population’s ageing on savings rate.
a. Influence of Longevity on Savings
On the one hand, Life-Cycle Theory (Modigliani & Brumberg, 1954) assumes that with the increase in longevity, savings will increase at first, as people will save more during the working period of their lives considering that the retirement period will be longer, thus they will need more assets. Later on, when the percentage of older people is substantially higher than the active population, savings will decrease since that the biggest part of population will belong to the group of spenders. In this sense according to the literature on LCM, savings will be lower in a population characterized by a large percentage of old people (and higher in the opposite case).
On the other hand, some authors rather support the thesis of a positive impact of the increase in life span in savings rate. Recently, using an overlapping generations model, Li, Zhang, & Zhang (2007) reached the conclusion that an increase in longevity has a positive effect on savings at household and aggregate levels, confirming the theory that by expecting to live longer, individuals will save more, namely middle-aged ones. Applying the study of old age dependency ratio in China, Li, Li, & Chan (2012) found
9
that population ageing had a positive impact on savings for the period of 1985 to 2005. Also, Prettner (2012) defends that older people tend to save more which means that increase longevity, increases the time spans in which people save, increasing savings.
b. Influence of Pension scheme on Savings
Considered by many as too simple, in the sense that it does not include, for instance, the impact of social security namely through pension plans, updates were made to the LCM. Feldstein (1974) introduced Pay-As-You-Go pension systems into the model and concluded about a negative link between this variable and savings. In fact, this study led to the conclusion that the existence of a social security system depresses savings in the sense that it works as a substitute for households assets. Bloom, Canning, Mansfield, & Moore (2007) concluded that in the presence of high replacement rates or PAYG systems, a longer life span does not increase savings. Similarly, El Mekkaoui de Freitas & Oliveira Martins (2014) have derived an aggregate household saving equation combined with other savings’ determinants and concluded that higher pension’s replacement rate discourage households to save. In the presence of unfunded state pensions, Blake (2001) states that there will be a decrease in aggregate savings if the state pension savings are inframarginal (i.e., below the individuals’ optimal savings level). This reduction will happen because government will raise taxes to pay for pension, reducing private savings. However, Feldstein (1974) has also discussed theoretically the positive effect of social security on savings that comes from the incentive to early retirement (due to the existence of a pension scheme) that will lengthen the retirement period in which one will use the accumulated assets. Also, Li et al. (2012) in their study about China, mentioned earlier found that the inefficiency of social security system (including the PAYG pension system) is driving an increase in savings once that people do not fully trust the system and prefer to be cautious about their retirement by saving on their own. This findings may lead to conclude that if people do not rely on their pension system, despite its existence, they will save more to be prevented.
Besides the positive and negative effects mentioned above, there is even a third effect worth mention. According to Blake (2001) if the assumptions of the LCM apply, the existence of private pensions plans/contributions have no impact on saving and consumption behaviour given that the decision of saving is based on the present value of lifetime income.
10 c. Influence of Health Care system on Savings
As population ages it is expected that many people start to use their stock of retirement assets to pay for living expenses, such as health care and retirement care. Indeed, as mentioned above, at an old age the consumption of health care products/services tends to increase which means a change in the market needs, especially in a society where the old population is growing compared to the rest of the population. The percentage of one’s savings that will be used to pay for health care during retirement period will depend on the country’s health care system. In their study mentioned above, El Mekkaoui de Freitas & Oliveira Martins (2014) have also concluded that health systems have to be considered among the main determinants of aggregate savings and the systems in which there is a high public provision of health care contributes negatively to household savings.
Main conclusions
Despite the amount of studies developed towards this matter it is difficult to come up with a direct and pragmatic conclusion. In fact, the life cycle theory that is the main theory of consumption and saving has been subject to several objections that question its viability. The constraints related to the three topics mentioned above – increased longevity, pensions’ schemes and health care systems – aligned with the uncertainty of the economic environment shuffles the predicted patterns of savings. A study from the National Research Council of the United States in 2012 refers that the active labour force “may save at a higher rate than past generations if they anticipate reductions in public health and retirement benefits and increased longevity. On the other hand, they might save less if they plan on working longer, thus needing a relatively smaller nest egg in retirement” (National Research Council, 2012:128). Indeed Lee & Mason (2007) found out that whenever the ratio of dependent people increases by contrast with a decrease in active population percentage, family’s income tend to decrease consequently contributing to a decrease in savings.
Having all of this in consideration, the model developed in this study attempts to control for all of these issues through its explanatory variables to assess in what extent the existence or not of more contribution welfare systems and the level of health care system influence savings; the ageing structure of population and its evolution throughout the years to measure the longevity impact; and some other variables that reflect the country’s
11
economic development (unemployment and school education level) to control for the economic instability and if it influences or not saving patterns.
12 3. Conceptual Framework and Statistical Data
3.1. Ageing
The world is now perceiving a phenomenon never recorded before in history: soon there will be more elderly than children and more people with an older age than ever before. The term ageing has no universal meaning and can be interpreted differently from country to country. United Nations consider older people the ones aged over 60 years while OECD has a slightly different approach considering old the people aged 65 years or more. Being the most prominent demographic trend of the 21st century, according to Weil (2006), population ageing is the shift in the distribution of a country’s population toward older ages. To assess the demographic factors behind population ageing it is currently used the concept of stable populations (Gavrilov & Heuveline, 2003). In this model fertility and mortality rates remain constant over time, leading to a population with a stable age distribution. Therefore, any change in the age structure can be explained by a fall in fertility rates and a decline in mortality at older ages. The decline in fertility has been pointed out as the dominant contributor to population ageing (Weil, 1997) as a consequence of the rise in the average age of the population due to an unbalance between the amount of old and young people. Increase in longevity contribute to change populations’ age distribution since it raises the number of years a person is considered old compared to the number of years a person is considered young. Consequently, population ageing can be seen as the result of a demographic transition from a society with high rates of fertility and mortality to another one with both lower rates.
3.1.1. Ageing – a global phenomenon
Ageing is a dynamic process that is taking place almost everywhere but it varies in speed and extent, for example, in developed countries population has been ageing for many decades, while in developing countries this is a more recent phenomenon, consequence of a decrease in its mortality and fertility rates. Figure 1 shows the ratio of older population over the working age population in the man regions of the World, from 1960 to 2014. Over this time there has been an increase in all the regions even though there is a considerably high difference in the range of values between North America and Europe & Central Asia and the rest of the world, most likely justified by the differences in development.
13 Figure 1: Old Age Dependency Ratio (% of old people over the working age population) in the main regions of the World between 1960 and 2014. Source: World Bank Database and authors’ calculation
Indeed, the increase in life expectancy and the decrease in fertility rates have been pointed out as the main reasons behind ageing populations.
According to the United Nations World Population Ageing Report (United Nations, 2013), fertility rates have been decreasing in the majority of the world over the past decades. The world’s total fertility rate has dropped from 5,0 children per woman in 1950-1955 to 2,5 children per woman in 2010-2015. Projections for 2045-2050 point to a rate of 2,2 children per woman in the best case scenario, and 1.8 children per woman in the worst case scenario. Even though the difference in fertility rates between developed and less developed countries was really considerable in the past, it is now becoming residual, with projections for 2045-2050 of 1,9 children per woman in developed regions and 2,3 in under development regions. The situation figures worse for most developed countries given the fact that the rate will be below the generational replacement level of 2,1 children per woman.
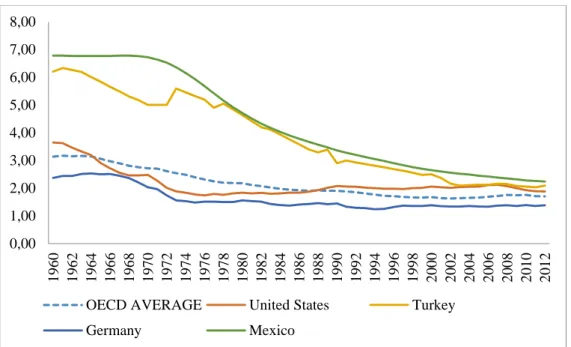
In the OECD the average number of children per woman was 3,14 in 1960 and has decreased to 1,7 in 2012, which represents a variation of 85%. Figure 2 illustrates the variation of fertility rate from 1960 to 2012 in the OECD Area (average values) and in some representative countries. It is clearly observable the decreasing in every country. In 1960, Mexico and Turkey had really high fertility rates (6,78 and 6,20 respectively, as illustrated in table 1), considerably above OECD’s average, but now the gap is narrowing
0 5 10 15 20 25 1960 2014
East Asia & Pacific (all income levels) Europe & Central Asia (all income levels) Latin America & Caribbean (all income levels) North America
14
and even these countries are beginning to reach the average. On the other hand, Germany has always been below OECD’s average, having a really low fertility rate – 1,62 children per woman on average from 1960 to 2012 – which makes it the country with lowest fertility rate in OECD, contrary to Mexico. The United States have shown a contrary evolution, being above OECD’s average until 1990 where there is a turning point with an increase in the country’s fertility rate.
Figure 2: Fertility rate – as the number of children per woman – from 1960 to 2012 according to OECD Health Statistics Database and authors’ calculation.
1960 1970 1980 1990 2000 2010 OECD Average 3,14 2,72 2,17 1,91 1,68 1,75 United States 3,65 2,48 1,84 2,08 2,06 1,93 Turkey 6,20 5,00 4,63 2,90 2,50 2,06 Germany 2,37 2,03 1,56 1,45 1,38 1,39 Mexico 6,78 6,72 4,71 3,36 2,65 2,28
Table 1: Fertility rate – as the number of children per woman – from 1960 to 2010 according to OECD Health Statistics Database and authors’ calculation.
Increases in life expectancy have been registered in all major regions of the world. It is one of the biggest achievements of humanity and results, among other factors, from a decrease in child mortality and health conditions’ improvements, contributing to a higher number of individuals surviving to ever older ages. In 1950, life expectancy in most developed countries was 65 years compared to 42 years in less developed regions. The
0,00 1,00 2,00 3,00 4,00 5,00 6,00 7,00 8,00 1 9 6 0 1 9 6 2 1 9 6 4 1 9 6 6 1 9 6 8 1 9 7 0 1 9 7 2 1 9 7 4 1 9 7 6 1 9 7 8 1 9 8 0 1 9 8 2 1 9 8 4 1 9 8 6 1 9 8 8 1 9 9 0 1 9 9 2 1 9 9 4 1 9 9 6 1 9 9 8 2 0 0 0 2 0 0 2 2 0 0 4 2 0 0 6 2 0 0 8 2 0 1 0 2 0 1 2
OECD AVERAGE United States Turkey
15
difference between regions with different development levels is also decreasing, considering an estimation of 83 years to developed regions and 75 years to under development regions by 2045-2050 (United Nations, 2013).
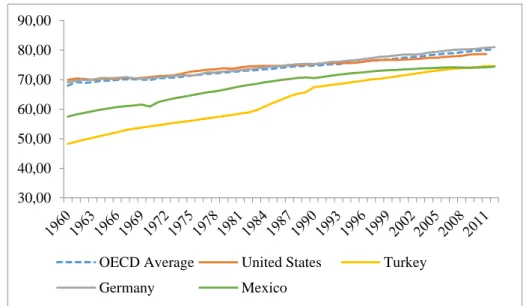
Such as in the majority of the world, also in the OECD there was a considerable increase in life expectancy. Figure 3 illustrates the increase in life expectancy at birth in average in the OECD Countries. In 1960 the expectancy in total for men and women was 67,98 years, while the latest results from 2012 point to 80,19 years, which represents a variation of 15%. Taking the case of Turkey is possible to analyse an even higher increase in life expectancy with a variation rate of 35%, from 48,30 years in 1960 to 74,60 in 2012. Mexico is as well another case of a major improvement in terms of years of expected living at birth. On the other hand, in more developed countries such as Germany and United States the increase was not so significant because in 1960 the expectation for living years was slightly higher when compared to the average of OECD countries. Still, the increase was 11,4 years in Germany and 8,7 years in the United States between 1960 and 2012 (table 2).
Similarly to what happen with fertility rate, also with life expectancy the gap between countries is narrowing and each country is becoming closer to the average.
Figure 3: Life expectancy in years at birth – from 1960 to 2012 according to OECD Health Statistics Database and authors’ calculation
30,00 40,00 50,00 60,00 70,00 80,00 90,00
OECD Average United States Turkey
16 1960 1970 1980 1990 2000 2010 OECD Average 67,98 69,86 72,63 74,78 77,15 79,82 United States 69,90 70,90 73,70 75,30 76,70 78,60 Turkey 48,30 54,20 58,10 67,50 71,10 74,30 Germany 69,10 70,60 72,90 75,30 78,20 80,50 Mexico 57,50 60,90 67,20 70,50 73,30 74,10
Table 2: Life expectancy in years at birth – from 1960 to 2010 according to OECD Health Statistics Database and authors’ calculation
As a result of the changes verified in the previous statistics, it is possible to confirm that the world’s population is changing in both size and configuration. According to the United Nations World Population Ageing 1950-2050 report (United Nations, 2000) the number of older people has tripled over the last 50 years and it will more than triple again over the next 50 years. This means that the growth rate of older population (60 years or more, according to the United Nations definition) is growing faster than the rate of growth of the total population, and the difference will be even higher when the baby boom generation starts to reach old ages. By 2045-2050 the growth ratio of older people will be three times the growth rate of total population.
Before going further on the analysis is important to know how to measure ageing populations and how a society should be classified as old. According to Gavrilov & Heuveline (2003), a society is considered relatively old when the fraction of the population aged 65 and over exceeds 8-10%. Applying this ratio to the OECD countries it is possible to conclude that most of them are considered relatively old since the percentage of elderly people is high above 8-10%.
Figure 4 illustrates the evolution of the elderly population on average in OECD’s region. As it is possible to assess, from 1971 the percentage of people older than 65 years have overcome 10% of the total population, which allows concluding that OECD’s region is from long time now an old region. In 2012, according to the OECD Employment and Labour Market Statistics the average percentage of elderly in OECD region was 15,75% which represents a variation of 44%.
Figure 5 shows the percentage of elderly population in each OECD country in 2012. Turkey and Mexico are the only two countries with a percentage of older people below the benchmark of 8% and Chile is in between the range 8%-10%. On the opposite side,
17
there is Germany and Japan with a rate of 21,08% and 24,15% of elderly population respectively.
Figure 4: Average percentage of elderly people (older than 65) over the total population from 1960 to 2012 in OECD. Source: OECD Employment and Labour Market Statistics Database and authors’ calculation
Figure 5: Percentage of elderly people over the total population in 2012 in each OECD Country. Source: OECD Employment and Labour Market Statistics Database and authors’ calculation
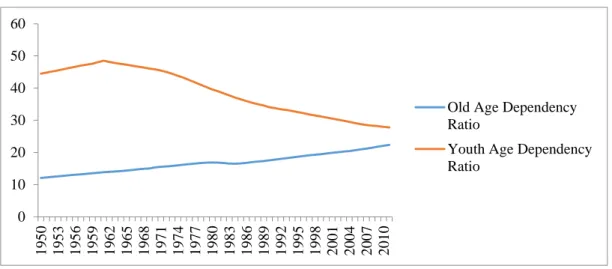
Another tool to assess the population ageing is through dependency ratios. Old age dependency ratio and youth age dependency ratio gives the percentage of people who are not in the labour force to the ones that belong to the work force. In the first case it is consider the population aged 65 years or more, in the second case it is considered the population between 0 and 14 years old. A situation of population ageing results in an increase in the first ratio and a decrease in the second one.
The decreasing trend of youth age dependency ratio in figure 6 is a consequence of the low fertility rate seen in figure 2. Following the same line of thought, the increasing old age dependency ratio can be interpreted as a result of the increase in life expectancy analysed in figure 3. In 1950 the old ratio was 12,06% and in the recent data of 2011 it
0 2 4 6 8 10 12 14 16 18 1 9 6 0 1 9 6 3 1 9 6 6 1 9 6 9 1 9 7 2 1 9 7 5 1 9 7 8 1 9 8 1 1 9 8 4 1 9 8 7 1 9 9 0 1 9 9 3 1 9 9 6 1 9 9 9 2 0 0 2 2 0 0 5 2 0 0 8 2 0 1 1 OECD Average 0 5 10 15 20 25 30 A u st ra li a A u st ri a B el g iu m C an ad a C h il e C ze ch R ep u b li c D en mark Est o n ia F in la n d F ra n ce G er ma n y G re ec e H u n g ar y Ic el an d Ir el an d Isr ae l It al y Jap an K o re a Lu x emb o u rg M ex ic o N et h er la n d s N ew Z ea la n d N o rw ay P o la n d P o rt u g al S lo v en ia S p ai n S w ed en S w it ze rl an d Tu rk ey U n it ed K in g d o m U n it ed S ta te s
18
was 22,36% while the youth ratio was 44,48% in 1950 and 61 years later the ratio decreased to 27,78%.
The change in youth dependency ratio was higher than the change in the old one which leads to conclude that low fertility rate tends to be more important to explain ageing than the increased longevity.
Figure 6: Comparison between Old (>65) and Youth (<15) dependency ratios (15-64) in the OECD Countries. Source: OECD Employment and Labour Market Statistics Database and authors’ calculation
Tables 3 and 4 show the evolution of old and youth dependency ratios in some OECD countries. Taking the example of Germany, it is possible to assess from table 3 that the variation in old dependency ratio was really high since that, according with data from 2010, people older than 65 years corresponded to 31,29% of the working force. Although in Turkey and Mexico there was also a high increase in this ratio, data from 2010 points a value of 10,60% and 9,63% respectively, which is not so representative. However, it is important to take into account that life expectancy is considerably lower in these two countries, reason why there will be less people above 65 years old when compared to USA or Germany. Compared to the total OECD ratio, only Germany is above the average.
1950 1960 1970 1980 1990 2000 2010 OECD Average 12,06% 13,66% 15,35% 16,87% 17,55% 19,68% 22,05% United States 12,53% 15,45% 15,83% 17,11% 19,02% 18,77% 19,49% Germany 14,48% 17,07% 21,64% 23,67% 21,63% 24,21% 31,29% Mexico 6,41% 6,61% 9,58% 8,344% 7,43% 8,47% 9,63% Turkey 5,69% 6,49% 8,19% 8,29% 7,19% 10,56% 10,60%
Table 3: Old age dependency ratio from 1950 to 2010 according to OECD Employment and Labour Market Statistics Database and authors’ calculation
0 10 20 30 40 50 60 1 9 5 0 1 9 5 3 1 9 5 6 1 9 5 9 1 9 6 2 1 9 6 5 1 9 6 8 1 9 7 1 1 9 7 4 1 9 7 7 1 9 8 0 1 9 8 3 1 9 8 6 1 9 8 9 1 9 9 2 1 9 9 5 1 9 9 8 2 0 0 1 2 0 0 4 2 0 0 7 2 0 1 0
Old Age Dependency Ratio
Youth Age Dependency Ratio
19
In what regards to the youth ratio evolution, by analysing table 4 it is possible to conclude that Germany is the country with the lower ratio which is in accordance with previous information of lowest fertility rate. On the opposite side, Mexico is the country with highest rate, even considering a huge decrease since 1950 (variation of -70%), matching the high fertility rate data. Similarly to what happened with the old dependency ratio, when compared to OECD total average, only Germany is below the standard level.
1950 1960 1970 1980 1990 2000 2010 OECD Average 44,48% 48,08% 45,80% 39,58% 34,04% 30,87% 27,94% United States 41,46% 51,96% 45,61% 34,14% 32,96% 32,26% 29,47% Germany 34,55% 31,65% 36,75% 28,04% 23,33% 22,98% 20,36% Mexico 78,50% 90,36% 97,78% 87,34% 65,44% 55,09% 46,19% Turkey 66,06% 75,07% 77,36% 69,19% 57,06% 46,15% 38,45%
Table 4: Youth age dependency ratio from 1950 to 2010 according to OECD Employment and Labour Market Statistics Database and authors’ calculation
3.1.2. The economic effects of population ageing
Population ageing is a matter of concern among many nations in the world due to the implications that it will have in society’s demographic structure and in each country and global economies. Once different age groups have different needs and productive capacities, the economic structure of a country will tend to change according to its population age (Bloom, Canning, & Fink, 2011). According to Weil (2006) population ageing has economic effects whenever an economic interaction (e.g. the sale of a good or service) attracts people according to their age. In fact, the different needs and behaviours of older population can be summarized in less participation in workforce, less capital offered to economy (purchases), more required health care services and, in many countries, more costs of income support through pensions’ systems.
a. Less Participation in the workforce
On one hand is expected less participation in the workforce since there are less people in the working age compared to the dependent ones. This raises the question of the existence or not of enough workers to produce the goods and services needed by the whole population. To face this problem, some governments have started to implement policies that discourage early retirement (e.g. penalties in pensions’ value) and promote longer working lives. Nonetheless, research in the labour force’s ageing reveal that with this
20
change there is a need to give older employees the opportunity to stay in their job if they wish to, as well as to keep their skills updated. Indeed, research on the role of education in ageing population by Ben-Porath (1967) has led to the conclusion that the increase in life expectancy, followed by a longer expected working life, should imply an increase in the human capital through investment on people’s education.
On the other hand, following Bloom et al. (2011), one may consider that with increased life expectancy and better health conditions, individuals are expected to work longer. However, this did not happen yet. For instance, the old-age participation in the workforce has decreased rather than increased in most OECD countries. This reality goes against the predictions and is justified by the increasing demand for leisure, general increases in average wealth and difficulties in labour markets (Bloom et al., 2011). Furthermore, there are several myths around this topic that prevent a higher participation of the elderly in the labour force, namely the fact that older workers are less productive or the impression that keeping older workers limits the youth’s ease of finding a job, among others. Börsch-Supan (2013) has concluded about the non-veracity of these arguments referring in the first case that despite other differences between young and older workers, in terms of productivity those differences are irrelevant, and in the second case his reasoning is based on the existence of positive correlation between the employment of older individuals and the employment of the younger ones.
b. Less capital offered to the economy
In their study of the implications of population ageing to the economic growth, Bloom et al. (2011) start by saying that older people have normally different behaviours and needs compared to younger people as a consequence of their age. In this sense, the reasoning presented in their study is that as elderly work less (or do not work at all if they are retired), they will receive less money, i.e., there is a decrease in their income, therefore they would also save less and offer less labour and capital to the economy. However, according to the permanent income hypothesis, consumption in a given period is not determined by income in that period but by income over one’s entire lifetime (Friedman, 1957). Considering this, no decrease in consumption should be verified in old age population. Still, the facts contradict the theory and some features of consumption are inconsistent with this hypothesis, namely the macro and microeconomic evidences that consumption responds to changes in income (Flavin, 1981).
21
Despite the different approaches, as needs change according to the stage of life-cycle in which the person is, a change in services/products demanded will eventually occur. Therefore, societies and governments should take advantage of the impact that population ageing may have in consumption, by answering to these new needs at the same time as they boost economic growth (Bloom & Eggleston, 2014).
c. More required health care services
According to the United Nations World Population Ageing 1950-2050 report, the older population is growing faster than the total population in practically all regions of the world. In fact, the percentage of elderly population is not only increasing in number but they are also becoming healthier – “compression of morbidity2” – since the length of healthy old-age appears to be increasing (Bloom et al., 2011). Still, people aged over 80 have even more particular needs especially in what regards to health assistance, considering that the need for full-time care is tendentiously higher. This age sector of the society in particular represents high costs in terms of government resources, familiar resources and personal savings.
Traditionally, families are the biggest support to their elderly relatives. However, this support is starting to be less and less reliable due to the higher rates of women in the workforce who were until now the traditional caretakers, lower birth rates and consequently decrease in family size, increasing migration tendencies (both from rural to urban locations and to other countries), intergenerational spacing (families are having their children at an older age increasing the range of years between grandparents and grandchildren). Health care and financial schemes are governments’ major challenges to fulfil this need of older people (Bloom & Eggleston, 2014). With the technological development, health care systems tend to evolve and become more developed accompanied by a natural increase in associated costs. Therefore, older people who are often the ones that most need health care will probably face higher costs to get treatment. Considering the financial difficulties they may suffer from, who will pay for the increased costs? Bloom & Eggleston (2014) suggest that this situation may lead to an increase in non-communicable diseases that questions a healthy ageing condition. Moreover, as stated by the European Union’s Economic Policy Committee, “(…) the increase of the
2 James Fries(1980) developed the concept of compression of morbidity which holds that if the age at the
onset of the first chronic infirmity can be postponed more rapidly than the age of death, then the lifetime illness burden may be compressed into a shorter period of time nearer to the age of death.
22
ratio between the number of retirees and the number of workers will amplify expenditure on public pensions and health and long-term care and thus puts a burden on maintaining a sound
balance between future public expenditure and tax revenues.”3
d. More costs of income through pensions’ systems
Population ageing will have a major implication in public economy due to many reasons, as mentioned above. Expenditure pressures on public finances will keep increasing namely due to the expenditures with health care systems but also in a considerable high percentage due to pensions’ systems. McMorrow & Roeger (2000) have concluded that due to ageing population, public pension systems, particularly in “Pay-as-you-go”4 systems, will quickly become unsustainable considering the actual ratio of old dependents. Indeed, with the steady fall in the number of people working relative to the number of retirees, it will come to a point where contributions must increase or benefits must decrease to reach an equilibrium. Governments have already started working towards this problem by conducting changes in both benefits and contribution rates and reducing the amounts paid and postponing retirement age. Still, according to the same authors, pension expenditure as a percentage of GDP will certainly keep increasing given the speed and dimension in which ageing issue evolves.
Hollanders (2012) carried out a study where he assesses the way in which ageing increases public expenditure with pensions. He points out two factors but only one has proved to be viable. The first one is the obvious above mentioned regarding the higher number of retirees which represent naturally an increase in dependency ratio and an increase in pension payments. The second and less supported by the literature is related with the ageing of voters, consequently meaning that retirees have more political clout. In this sense the electorate will easily push for an increasing in pension benefits, thus increasing the public expenditure. Hollanders (2012) did not succeed in corroborating empirically this last hypothesis, concluding that pension expenditure is not significantly associated with ageing as a result of the medium age of the electorate.
The effect of ageing on pensions systems is indeed a real problem that some governments have already started to face and others will eventually be forced to. The way they manage the issue is a question of political ideology related with public spending management.
3 European Union - Economic Policy Committee, Working Group on Ageing Populations and Sustainability
4 Pay-as-you-go (PAYG) Systems pay pensions out of current contributions or taxes. They are usually run
by governments from current tax revenues, and the amounts of the benefits are based on commitments, or promises, made by the governments (Barr, 2002)
23
However, following data and literature, sooner or later measures must be taken in this matter.
Despite all the implications and changes that population ageing will have in the global age structure, it is important to highlight that this demographic phenomenon is a consequence of great achievements in health and technology areas (namely infectious diseases and poor nutrition), that allowed remarkable improvements in living conditions. Many business opportunities may also arise with population ageing and the economy will probably see the increase in some activity sectors that were not so developed until now. For instance the training and education of human resources to work on eldercare or the designing and building of houses that suit older people needs.
3.2. Savings
Historical data shows that savings’ distribution across the world has always been quite heterogeneous. Different regions have different developing levels which translates in wide variations in the range of economic indicators in which savings rate belong. Considering the relation between savings and economic growth it would not be a surprise that the most developed regions are the ones that show higher saving rates. However, the differences start to be noted at a more micro perspective, in the same region and country, since that households have different savings behaviors which proves the existence of a close relation between income and savings. Still, according to the life-cycle theory the idea that poor people save less of their income is a fallacy because if their incomes are low in the present, the future perspectives are also of a low income then they need to save to smooth consumption as much as wealthy do.
3.2.1. World distribution of savings
Asia appears in the top of regions that have higher savings rate (in gross terms in percentage of GDP) for a long time now. As figure 7 below shows, even South Asia that initially did not present such a high rate has seen its savings rate increasing. According to a World Bank report from 1999 (The World Bank, 1999) the growth in savings rate in this region is happening since the 60’s and possibly leveraged by the exponential growth in China, given the close relation already mentioned between savings and prosperity. Indeed, in 2013 East Asia & Pacific and South Asia had a rate of savings of 30,6% and 30,7% of GDP, respectively.
24
Sub-Saharan Africa has always belonged to the regions with lower savings rate in the world, presenting in the majority of time the lowest value.
Figure 7: Gross Rate of Savings in percentage of GDP in the main regions of the World between 1980 and 2013. Source: World Bank Database and authors’ calculation
Another important conclusion to take from this analysis is the fact that in general the rate of saving is decreasing, with the solid exception of Asia. Given the importance of savings for the health of national economies and for the natural dynamics of the life-cycle it matters to analyze this issue in more detail.
3.2.2. Savings decreasing tendency
Generally savings have been decreasing all over the world and this decreasing trend is becoming an issue of concern. As presented in figure 8 below, the world average of gross saving rate has suffered high fluctuations and presented in 2013 a value of 22,78% while in 1975 it was 22,85% in percentage of GDP. Likewise, the savings rate in OECD area followed a very similar distribution in comparison to the world average which leads to the conclusion that the OECD countries are a reflection of the world in total.
Some explanations for this fluctuations can be easily found, namely in what regards to the sharp decrease verified between 2007 and 2009 that is related with the world economic and financial crisis. In 2010 the trend reversed and savings started to increase again, showing some signs of recovery in the economy and the return to the normal range.
0 5 10 15 20 25 30 35 40 1980 2013
East Asia & Pacific (all income levels) Europe & Central Asia (all income levels)
Latin America & Caribbean (all income levels) North America
25 Figure 8: Comparison between the gross rate of savings in percentage of GDP in the OECD member countries and World average. Source: World Bank Database and authors’ calculation
Focusing in OECD member countries it is possible to conclude that some countries have seen their gross saving rate decrease more than others, as it is the example of Australia and Italy that have faced a variation of -29% and -45% in their saving rates between 1970 and 2013 (table 5). Not so drastic were the fluctuations in Netherlands and United States, that faced reductions in the order of 19% from 1970 to 2013.
1970 1980 1990 2000 2010 2013 Australia 31,63% 26,54% 23,78% 21,37% 22,59% 24,60% Italy 26,92% 24,70% 21,00% 20,78% 17,29% 18,52% Netherlands 32,01% 25,42% 27,97% 29,87% 27,69% 26,65% United States 21,50% 22,18% 18,77% 20,67% 15,17% 18,18%
Table 5: Evolution of the gross rate of savings in percentage of GDP in four OECD member countries from 1970 until 2013. Source: World Bank Database and authors’ calculation
3.3. Ageing vs. Savings – statistical overview
As mentioned earlier on this study, with the rapid increase in population ageing and the implications that this demographic change has already started to have on the economy, many theories have arisen to explain the relation between ageing and savings. Some theories and studies predict that as population ages savings decrease while others foresee the contrary. Indeed, this study will assess empirically this matter, but before going on the model itself, one should look at statistical data to see which theory is more likely to be corroborated by past data. To measure ageing in this statistical analysis we used the
0 5 10 15 20 25 30
26
percentage of elderly population over the total population and savings were analyzed through the gross saving rate in percentage of GDP.
Figure 9 below presents the evolution of these two indicators between 1970 and 2013 in eight OECD countries, as an example. Regarding the percentage of elderly population in all the examples it is observable a quite constant increase even tough more obvious in some countries (Germany, Italy and Netherlands) than others (Mexico and Turkey). Concerning gross savings, the trend is much more irregular, having considerable high fluctuations in some countries (Turkey, United Kingdom and United States). Making a comparison between the beginning and the end of the period we easily conclude that in every case, the savings rate has suffered a decrease while the percentage of elderly population has increased, which seems to support the thesis that ageing tend to impact negatively the saving rate.
0 10 20 30 40 1 9 7 0 1 9 7 3 1 9 7 6 1 9 7 9 1 9 8 2 1 9 8 5 1 9 8 8 1 9 9 1 1 9 9 4 1 9 9 7 2 0 0 0 2 0 0 3 2 0 0 6 2 0 0 9 2 0 1 2 Australia
Elderly Population Gross Savings
0 10 20 30 40 1 9 7 0 1 9 7 3 1 9 7 6 1 9 7 9 1 9 8 2 1 9 8 5 1 9 8 8 1 9 9 1 1 9 9 4 1 9 9 7 2 0 0 0 2 0 0 3 2 0 0 6 2 0 0 9 2 0 1 2 Germany
Elderly Population Gross Savings
0 5 10 15 20 25 30 1 9 7 0 1 9 7 3 1 9 7 6 1 9 7 9 1 9 8 2 1 9 8 5 1 9 8 8 1 9 9 1 1 9 9 4 1 9 9 7 2 0 0 0 2 0 0 3 2 0 0 6 2 0 0 9 2 0 1 2 Italy
Elderly Population Gross Savings
0 5 10 15 20 25 30 1 9 7 0 1 9 7 3 1 9 7 6 1 9 7 9 1 9 8 2 1 9 8 5 1 9 8 8 1 9 9 1 1 9 9 4 1 9 9 7 2 0 0 0 2 0 0 3 2 0 0 6 2 0 0 9 2 0 1 2 Mexico