P. C. Albuquerque
Demographics and the Portuguese economic growth
WP17/2015/DE/SOCIUS/CSG
_________________________________________________________
De pa rtme nt o f Ec o no mic s
WORKING PAPERS
Demographics and the Portuguese economic growth
P. C. AlbuquerqueSOCIUS/CSG/ISEG/Universidade de Lisboa
Portugal has suffered an impressive decline in fertility (from 3.2 children per woman in 1960, to 1.2 in 2014), along with an increase in longevity (an almost 15 years increase in life expectancy between 1960 and 2013). This has produced an aged population, with a large old age dependency ratio: Eurostat estimates that there were 30.3 people aged 65+ per 100 people aged 15-64 in 2014. Despite the decreasing numbers of young dependents, a rising overall dependency ratio has existed since the beginning of this century.
Simultaneously, both gross domestic product (GDP) and GDP per capita growth rates have been low, or even negative during the 2000’s. Naturally, there are many reasons for this, but what is the influence of demography on economic growth? Should we expect the ageing of population to be playing a positive or a negative role? Can we blame it for at least a small proportion of our economic woes?
During the 19th and 20th Centuries, there were opposing views about the impact of demography on economic growth.
The existence of diminishing returns to labour would imply that an ever-increasing number of workers would not be accompanied by a growth rate of output at the same pace, therefore leading to decreasing output per capita. Two authors that fit in with this line of thought are Malthus and Ehrlich. Another argument that defends that population growth is adverse to economic growth can be found in the growth model of Solow, where a high population growth tends to decrease capital per worker (capital dilution), thus reducing economic growth.
Empirical studies (Kuznets 1967, Kelley 1988) had trouble finding robust evidence to support any of these positions and subsequent research settled on a population neutralism (Bloom and Canning 2006) that considered that population growth cannot explain the differences in growth rates of different countries. However, when not only total population growth was considered, but also its age structure, the importance of demographics started to show (Lindh and Malmberg 1999, Prskawetz et al. 2007). It is not so much the size of the population that matters, but its age structure.
There are three main ways that population ageing influences economic growth: labour supply, savings and investment, and productivity.
Effects of ageing on economic growth
Effects of ageing on economic growth mediated by the labour supply
The effect of ageing on economic growth driven by labour supply corresponds to an accounting effect that results from the more rapid growth in the quantity of workers, rather than that of the total population of consumers. The initial stages of population ageing, whereby the decrease in the proportion of children reduces the overall dependency ratio, and the proportion of the working age population increases, creates a demographic dividend (Bloom et al. 2003) with a positive impact on economic growth, as long as the large and increasing labour supply is absorbed by the market. Not only are there more people in working age, but by having less children, women are also more available to join the workforce.
The reduction in mortality, together with the decrease in fertility enlarges the cohorts at higher ages and reduces the cohorts at younger ages. This eventually generates a decrease in the proportion of working-age people and a growing proportion of people exiting the labour force into retirement. The effect on the total dependency ratio is not immediately obvious, as children are also counted as dependents, and their number is decreasing. If the proportion of workers increases, keeping the productivity per worker constant, then output per capita increases, otherwise it decreases.
people who were not working before. If retiring individuals were only replaced by young people entering their working-age years in a population in an advanced stage of ageing, then the number of workers would necessarily fall. However in an economy with unemployment, the larger outflows from employment into retirement may be compensated by larger inflows from unemployment. This way, population ageing will not decrease production, even for similar productivity rates. This becomes more viable the closer the substitutability between younger and older workers is, and studies show that this substitutability is somewhat limited (Eichhorst et al. 2014, Salem et al. 2010). Another way to counteract the decrease in the number of workers by demographic reasons is to bring to the labour market groups of the population that have traditionally low participation rates that discourage early retirement and create better work-life balance conditions.
Effects of ageing on economic growth mediated by savings and investment
Ageing is recognised to be a determinant of savings behavior, and if there is a positive relation between savings and investment which should be a channel that influences the effect of ageing on economic growth.
Authors such as Coale and Hoover (1958) argued that higher population growth and an increase in the number of children decrease the ability to save and therefore the growth of output. Conversely, in an ageing society, we should expect families to have a higher ability to save. Therefore, this view is optimistic about the effect of population ageing on growth, as long as savings are invested productively. However, this “dependency effect” (Prskawetz et al. 2007) should include the increase in the proportion of the dependent elderly, and in this case, the positive effect of ageing is smaller.
as there is a bequest motive, whereby people want to leave their savings to their heirs. But even accepting that individual age saving profiles do not change much, lower growth rates resulting from a decrease in the size of the labour force should have a negative feedback on savings, merely based on the positive relation between income and savings (Lindh 1999).
The IMF (2005) estimates that an increase in 1% of the elderly dependency ratio generates a decrease of 1.5% of GDP in savings in industrial countries. Meredith (1995) finds that changes in the elderly dependency ratio typically have greater effects on savings than changes in the youth dependency ratio.
There is, however, a second dividend that may manifest itself if the first dividend is used to improve the conditions for ageing to incentivise the formation of capital. If consumers and policymakers are forward-looking, then they react to longer retirement periods with an increase in savings (Kinugasa and Mason 2007). This is possible because reduced fertility allows for a larger accumulation of wealth during working years (Kelley and Schmidt 1996, Schultz 2005), and also the decrease in the working age population increases the marginal product of labour and corresponding wages (Kinugasa and Mason 2007). Therefore, a second dividend arises from the investment of these additional assets. If investment is made in the domestic economy, then the result will be more physical capital per worker, and a more rapid growth in output per worker and in wages. If investment is made abroad, then the result will be an increase in the current account and in national income, with a higher growth in per capita income (Mason 2005). Of course, if instead of expecting longer retirements periods, people expect longer working lives, then the incentive to increase savings in each working year is lower, but the result is more working years with the corresponding higher saving rates
In addition to private savings, public savings also need to be considered. A large weight of pensions in public expenditures is particularly responsible for pressure on the deterioration of public savings and a consequent decline in national savings.
Effects of ageing on economic growth mediated by productivity
The ageing of the population changes the age composition of workers, and by doing so the overall productivity of labour changes in line with the productivity performance of those age categories that become more or less abundant.
Looking at the age-productivity profile, it is easy to find studies that concluded that there is a decline in some abilities with age, after a certain stage (Verhaegen and Salthouse 1997). The ages when the creative output peaks seem to be between 30 and 40 years’ old (Lehman 1953, Miller 1999), although it varies among different areas of activity. The innovation that leads to economic growth is the one that is applied, but in the adoption of new technologies there is also evidence of a gap between younger and older generations (Charness and Boot 2009). Technological and organisational changes require adaptability, which is a skill that tends to decrease with age (Bonsang et al. 2012). At the aggregate level, the negative association between the likelihood of technology adoption and the share of older workers in firms need not reflect a lower propensity of older workers to adopt to new technologies, but rather it is also explainable by a lower incentive for employers to invest in the training of workers with lesser remaining work life (Wasiluk 2014).
There are, nevertheless, skills that improve with age, such as: management skills, work planning skills, conscientiousness, independence and experience (Bonsang et al. 2012). When the value of these skills outweighs that of abilities that tend to decline with age, then job performance increases with age. Accelerating technological change may increase skills obsolescence and render experience less important, but it is still not inevitable that productivity decreases with age.
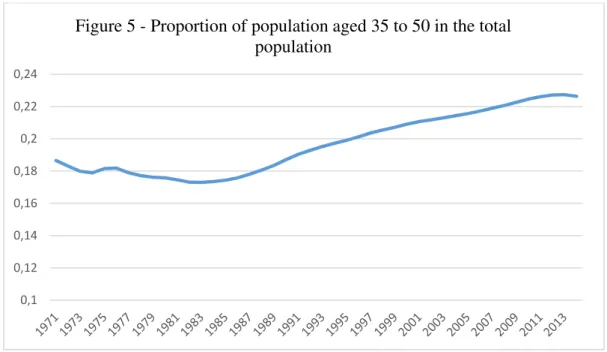
Burtless (2013) associates higher aggregate productivity with an increase in the proportion of those aged 35-50.
Ageing changes not only the age structure of the workforce, but also its relative dimension. As mentioned in the previous section, a decrease in the working age population with an actual decrease in the number of workers, ceteris paribus, increases
capital density and therefore, the marginal product of labour, that is to say, labour productivity.
The idea that population ageing may deliver a second dividend is based on the conditions that the previous ageing stage creates to increase savings that may continue after the first dividend is exhausted, as we saw in the previous subsection. Furthermore, part of these conditions reflect the relation between ageing and human capital. Human capital results from both education and health. A population that lives longer, and is healthier, benefits more from investment in education, and as parents have fewer children, they may invest more in their education. Parents start to value more quality rather than the quantity of children (Becker et al. 1990; Galor 2011). This delays entrance into the labour market, but it enhances the productivity of workers. A population which is healthier should also be more productive (Bloom et al. 2004), with consequent higher economic growth and higher longevity, which must result from individuals being healthier on average. Nevertheless it is necessary to evaluate how much this will impact on productivity and growth, as while there is a decline in the disability of individuals aged 65 and more is well documented, but there are signs that the same has not been happening with those aged 50-64 (Martin et al. 2010).
The influence of demography on economic growth in Portugal
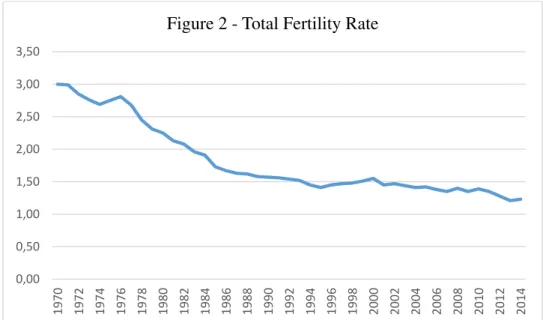
After 2010, the total Portuguese population has been decreasing (Fig. 1). Very low fertility and migration flows have worked in tandem in recent years. Net migration, which used to contribute to the increase in population size, decreased radically in 2010, and has been negative since then. The total fertility rate1 has been below the 2.1 babies per woman replacement level since 1982, and is currently approximately 1.2 (Fig. 2). Such low
1The total fertility rate is the average number of children a woman would have,
fertility rates over an extended period of time would inevitably lead to a decline in population.
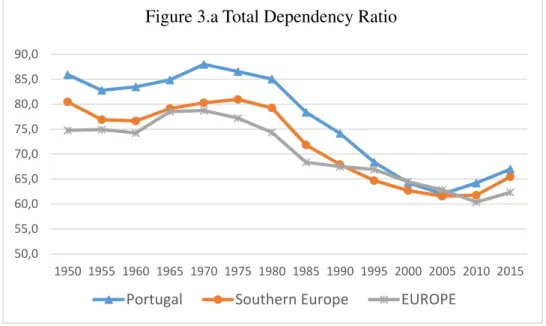
The active population (those who are either working or unemployed) decreased after 2008, although it saw a slight rise in 2010. The working age population (15-64) has been decreasing since 2008, in absolute terms. In relative terms, as a proportion of total population, it has been decreasing since 1999, and it has just exhausted its demographic dividend2. If we prefer to consider the working age population as being those aged 20-64, then it started decreasing in absolute terms in 2010, and in relative terms in 2007. Such demographic changes have translated into youth and old-age dependency ratios which, when combined, are already producing a rise in the total dependency ratio (Fig. 3), which is higher in Portugal when compared with the European average, of even with the average of Southern European countries.
Van der Gaag and De Beer (2015) calculated the demographic dividends (or demographic burdens) for the European Union countries during the period of 2000-2010, and made a projection for 2010-2020. For Portugal, this shows, in fact, a transition from a demographic dividend to a demographic burden. It should be pointed out that all the countries are projected to face a demographic burden in this second period and, in this study, Portugal is not amongst the most affected.
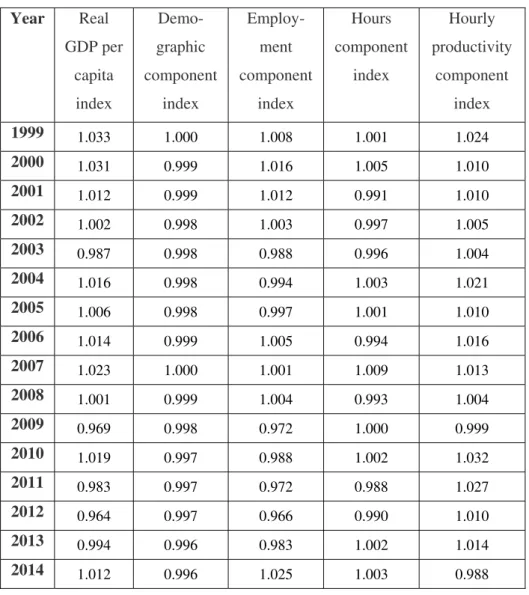
Using their methodology – which had already been used by Denton and Spencer (1997) - we decompose the growth in per capita income between 1998 and 2013 in different components, to see which part of it is due to the evolution of demography. The effect of ageing on growth which is manifested by our calculus is the accounting effect, which is working through the labour market.
Gross domestic product per capita can be decomposed into several components which make up the labour input:
GDP per capita =
Where GDP is the gross domestic product, Pop is total population, workers is the number of individuals working, WAP is the working age population (15-64 years old), and hours
is the average annual hours actually worked per worker. Data for workers and for hours
are from OCED Statistics, and the rest is from the official statistics of Portugal.
, being the share of working-age population in the total population is a purely demographic component. and are respectively the employment effect and the hours (or labour utilisation) effect, and is the productivity effect.
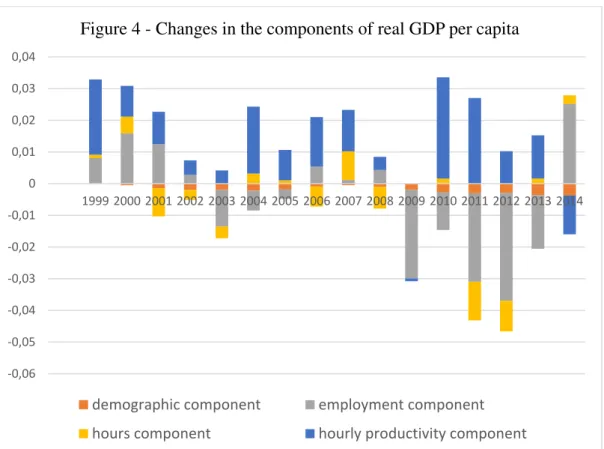
Note that our employment effect does not exactly match the employment rate concept, as we are considering the total number of workers, not just those aged 15-64. It is important to do this, as if more people aged 65+ keep on working, then we want to capture this. The results are presented in Table 1 and in Fig. 4. Table 1 displays the chain indexes of each component, which translate into the contributions of the different components to the annual percentage change in real GDP per capita, as shown in Figure 4.
The change in the proportion of people in working age in the total population has contributed negatively to the recent evolution of per capita output.
In addition to this, the contribution of employment is clearly negative during the years of the crisis. This effect mainly reflects the high rates of unemployment during this period, and it also incorporates changes in participation rates.
The hourly productivity component is that which shows a more regularly positive contribution. We must note that this is a residual component that is itself influenced by the ageing of population in ways that our study does not allow us to quantify precisely. Several demographic elements may have played a part in the evolution of productivity in Portugal. It is known that both reduced fertility and more longevity are responsible for an increase in the investment in education, which in turn should be reflected in higher productivity. In Portugal, the expected number of years in education over a lifetime increased from 16.5 to 18 in a decade (Eurostat). Together with the increase in the number of healthy years (Table 2), years in education produce a potential increase in aggregated productivity.
considerable increase in productivity since the 1980’s. Only very recently has this proportion ceased to increase (Fig. 5).
As seen above, the changing age structure also has consequences for economic growth that is mediated through savings and investment. Nevertheless, it is hard to think of an indicator that shows that the Portuguese demography has been encouraging, or discouraging private savings and investment. The decreasing trends of these variables (Fig. 6) were already observable when the total dependency ratios were still decreasing. A more sophisticated analysis would be needed to determine such a relation.
Conclusions
The low Portuguese economic growth rates of the 2000’s are a result of several causes. Ageing of the population may potentially be one of them. Are we facing Alvin Hansen’s “secular stagnation” due to demographics?
One and a half decades is a relatively short period of time to see the effect of demographics, but our decomposition exercise still shows that the contribution of pure demographics – the change in the proportion of people in working age in the total population - to the recent evolution of per capita output may not be large, but it is consistently negative. Population ageing also impacts economic growth through the other channels that were explained in the first part of this paper, and some of those mechanisms may have produced a positive influence on growth, namely demographic inducement for rising levels of human capital. We are aware that some complexities may not have been addressed in this analysis, particularly feedback effects.
demographic burden. It is possible that the interaction between these two objectives brings difficulties: as currently unemployed individuals may have lower than average productivity levels, and thus the use of their labour services may decrease average aggregate productivity.
The consequences of ageing on economic growth are mixed. There are valid concerns about the impact of ageing on per capita output, but, however, it also causes positive effects and it is thus possible to transform these challenges into opportunities.
References
Ando A. and F. Modigliani, 1963, The “life-cycle” hypothesis of saving: aggregate implications and tests, The American Economic Review, 53, 1, Part 1 pp.55-84 Baker D., J. De Long and P. Krugman, 2005, Asset returns and economic growth, Brookings Papers on Economic Activity 1, pp.289-330
Becker G., K. Murphy and R. Tamura, 1990, Human capital, fertility, and economic growth, Journal of Political Economy, 98, 5, pp.S12-37
Bloom D. and D. Canning, 2006, Demographic challenges, fiscal sustainability and economic growth, Harvard School of Public Health Program on the Global Demography of Aging WP Nº8
Bloom D., D. Canning and J. Sevilla, 2003, The demographic dividend: a new perspective on the economic consequences of population change. Rand Corporation
Bloom D., D. Canning and J. Sevilla, 2004, The effect of health on economic growth: a production function approach. World Development 32, 1, pp.1– 13.
Bonsang E., T. Dahmen, A. Dupuy and A. De Grip, 2012, Cognitive functioning over the life cycle, Netspar Panel Paper 29
Boulier B., 1979, Reviewed Work: The Economics of Population Growth by Julian L. Simon, Journal of Political Economy, 87, 4, pp. 910-912
Charness N. and W. Boot, 2009, Aging and information technology use: potential and barriers, Current Directions in Psychological Science 18, 5, pp.253-58
Coale A. and E. Hoover, 1958, Population Growth and Economic Development in Low-Income Countries: A Case Study of India’s Prospects, Princeton: Princeton University Press.
Denton F. and B. Spencer, 1997, Population, labour force and long-term economic growth, Independence and Economic Security of the Older Population (IESOP) Research Paper.25
Eichhorst W., T. Boeri, A. Coen, V. Galasso, M. Kendzia and N. Steiber 2014 How to combine the entry of young people in the labour market with the retention of older workers? IZA Journal of European Labor Studies 3: 19
Feyrer J., 2007, Demographics and productivity, Review of Economics and Statistics, 89, pp.100–109
Friedman M., 1957, A Theory of the Consumption Function, Princeton: Princeton University Press
Galor O. 2011, Unified Growth Theory, Princeton: Princeton University Press
Higgins M., 1998, Demography, national savings and international capital flows, International Economic Review, 39, 2, pp.343-369
IMF, 2005, Global imbalances: a saving and investment perspective, Chapter 2, World Economic Outlook. Washington DC.
Kelley A., 1988, Economic consequences of population change in the Third World, Journal of Economic Literature, 26, pp.1685-1728
Kelley A. and R. Schmidt, 1996, Toward a cure for the myopia and tunnel vision of the population debate: a dose of historical perspective, in Ahlburg, D., A. Kelley and K.
Mason (eds), The Impact of Population Growth on Well-being in Developing Countries, New York: Springer-Verlag, pp.11-35
Kinugasa T. and A. Mason, 2007, Why nations become wealthy: the effects of adult longevity on saving, World Development, 35, 1, pp.1–23.
Kuznets S., 1967, Population and economic growth Proceedings of the American Philosophical Society, 111, 3, pp.170-193
Lehman H., 1953, Age and Achievement, Princeton: Princeton University Press.
Lindh T., 1999, Age structure and economic policy: the case of saving and growth, Population Research and Policy Review, 18, pp.261-277
Lindh T. and B. Malmberg, 1999, Age structure effects and growth in the OECD, 1950-90, Journal of Population Economics 12, 3, pp.431-449
Martin L., V. Freedman, R. Schoeni and P. Andreski, 2010, Trends in disability and related chronic conditions among people ages fifty to sixty-four, Health Affairs, 29, 4, pp.725-731
Mason A., 2005, Demographic transition and demographic dividends in developed and developing countries. United Nations Expert Group Meeting on Social and Economic Implications of Changing Population Age Structures, Mexico City. New York: United Nations
http://www.un.org/esa/population/meetings/Proceedings_EGM_Mex_2005/mason.pdf
Meredith G., 1995, Demographic change and household saving in Japan in Baumgartner,
U. and G. Meredith (eds.) Saving Behavior and the Asset Price “Bubble” in Japan: Analytical Studies, Washington DC: International Monetary Fund
Miller G., 1999, Sexual selection for cultural displays, in Dunbar R., C. Knight and C. Power (eds.), The Evolution of Culture. Edinburgh: Edinburgh University Press, pp.71-91
Prskawetz A., T. Fent, W. Barthel, J. Crespo-Cuaresma, T. Lindh, B. Malmberg and M. Halvarsson, 2007, The relationship between demographic change and economic growth in the EU, Institut für Demographie, Österreichische Akademie der Wissenschaften Research Report 32
Salem M., D. Blanchet, A. Bozio, M. Roger, 2010, Labor force participation by the elderly and employment of the young, the case of France, in Gruber J. and D. Wise (eds)
Social Security Programs and Retirement around the World: The Relationship to Youth Employment. Chicago: University of Chicago Press, pp.119–146.
Simon J., 1977, The Economics of Population Growth, Princeton: Princeton University Press
Tang J. and C. McLeod, 2006, Labour force ageing and productivity performance in Canada, Canadian Journal of Economics, 39, 2, pp.582-603
Van der Gaag N. and J. De Beer, 2015, From demographic dividend to demographic burden: the impact of population ageing on economic growth in Europe, Journal of Economic and Social Geography, 106, 1, pp.94-109
Verhaegen P. and T. Salthouse, 1997, Meta-analyses of age-cognition relations in adulthood: estimates of linear and nonlinear age effects and structural models, Psychological Bulletin, 122, 3, pp.231-249.
Figures
Data Sources: Official Statistics of Portugal - Deaths Statistics, Live Births Statistics and Annual Estimates of Resident Population;
Source: PORDATA
Data Sources: Official Statistics of Portugal - Demographic Indicators Source: PORDATA
‐300 ‐200 ‐100 100 200 300 400 500
1960 1962 1964 1966 1968 1970 1972 1974 1976 1978 1980 1982 1984 1986 1988 1990 1992 1994 1996 1998 2000 2002 2004 2006 2008 2010 2012 2014 Figure 1 - Annual population growth
(Thousands of individuals)
Net increase Natural increase Net migration
0,00 0,50 1,00 1,50 2,00 2,50 3,00 3,50
Definition: People under 20 or 65+, divided by individuals aged 20 to 64, multiplied by 100.
Definition: People under 20, divided by individuals aged 20 to 64, multiplied by 100.
50,0 55,0 60,0 65,0 70,0 75,0 80,0 85,0 90,0
1950 1955 1960 1965 1970 1975 1980 1985 1990 1995 2000 2005 2010 2015
Figure 3.a Total Dependency Ratio
Portugal Southern Europe EUROPE
0 10,0 20,0 30,0 40,0 50,0 60,0 70,0 80,0
1950 1955 1960 1965 1970 1975 1980 1985 1990 1995 2000 2005 2010 2015
Figure 3.b Child Dependency Ratio
Definition: People aged 65+, divided by individuals aged 20 to 64, multiplied by 100. Source: United Nations, Population Division
10,0 15,0 20,0 25,0 30,0 35,0 40,0
1950 1955 1960 1965 1970 1975 1980 1985 1990 1995 2000 2005 2010 2015
Figure 3.c - Old Age Dependency Ratio
Portugal Southern Europe EUROPE
‐0,06 ‐0,05 ‐0,04 ‐0,03 ‐0,02 ‐0,01 0 0,01 0,02 0,03 0,04
1999 2000 2001 2002 2003 2004 2005 2006 2007 2008 2009 2010 2011 2012 2013 2014
Figure 4 - Changes in the components of real GDP per capita
Data source: Official Statistics of Portugal - Annual Estimates of Resident Population
Proportion - %
Data source: Official Statistics of Portugal – National Accounts (Base 2011) Source: PORDATA
0,1 0,12 0,14 0,16 0,18 0,2 0,22 0,24
Figure 5 - Proportion of population aged 35 to 50 in the total population
0 5 10 15 20 25 30 35
1995 1996 1997 1998 1999 2000 2001 2002 2003 2004 2005 2006 2007 2008 2009 2010 2011 2012 2013
Figure 6 - Investment and saving rates
Tables
Table 1 Components of the growth of the Portuguese output per capita
Year Real
GDP per capita index Demo- graphic component index Employ-ment component index Hours component index Hourly productivity component index
1999 1.033 1.000 1.008 1.001 1.024
2000 1.031 0.999 1.016 1.005 1.010
2001 1.012 0.999 1.012 0.991 1.010
2002 1.002 0.998 1.003 0.997 1.005
2003 0.987 0.998 0.988 0.996 1.004
2004 1.016 0.998 0.994 1.003 1.021
2005 1.006 0.998 0.997 1.001 1.010
2006 1.014 0.999 1.005 0.994 1.016
2007 1.023 1.000 1.001 1.009 1.013
2008 1.001 0.999 1.004 0.993 1.004
2009 0.969 0.998 0.972 1.000 0.999
2010 1.019 0.997 0.988 1.002 1.032
2011 0.983 0.997 0.972 0.988 1.027
2012 0.964 0.997 0.966 0.990 1.010
2013 0.994 0.996 0.983 1.002 1.014
2014 1.012 0.996 1.025 1.003 0.988
Author’s calculations.
Table 2 - Years of Healthy Life
2006 2013
Women 57.9 62.2
Men 60.0 63.9
Table 3 – Activity and employment rates
Year
Activity Rate
Employment Rate
% %
2014a 58.8 62.6
2013a 59.3 60.6
2012a 60.2 61.4
2011a 60.5 63.8
2010b 54.6 61.2
2009b 55.6 61.4
2008b 57.4 62.0
2007b 57.3 62.2
2006b 57.3 62.1
2005b 57.2 61.9
2004b 57.5 61.6
2003b 58.0 61.9
2002b 58.8 61.9
2001b 59.0 61.5
2000b 58.6 61.0
1999b 57.8 60.5
1998b 57.4 60.3
a 2011 series b 1998 series
Source: Official Statistics of Portugal