Inheritance and genetic mapping of resistance to Asian soybean rust
in cultivar TMG 803
Éder Matsuo1*, Tuneo Sediyama2, Sérgio Hermínio Brommonschenkel3 and Cosme Damião Cruz4
Received 20 August 2013
Accepted 4 August 2014
Abstract – This study analyzed the inheritance and identified microsatellite markers linked to the resistance gene to Phakopsora pachyrhizi in soybean cultivar TMG 803. Hybridization between the cultivars TMG 803 and BRS Valiosa RR was performed to obtain
F
1 progenies and the F2 population. The response of the parents ‘TMG 803’ and ‘BRS Valiosa RR’ to P. pachyrhizi was, respectively,
resistant and susceptible, and among the 116 F2 plants, 93 were resistant and 23 susceptible, under natural infection and field conditions.
It was found that the resistance of cultivar TMG 803 is controlled by one gene with complete dominance, mapped as resistance locus Rpp4 of linkage group G. Of the 16 tested, one microsatellite marker, sc21_3420, was completely linked to the resistance gene (distance 0.0cM) and the favorable allelic form was present in cultivar TMG 803, which may therefore be useful in assisted selection in segregating populations.
Key words: Glycine max, breeding, Phakopsora pachyrhizi, molecular marker, SSR marker. Crop Breeding and Applied Biotechnology 14: 209-215, 2014
Brazilian Society of Plant Breeding. Printed in Brazil
ARTICLE
http://dx.doi.org/10.1590/1984-70332014v14n4a33
1 Universidade Federal de Viçosa (UFV), Instituto de Ciências Exatas e Tecnológicas, Rodovia MG 230, km 7, CP 22, 38.810-000, Rio Paranaíba, MG, Brazil. *E-mail: [email protected]
2 UFV, Departamento de Fitotecnia, Av. PH Rolfs, s/n, 36.570-900, Viçosa, MG, Brazil 3 UFV, Departamento de Fitopatologia
4 UFV, Departamento de Biologia Geral INTRODUCTION
Soybean (Glycine max (L.) Merr.) is the chief oilseed grown and consumed worldwide. Brazil, with an estimated production of 86,273,200 tons in the 2013/14 harvest, ranks as the second largest producer of the grain (CONAB 2014), but has the potential to become the largest, according to Sediyama et al. (2009).
However, a major negative influence on the national
soybean production is soybean rust (SR), a disease caused by Phakopsora pachyrhizi Sydow & Sydow (Dhingra et
al. 2009), first reported in Brazil in the 2000/01 growing season (Yorinori et al. 2005). According to Lima et al. (2012), the cost of the mainly fungicide-based control of this crop disease, must have exceeded US$ 16 billion by the 2010/11 growing season.
Thus, Morales et al. (2012) emphasized that the best way
to avoid significant production losses is disease prevention
by planting resistant cultivars. This is directly related to knowledge about the pathogen and plant defense mecha-nisms as well as the development of resistant cultivars and
effective control strategies.
With regard to SR, five loci (Rpp1, Rpp2, Rpp3, Rpp4,
and Rpp5) were reported that allocate dominant alleles:
Rpp1 identified in PI200492 (McLean and Byth 1980), Rpp2 of PI230970 (Bromfield and Hartwig 1980), Rpp3
in PI462312 (Bromfield and Melching 1982), Rpp4 in PI459025 (Hartwig 1986), and Rpp5 in PI 200526 (Garcia et al 2008); as well as two alleles of alternative resistance (Rpp1? And Rpp1-b) at locus Rpp1 (Chakraborty et al. 2009, Ray et al. 2009). Since then, the pyramiding of these genes has been studied with a view to soybean breeding. According to Yamanaka et al. (2013), lines containing the pyramided alleles Rpp2, Rpp4 and Rpp5 are promising for breeding for SR-resistance and may be effective against a population of several P. pachyrhizi isolates.
However, for the success of a breeding program resistant pathogen genotypes in segregating populations must be
identified in the early and intermediate breeding stages. This
microsatellites and SNPs (Single Nucleotide Polymorphism) are the most commonly used for the selection and mapping of genomic regions associated with genes and QTLs, as in soybean (Fuganti et al. 2004, Morceli et al. 2008, Dias et al. 2009), rice (Pinheiro et al. 2012) and maize (Teixeira et al. 2013). Certainly, microsatellite markers have been used due to their high polymorphism, codominance, reproducibility and good distribution throughout the genome (Ferreira and Grattapaglia 1998, Song et al. 2004).
In this context, the segregation of an F2 population origi-nated from the cross ‘TMG 803’ x ‘BRS Valiosa RR’ was investigated to identify microsatellite markers linked to the resistance gene against Asian soybean rust in ‘TMG 803’.
MATERIAL AND METHODS
The cultivars TMG 803 and BRS Valiosa RR were hybridized to obtain F1 progenies and the F2 population, in a greenhouse of the soybean breeding program of the Crop Science Department, Universidade Federal de Viçosa (UFV).
After harvesting the seeds from artificial pollination, the F1 generation was planted and grown in the same environment where hybridizations had been performed, as recommended for the crop (EMBRAPA 2008).
The F2 population and parents were grown on the
ex-perimental field Diogo Alves de Mello of the UFV (lat 20º 46’ 03’’ S, long 42º 52’ 10’’ W, alt 650m asl), according to
the technical recommendations for the crop (EMBRAPA 2008). In this experiment, a F2 population of 116 plants and 38 plants of each parent were used. The plants were grown
in 2-m long rows, spaced 0.80m apart, with five plants per
meter. Additionally, cultivar BRS Valiosa RR was planted around the borders and additional sprinkler irrigation was provided, according to crop requirements. For an undisturbed development of the pathogen (P. pachyrhizi) on the plant leaves, no disease control was applied.
After identifying the pathogen on the leaves, the plants were discriminated for the typical SR reactions (RB: Red-Brown lesion, indicating resistance and TAN: Tan lesion, indicating susceptibility). The data of the phenotypic
evaluation were tested for fitting the segregation model 3:
1, in relation to the control provided by a dominant gene, and 13: 3, in relation to the control provided by two genes with epistatic interaction, by the chi-square test, at the 5%
level of significance.
Molecular analyses were performed at the Laboratory of Genomics, Department of Plant Pathology/Bioagro, UFV. The DNA was extracted from the plant leaves by the
CTAB method (Doyle and Doyle 1987), with modifications.
The DNA integrity and concentration were determined on ethidium bromide-stained agarose gel (1%). Based on the estimated concentration, the samples were diluted in auto-claved Milli-Q H20 to a final concentration of 5 ng µL-1, to be used in the work solution. Part of each sample was stored undiluted at -20 °C for later use.
Since there are no reports in the literature about which resistant gene is present in TMG 803, we selected
microsatel-lite markers linked to the five SR- resistance loci of soybean.
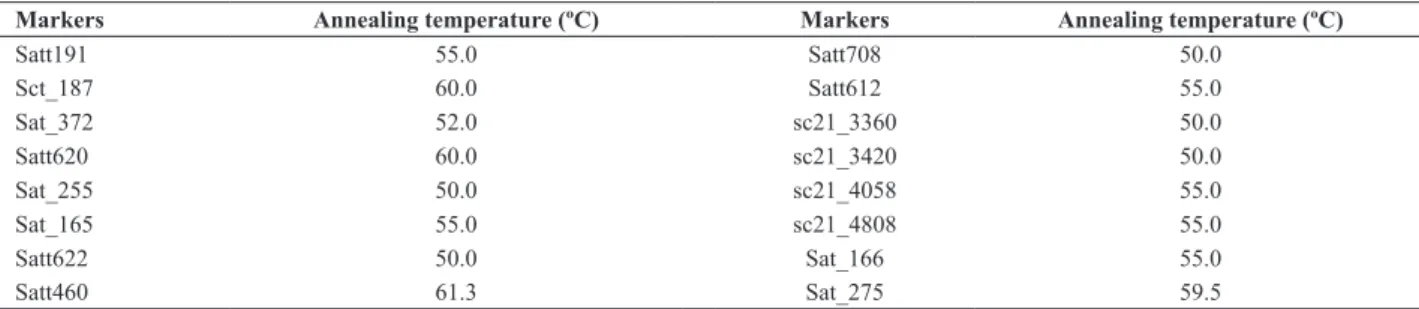
Thus, 16 microsatellite markers were tested (locus Rpp1: Satt191, Sct_187 and Sat_372; locus Rpp2: Satt620, Sat_255, Sat_165 and Satt622; locus Rpp3: Satt460 and Satt708; locus Rpp4: Satt612, sc21_3360, sc21_3420, sc21_4058 and sc21_4808; locus Rpp5: Sat_166 and Sat_275) to detect polymorphism between the parents (TMG 803 and BRS Valiosa RR). Information on the marker sequence for all microsatellite markers can be found at the site Soybase (http://soybase.agron.iastate.edu/resources/ssr.php).
After identifying polymorphisms, 10 resistant and 10 susceptible plants were analyzed by the BSA (Bulked Segre-gant Analysis) developed by Michelmore et al. (1991). It is worth emphasizing that the plants were analyzed separately without mixing DNA for bulk formation. The SSR mark-ers with polymorphism between the parents and the bulks (resistant and susceptible) were considered candidates for the evaluation of F2 plants.
Amplification reactions were performed in a Gene Amp PCR System 9700 Thermal Cycler in a final volume of 20 μL, containing 6.0 μL DNA at 5 ng µL-1 genomic DNA of
soybean, 2.0 μL of 10X buffer, 1.2 μL MgCl2 at 1.25 mM
µL-1, 1.6 µL dNTPs at 2. 5 mM µL-1, 0.8 µL primer at 10
μM (Foward and Reverse mixture) and 0.1 μL Taq (5 U µL-1). The program used for DNA amplification consisted
of an initial denaturation at 94 ºC/5min followed by 40 denaturation cycles at 94 ºC/40s. At this stage, the anneal -ing temperature of the markers varied from 50 °C to 61.3
ºC (Table 1) and 72 ºC/40s for DNA amplification. The final program consisted of polymerization at 72 °C/25min. The PCR product was first analyzed on (1%) agarose
gel stained with ethidium bromide and visualized on an ultraviolet light transilluminator. Once successful, the PCR product was diluted in autoclaved Milli-Q H20 and analyzed on an automated DNA sequencer model ABI3100 or, when possible, directly on the agarose gel. The size of the
ampli-fied base pairs analyzed by an automated sequencer was
estimated with software GeneMapper, version 3.5.
The segregations of the amplified microsatellite markers
model, by the chi-square test at the 5% level of significance.
For linkage analysis and map construction software GQMOL (Schuster and Cruz 2008) was used with the Kosambi map-ping function. The linkage criterion was a LOD score > 3.0 and the maximum distance was 30.0 cM.
The selection efficiency (SE%) of microsatellite mark
-ers, identified in this study, was calculated as described
by Silva et al. (2007). Similar studies were performed by Morceli et al. (2008).
Where
MFMF = Plants selected correctly as resistant based on marker analysis and phenotypic evaluation;
mfmf = Plants selected correctly as susceptible, based on markers and phenotypic evaluation;
TP = Total plants analyzed.
RESULTS AND DISCUSSION
On the plants of the cultivars TMG 803 and BRS Valiosa RR, we observed RB lesions (resistant) and TAN lesions (susceptible), respectively, indicating that the quantity and quality of the P. pachyrizi inoculum in this area and the environmental conditions were favorable for the pathogen development on the plant leaves.
Among the 116 F2 plants evaluated, 93 behaved as re-sistant and 23 as susceptible to SR. Segregation was tested for the agreement with the expected Mendelian ratio of 3:1 (3 resistant plants and 1 susceptible plant) and 13:3 (13 resistant and 3 susceptible plants).
Of the 16 SSR markers tested, six (Satt191, Sat_372, Satt460, Satt708, sc21_3420, and sc21_4808) indicated polymorphism between the cultivars TMG 803 and BRS Valiosa RR and after analyzing the resistant and susceptible bulks, two (Satt191 and sc21_3420) were used to analyze
the adequacy of segregation, which satisfactorily fit the
expected rate of codominant inheritance (1:2:1) by the chi-square test (Table 2).
In the analysis of phenotypic data (RB and TAN lesions) of 116 plants, the chi-square values were 1.65 (p = 0.198) and 0.08 (p = 0.766) for the ratios 3:1 and 13:3, respectively. Thus, considering (p = 0.05), both hypotheses of
segrega-tion were considered true. This confirms results reported in
other studies, where monogenic inheritance with complete dominance was observed in PI 200492 (Rpp1) (Hyten et al. 2007), in PI 230970 (Rpp2) (Silva et al. 2008) and in PI 459025 (Rpp4) (Silva et al. 2008, Costa et al. 2008). Similarly, a 13:3 ratio was observed in several segregating F2 soybean populations resistant to SR, considering the segregation pattern of the RB and TAN reactions (Pierozzi
et al. 2008). This ratio is a modification of the proportions
9:3:3:1 and indicates digenic inheritance (two unlinked
Table 1. Annealing temperature of the markers used in the study
Markers Annealing temperature (ºC) Markers Annealing temperature (ºC)
Satt191 55.0 Satt708 50.0
Sct_187 60.0 Satt612 55.0
Sat_372 52.0 sc21_3360 50.0
Satt620 60.0 sc21_3420 50.0
Sat_255 50.0 sc21_4058 55.0
Sat_165 55.0 sc21_4808 55.0
Satt622 50.0 Sat_166 55.0
Satt460 61.3 Sat_275 59.5
Table 2. Chi-square test (χ2) of the phenotypic segregation of the F
2 population of (‘TMG 803’ x ‘BRS Valiosa RR’) and of polymorphic microsatellite
markers1
Trait Reaction classes Hypothesis X2
Probability (%) RB TAN
Phenotypic evaluation 93 23 3 1 1.65 19.8 ns
Phenotypic evaluation 93 23 13 3 0.08 76.6 ns
R H S
Satt191 33 59 24 1 2 1 1.43 48.8 ns
sc21_3420 30 63 23 1 2 1 1.70 42.5 ns
genes). The resistant cultivar would have the genotypes A_B_, A_bb, aabb, and the susceptible genotype, genotype aaB_, i.e. 13 resistant and 3 susceptible (Viana et al. 2003).
Between the phenotypic evaluation of F2 plants and
the DNA amplification pattern with microsatellite marker
sc21_3420 an agreement of 100% was also observed. That is, the phenotypically resistant plants (lesion RB) had a
similar amplification pattern to ‘TMG 803’ or were het -erozygous with marker sc21_3420. The susceptible plants
had an amplification pattern similar to that of cultivar BRS
Valiosa RR. Thus, it can be stated that the resistance of cultivar TMG 803, for lesion RB and TAN, is controlled by one gene with complete dominance.
It is noteworthy that if a greater number of F2 plants of this cross is evaluated, the values obtained by the chi-square test and probabilities could be changed. In addition, the agreement between the phenotypic and molecular evalua-tion may be less than 100%. For the acceptance of the ratio
of 13: 3 in this study, at least one phenotypically resistant
(lesion RB) plant (1/13) had to have the amplification pat -tern of BRS Valiosa RR for marker sc21_3420.
The estimates of the distances between each marker and the SR-resistance gene and LOD score values are shown in Table 3. The distance between the marker sc21_3420 score was equal to 0.0cM and the LOD score was 25.4 at a ratio of 3:1 for the lesion type (RB and TAN) of the F2 population. For 13:3, the LOD value was 22.1. The other estimates, of the distance and LOD, were also similar between the two ratios (3:1 and 13:3).
The LOD is a statistic associated with an acceptable test to evaluate the hypothesis of linkage or independent segregation between locus pairs, since it is directly related to the likelihood ratio considering the probability of two genes being linked or not. Loci are linked when the LOD score is greater than 3 (probability of 1:1000), i.e., LOD = 3 means that the likelihood considering the r value is 1000
Table 3. Estimates of the distances between each marker and the resistance gene (Gene R) and LOD scores from the analysis of 116 F2 plants consider-ing a Proportion 3:1 (3 resistant and 1 susceptible) and 13:3 (13 resistant and 3 susceptible)
Marker 1 Marker 2 Distance (cM) LOD Morgan Kosambi
--- Proportion F2 (3:1 – 3 Resistant : 1 Susceptible))
---Gene R1 Satt191 26.6 29.6 3.3
Gene R1 sc21_3420 0.0 0.0 25.4
Satt191 sc21_3420 19.4 20.5 10.0
--- Proportion F2 (13:3 – 13 Resistant : 3 Susceptible))
---R2 Gene Satt191 25.8 28.5 2.9
R2 Gene sc21_3420 0.0 0.0 22.1
Satt191 sc21_3420 19.4 20.5 10.0
1 Phenotypic evaluations (RB or TAN lesion): one gene with 3:1 segregation, 2 Indicates one of the two independent genes with 13:3 segregation.
Figure 1. Linkage map of locus Rpp4 of linkage group G, showing the position of the resistance gene of cultivar TMG 803 to Asian soybean rust. Map A: Consensus linkage map of soybean for the region between Satt191 and Satt288 in linkage group G with the distance (in cM) adapted from Song
et al. (2004), Map B: Linkage map presented by Meyer et al. (2009), C Map: Linkage map obtained in this study from the analysis of 116 F2 plants
derived from a cross between TMG 803 x BRS Valiosa RR, D Map: Linkage map presented by Garcia et al. (2008), Map E: Linkage map presented
times greater than the likelihood in the case of no linkage (Schuster and Cruz 2008).
Considering the 3:1 segregation (accepted in this study), the resistance gene of cultivar TMG 803 was mapped at a distance of 0.0cM from marker sc21_3420 and these markers (sc21_3420) were 20.4cM from marker Satt191 (Figure 1). The results indicate that the resistance gene in cultivar TMG 803 is intimately linked to the resistance locus Rpp4, in linkage group G.
Marker Satt612, located at a distance of 3.61cM from Satt288 (Song et al. 2004), showed no polymorphism be-tween the cultivars TMG 803 and BRS Valiosa RR. With
this marker (Satt612), Silva et al. (2008) identified no poly -morphism either between BRS 184 and PI 459025 (carrier of the dominant resistance allele - Rpp4). The microsatellite marker Satt288 was mapped at locus Rpp4 by Garcia et al. (2008), Silva et al. (2008) and Meyer et al. (2009). In this study, this marker was not used to identify polymorphism between the cultivars TMG 803 and BRS Valiosa RR because
the genomic DNA could not be amplified.
The selection efficiency of the resistant plants with
microsatellite markers Satt191 and sc21_3420 was 80.2% and 100.0%, respectively.
The phenotypic segregation of an F2 population with two independent genes and with complete dominance each is 9:3:3:1 (Table 4). Considering that MFMF (plants selected correctly as resistant, based on marker analysis and phenotypic evaluation) = 9; mfmf (plants selected correctly as susceptible, based on markers and phenotypic evalua-tion) = 1; and TP (Total number of studied plants) = 16, the
selection efficiency is 62.5%. The value of 62.5% would
result from the use of microsatellite markers unlinked to the resistance gene. Thus, the SE% limits would be 62.5% for unlinked genes, or microsatellite markers unlinked to the resistance gene, and 100.0% for completely linked genes,
i.e., for microsatellite markers completely linked to the resistance gene. It is worth emphasizing that the value of 62.5% is a result of the F2 segregating population analysis with complete dominance of two independent genes. The marker combination Satt309 + Satt356 in the selection of soybean genotypes resistant to race 14 cyst nematode resulted
in 100% selection efficiency (Silva et al. 2007). By combin
-ing the markers Sat_275 + Sat_280 flank-ing the resistance
gene Rpp5, the resulting SE% was also 100% (Morceli et al. 2008). According to this author, the use of these markers for
marker-assisted selection results in total selection efficiency and is valid, because it identifies homozygous genotypes and the fixation of the resistance gene can be completed in
a few selection cycles.
Microsatellite marker sc21_3420 enabled the correct
identification of the dominant homozygote and heterozygote
genotypes, and is therefore suitable for marker-assisted selection for the development of SR resistant genotypes, from the resistance source TMG 803.
Thus, the resistance to soybean rust in cultivar TMG 803 is controlled by one gene with complete dominance; the resistance gene in cultivar TMG 803 is at the Rpp4 resistance locus in linkage group G; and microsatellite sc21_3420 may be indicated for marker-assisted selection of soybean genotypes, to incorporate Phakopsora pachyrhizi resistance of TMG 803 in other genotypes.
ACKNOWLEDGEMENTS
The authors are indebted to the Foundation for Research Support of the State of Minas Gerais (FAPEMIG) for funding the project (APQ-01987-10; Edital 01/2010 -
De-manda Universal), the National Council for Scientific and
Technological Development (CNPq) and the Coordination of Improvement Higher Education Personnel (CAPES) for a scholarship.
Table 4. Phenotypic segregation of an F2 population with two independent genes and complete dominance
Microsatellite markers
+ (B_) – (bb)
Phenotypically resistant (RB) (A_) 9 3
Phenotypically susceptible (TAN) (aa) 3 1
Herança e mapeamento genético da resistência da cultivar TMG 803 à
Ferrugem Asiática da Soja
Resumo – Objetivou-se analisar a herança e identificar marcadores microssatélites ligados ao gene de resistência da ‘TMG 803’ à Phakopsora pachyrhizi. Foi realizada hibridação entre as cultivares TMG 803 e BRS Valiosa RR para obtenção da progênie F
1 e
população F2. Os genitores ‘TMG 803’ e ‘BRS Valiosa RR’ comportaram-se, respectivamente, como resistentes e suscetíveis e entre
con-REFERENCES
Bromfield KR and Hartwig EE (1980) Resistance to soybean rust and
mode of inheritance. Crop Science 20: 254-255.
Bromfield KR and Melching JS (1982) Sources of specific resistance to
soybean rust. Phytopatology 72: 706.
Chakraborty N, Curley J, Frederick RD, Hyten DL, Nelson RL, Hartman GL and Diers BW (2009) Mapping and confirmation of a new allele at
Rpp1 from soybean PI 594538A conferring RB lesion-type resistance to soybean rust. Crop Science 49: 783-790.
CONAB (2014) A c o m p a n h a m e n t o d a s a f r a b r a s i l e i r a – Grãos, Safra 2013/14, Décimo levantamento (Julho/2014).
Available at <http://www.conab.gov.br/OlalaCMS/uploads/arqu ivos/14_07_09_09_36_57_10_levantamento_de_graos_julho_2014.
pdf> Accessed on July 7, 2014.
Costa MM, Unêda-Trevisoli SH, Pinheiro JB, Kiihl RAS, Calvo ES and
DiMauro AO (2008) Marcadores RAPD para detecção de resistência à ferrugem-asiática-da-soja. Pesquisa Agropecuária Brasileira 43:
1733-1739.
Dhingra OD, Mendonça HL and Macedo DM (2009) Doenças e seu controle. In Sediyama T (ed.) Tecnologias de produção e usos da soja. Editora Mecenas, Londrina, p. 133-155.
Dias WP, Silva JFV, Carneiro GES, Garcia A and Arias CAA (2009)
Nematoide de cisto da soja: biologia e manejo pelo uso da resistência genética. Nematologia Brasileira 33: 1-16.
Doyle JJ and Doyle JL (1987) A rapid DNA isolation method for small
quantities of fresh tissues. Phytochemical Bulletin 19: 11-15. EMBRAPA – Empresa Brasileira de Pesquisa Agropecuária (2008)
Tecnologias de produção de soja – Região Central do Brasil – 2008. Embrapa Soja, Cerrados e Agropecuária Oeste, Londrina, 280p. Ferreira ME and Grattapaglia D (1998) Introducción al uso de
marcadores moleculares en el análisis genético. Embrapa Cenargem, Brasília, 220p.
Fuganti R, Beneventi MA, Silva JFV, Arias CAA, Marin SRR, Binneck E and Nepomuceno AL (2004) Identificação de marcadores moleculares
de microssatélites para seleção de genótipos de soja resistentes a
Meloidogyne javanica. Nematologia Brasileira 28: 125-130.
Garcia A, Calvo ES, Kiihl RAS, Harada A, Hiromoto DM and Vieira LGE (2008) Molecular mapping of soybean rust (Phakopsora pachyrhizi) resistance genes: discovery of a novel locus and alleles. Theoretical and Applied Genetics 117: 545-553.
Hartwig EE (1986) Identification of a fourth major gene conferring
resistance to soybean rust. Crop Science 26: 1135-1136.
Hyten DL, Hartman GL, Nelson RL, Frederick RD, Concibido VC, Narvel
JM and Cregan PB (2007) Map location of the Rpp1 locus that confers
resistance to soybean rust in soybean. Crop Science 47: 837-838.
Lima WF, Prete CEC, Ribeiro AS and Toledo JFF (2012) Resistance
of soybean to Asian rust assessed by grain yield analysis. Summa Phytopathologica 38: 73-78.
McLean RJ and Byth DE (1980) Inheritance of resistance to rust
(Phakopsora pachyrizi) in soybeans. Australian Journal of
Agricultural Research 31: 951-956.
Meyer JDF, Silva DCG, Yang C, Pedley KF, Zhang C, Mortel MV, Hill JH,
Shoemaker RC, Abdelnoor RV, Whitham SA and Graham MA (2009)
Identification and analyses of candidate genes for Rpp4-mediated
resistance to Asian Soybean Rust in soybean. Plant Physiology 150: 295-307.
Michelmore RW, Paran I and Kesseli RV (1991) Identification of markers
linked to disease-resistance genes by bulked segregant analysis: a
rapid method to detect markers in specific genomic regions by using
segregating populations. Proceedings of the National Academy of Sciences 88: 9828-9832.
Morales AMAP, Borém A, Graham MA and Abdelnoor RV (2012) Advances on molecular studies of the interaction soybean - Asian rust. Crop Breeding and Applied Biotechnology 12: 1-7.
Morceli TGS, Trevisoli SHU, Morceli Junior AA, Kiihl RAS, Calvo ES, DiMauro AO and Garcia A (2008) Identificação e validação de
marcadores microssatélites ligados ao gene Rpp5 de resistência à ferrugem-asiática-da-soja. Pesquisa Agropecuária Brasileira 43:
1525-1531.
Pierozzi PHB, Ribeiro AS, Moreira JUV, Laperuta LDC, Rachid BF, Lima WF, Arias CAA, Oliveira MF and Tolero JFF (2008) New soybean
(Glycine max Fabales, Fabaceae) sources of qualitative genetic
resistance to Asian soybean rust caused by Phakopsora pachyrhizi (Uredinales, Phakopsoraceae). Genetics and Molecular Biology 31: 505-511.
Pinheiro TM, Araújo LG, Silva-Lobo VL, Prabhu AS and Filippi MC (2012) Tagging microsatellite marker to a blast resistance gene in the irrigated rice. Crop Breeding and Applied Biotechnology 12:
164-170.
Ray JD, Morel W, Smith JR, Frederick RD and Miles MR (2009) Genetics
and mapping of adult plant rust resistance in soybean PI 587886 and PI 587880A. Theoretical and Applied Genetics 119: 271-280. Schuster I and Cruz CD (2008) Estatística genômica aplicada a
populações derivadas de cruzamentos controlados. Editora UFV, Viçosa, 568p.
Sediyama T, Teixeira RC and Barros HB (2009) Origem, evolução dições de campo. Verificou-se que a resistência da cultivar TMG 803 é governada por um gene com dominância completa, mapeado como o loco de resistência Rpp4, do grupo de ligação G. Dentre os 16 marcadores microssatélites testados, um marcador, sc21_3420, encontrou-se completamente ligado ao gene de resistência (distância de 0,0cM) estando a forma alélica favorável presente na cultivar TMG 803, podendo, portanto, ser útil na seleção assistida em populações segregantes.
e importância econômica. In Sediyama T (ed.) Tecnologias de produção e usos da soja. Editora Mecenas, Londrina, p. 1-5. Silva DCG, Yamanaka N, Brogin RL, Arias CAA, Nepomuceno AL, Di
Mauro AO, Pereira SS, Nogueira LM, Passianoto ALL and Abdelnoor RV (2008) Molecular mapping of two loci that confer resistance to Asian rust in soybean. Theoretical and Applied Genetics 117: 57-63.
Silva MF, Schuster I, Silva JFV, Ferreira A, Barros EG and Moreira MA
(2007) Validation of microsatellite markers for assisted selection of soybean resistance to cyst nematode races 3 and 14. Pesquisa Agropecuária Brasileira 42: 1143-1150.
Teixeira FF, Costa FM, Sábato EO, Leita CEP, Meireless WF, Guimarães
CT and Belicuas NJ (2013) Pré-melhoramento de milho quanto à
resistência a enfezamentos. Pesquisa Agropecuária Brasileira 48:
51-58.
Song QJ, Marek LF, Shoemaker RC, Lark KG, Concibido VC, Delannay X, Specht JE and Cregan PB (2004) A new integrated genetic linkage
map of the soybean. Theoretical and Applied Genetics 109: 122-128.
Viana JMS, Cruz CD and Barros EG (2003) Genética. Editora UFV,
Viçosa, 330p.
Yamanaka N, Lemos LG, Uno M, Akamatsu H, Yamaoka Y, Abdelnoor RV, Lucca e Braccini A and Suenaga K (2013) Resistance to Asian soybean rust in soybean lines with the pyramided three Rpp genes.
Crop Breeding and Applied Biotechnology 13: 75-82.
Yorinori JT, Paiva WM, Frederick RD, Costamilan LM, Bertagnoli PF, Hartman GL, Godoy CV and Nunes JJ (2005) Epidemics of soybean