New strategy for evaluating grain cooking qual
-ity of progenies in dry bean breeding programs
Bruna Line Carvalho
1, Magno AntonioPatto Ramalho
1,
Indalé-cio Cunha Vieira Júnior
1and Ângela de Fátima Barbosa Abreu
2*Abstract: The methodology available for evaluating the cooking quality of dry beans is impractical for assessing a large number of progenies. The aims of this study were to propose a new strategy for evaluating cooking quality of grains and to estimate genetic and phenotypic parameters using a selection index. A total of 256 progenies of the 13thcycle of a recurrent selection program were
evaluated at three locations for yield, grain type, and cooked grains. Samples of grains from each progeny were placing in a cooker and the percentage of cooked grains was assessed. The new strategy for evaluating cooking quality was efficient because it allowed a nine-fold increase in the number of progenies evaluated per unit time in comparison to available methods. The absence of association between grain yield and percentage of cooked grains or grain type indicated that it is possible to select high yielding lines with excellent grain aspect and good cooking properties using a selection index.
Keywords: Phaseolus vulgaris L., plant breeding, selection index, quantitative genetics, recurrent selection.
Crop Breeding and Applied Biotechnology
17: 115-123, 2017
Brazilian Society of Plant Breeding. Printed in Brazil
http://dx.doi.org/10.1590/1984-70332017v17n2a18 ARTICLE
*Corresponding author:
E-mail: [email protected]
Received: 02 February 2016
Accepted: 17 November 2016
1 Federal University of Lavras (UFLA), Depart
-ment of Biology, CP 3037, 37.200-000,Lavras, MG, Brazil
2 Embrapa Rice and Beans/UFLA, Rod.GO-462,
km 12, Zona Rural, CP 179, 75.375-000, Santo Antônio de Goiás, GO,Brazil
INTRODUCTION
Dry bean (Phaseolus vulgaris L.) is considered one of the most important legumes for human consumption (Broughton et al. 2003). The dry bean most consumed in Brazil is the carioca bean, which has beige color and brown stripes on the grain. Consumers prefer medium-sized grains (hundred grain weight of 26 g to 27 g), beige color as light as possible, and grains that do not darken rapidly during storage (Araújo et al. 2012).
Recommendation of new cultivars in Brazil is mainly based on their agronomic traits, such as pest and disease resistance and yield (Carbonell et al. 2014, Lima et al. 2014, Melo et al. 2014, Ramalho et al. 2016). Nevertheless, species for human consumption, like dry bean, must receive the approval of producers and also of consumers. In addition to agronomic traits, breeding programs must consider the desired appearance and the time it takes to cook the grains. Incorporating cooking quality in cultivar evaluation would allow researchers to improve cooking and nutritional quality (Wang and Daun 2005, Ribeiro et al. 2014).
a great deal of time is spent in this process. When there are a large number of progenies to be evaluated in a short time, as is often the case in dry bean breeding programs, this methodology is not viable. It would be important to explore alternative methods efficient in evaluating cooking parameters of grains from dry bean progenies for researchers to obtain data using a process similar to the one adopted by consumers, that is, cooking the grains in a pressure cooker.
A recurrent selection program for improving the yield and appearance of carioca type grains has been conducted in Brazil since 1990 (Ramalho et al. 2005, Silva et al. 2010). Thirteen selection cycles have been completed so far. It is important to verify if there is variability for cooking time, which has not been used as a selection criterion.
In light of the above, the present study was carried out to propose a new methodology to evaluate the cooking quality of dry bean grains that would make selection for this trait viable when a large number of progenies are to be evaluated, and, in addition, to estimate the genetic and phenotypic parameters to verify the possibility of continued success of recurrent selection in the dry bean crop.
MATERIAL AND METHODS
Experiments were carried out at these three locations in the state of Minas Gerais, Brazil: Lavras (lat 21˚ 14’ S, long 45˚ 00’ W, alt 840 m asl), Lambari (lat 21˚ 58’ S, long 45˚ 21’W, alt 896 m asl), and Patos de Minas (lat 18˚ 34’ S, long 46˚ 31’ W, alt 832 m asl). The progenies used originated from the 13th cycle of a recurrent selection (RS) program for improving yield and grain type. Details on the RS program are presented in Silva et al. (2010). A total of 252 S0:2 progenies
and four checks (Carioca, Pérola, BRSMG Talismã, and BRSMG Majestoso cultivars) were evaluated using a 16 x 16 triple lattice design. Plots consisted of two rows of two meters length, with a spacing of 50 cm between rows and 15 seeds/m. Sowing was performed at the beginning of November 2012. Management practices were performed according to recommendations for the crop.
In late summer (February/March2013) the plants were harvested. They were dried in the field and then threshed, and grain yield per plot was calculated. Approximately 30 days after harvest, the progenies were evaluated for grain type. A 60 g sample of each S0:2 progeny was placed in a
transparent plastic bag (4 x 23 cm), and identified. A 1 to 9 scoring scale was used for classifying grains in regard to general appearance, in which1 represents appearance totally unacceptable according to commercial standards, that is, square shape, dark color, and under- or over-size grains (100 grain weight less than 26 g or higher than 27 g) and 9 represents excellent appearance, that is, oval shape, light beige color, and medium-size grains (100 grain weight between 26 and 27 g). The following aspects were considered in this visual evaluation: shape, size, and grain color, especially in regard to early darkening. Classification was performed by three evaluators, independently.
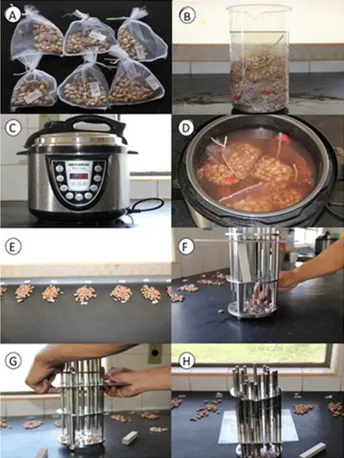
For evaluation of cooking quality, a new methodology was used. Just after evaluation of grain type, 50-grain samples of each progeny without mechanical damage were placed in voile bags with respective identification, and the bags were tied shut (Figure 1A). Two bags per progeny were prepared, that is, two replications.
The bags were placed in distilled water for 90 min (Figure 1B). This time was pre-established in tests conducted by the authors to maximize differentiation among the progenies as quickly as possible. During cooking, the bags were placed at the bottom of an electric pressure cooker with a 3.5 liters capacity to avoid possible variations attributable to positioning. The water level used was ¾ of the volume of the cooker; maintaining the same water in which the bags were soaked. The bags were cooked for 40 min (Figure 1C). After that, the samples were immediately removed from the cooker and the grains were placed on a counter for cooling for 5 min at ambient temperature (Figure 1D and 1E). Sixteen progenies and two controls were included in each cooker, using a 16 x 16 simple lattice design. Evaluation of the percentage of cooked grains was performed with the assistance of the Mattson cooker. Twenty grains per sample, chosen at random, were used (Figure 1F and 1G). The pegs were placed on the grains simultaneously and the number of plungers that immediately perforated the grains completely was recorded (Figure 1H).
Data on yield, percentage of cooked grains, and the grain type score were subjected to analysis of variance by location and across locations. All the effects of the model were considered random, except for the mean, which is a constant, and the location effect. The SAS software (Statistical Analysis System, version 9.3) was used for statistical analysis of the data.
Based on mean square expectations from the analyses of variance per location and joint analysis, variance components
and heritability were estimated by the following expressions: genetic variance in location k: VGk= (MSPk–MSEk)
r ; genetic
variance in mean locations: VG = (MSP–MSPxL)
ra ; variance of the progeny x location interaction: VGxL =
(MSPxL–MSE)
ra ;
phenotypic variance in location k: Vpk = MSPk
r ; phenotypic variance across locations: Vp =
MSP
ra ; heritability of progenies
in location k: h2
k = (MSPMSPk–MSEk) k
; and heritability of progenies across locations: h2 = (MSP–MSPxL)
MSP – in which MSPk is
the mean square of progenies in location k; MSEk is the mean square of error in location k; MSP is the mean square of
progenies across locations; MSPxL is the mean square of the progeny x location interaction; MSE is the mean square of error across locations; r is the number of replications; and a is the number of locations. Confidence intervals of heritability
were estimated by the expression of Knapp et al. (1985). We also estimated Pearson phenotypic correlations among all pair of traits by location and in the mean across locations and gain from selection for each trait separately, using the mean value of the locations, considering a selection intensity of 5% (Steel et al. 1997, Bernardo 2010). Expected gain from selection for grain yield (Y) and the correlated response in the other traits (X) were also estimated via the following
formula presented by Falconer and Mackay (1996): GSX(Y)=dsX(Y).h
2
X,
in which GSX(Y)is the correlated response in trait X (percentage of cooked grains and grain type score) from selection
for grain yield (Y); dsx(y) is obtained from the expression, Msx–Mox, with Msxbeing the mean value of the progenies for
trait X and of progenies that were identified as best for grain yield (Y) and Mox being the overall mean of the progenies
for trait X; and h2
X is the heritability of trait x.
Subsequently, the variables were standardized through the expression:
Zij= Yij–Y.j
Sj
(Steel et al. 1997),
in which Zij is the standardized variable of treatment i for trait j; Yij is the observation of the variable of treatment i for trait j; Y.j is the general mean value of trait j; and sj is the phenotypic standard deviation of the variable for trait j. To
avoid the occurrence of negative values, the constant 3 was added to each observation Zij, and then the sum of the
standardized variables (ΣZ) was obtained for each location. Using the ΣZ, the selection index involving all three traits, for each location, analysis of variance was carried out, considering each location as a replication. Heritability (h2) of ΣZ
RESULTS
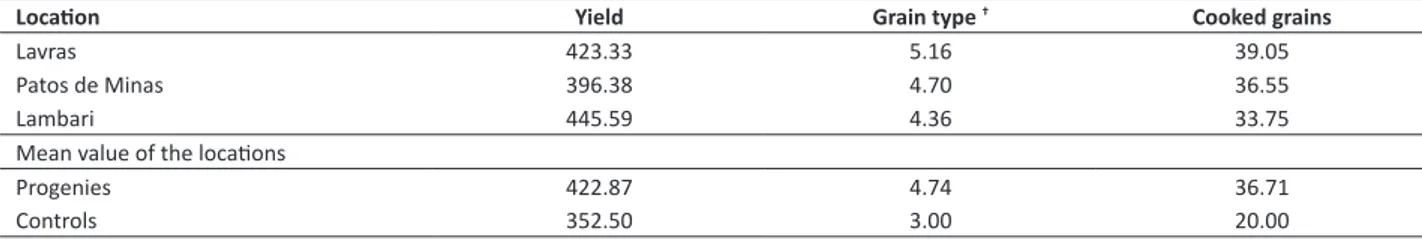
Differences among locations and progenies were evident for the three traits (p˂0.01). The progeny x location interaction was non-significant only for grain yield (p˃0.05). The highest mean grain yield was obtained in Lambari, whereas the highest grain score and percentage of cooked grains were obtained in Lavras (Table1). Although the percentages of cooked grains were relatively low, the differentiation among the progenies was the highest. This is why cooking time did not increase. It should be possible to improve cooking time in breeding programs depending on the quality of grains.
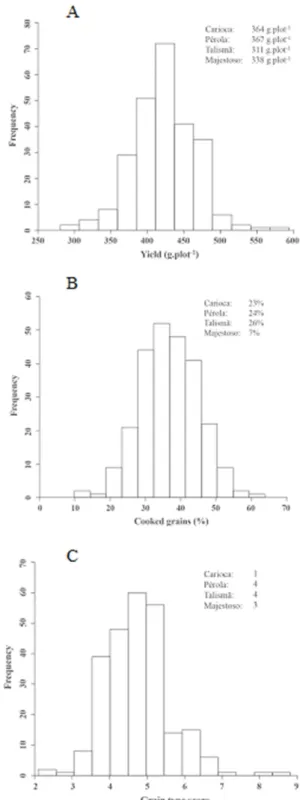
The frequency distributions of the mean values showed variability among the progenies for the three traits (Figure 2). The range of variation for grain yield was from 292 to 580 g plot-1, that is, 67.9%, based on the mean of the three
locations. In the case of percentage of cooked grains and grain score, variation proportional to the mean was even greater, 134.6 and130.4%, respectively.
Variation among the progenies can also be observed from the estimates of the components of variance. In the case of grain yield, as there was overlapping of the confidence intervals, it may be inferred that the estimates of genetic variance among progenies (VG) were similar. Heritability
estimates reinforce this observation. The magnitude of the variance component for the progeny x location interaction (VGxL) was small, only 1.7% of the VG estimate. For this
reason, the h2 estimate for the mean value of the three
locations was of greater magnitude than that obtained for individual locations (Table 2).
The estimates for the grain type scores showed greater magnitude of the estimate of heritability among the mean values of the progenies in each location than that obtained for yield and percentage of cooked grains. The VGxL component, which was 72% greater than VG,
showed a considerable progeny x location interaction for this trait (Table 2). The percentage of cooked grains exhibited heritability estimates by location intermediate to heritability estimates obtained for grain yield and grain type scores. The VGxL estimate was 4.6 times greater than the VG estimate, showing the importance of the progeny
x location interaction for this trait (Table 2).
The estimates of the pair-wise correlations among the three traits for the mean value of the locations were low and were highly similar. The correlation between yield and percentage of cooked grains or grain type score was practically nil (r<0.18). The correlation between percentage of cooked grains and grain type score was significant, but
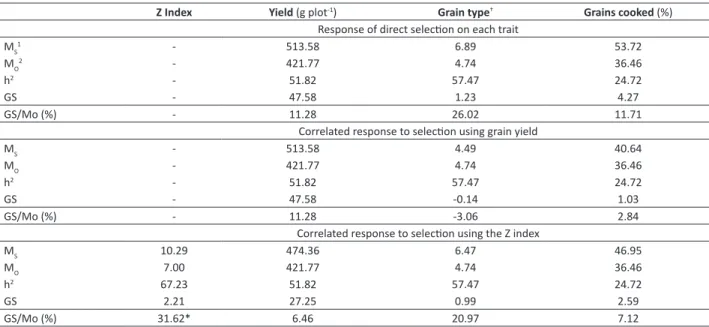
of relatively small magnitude (r=0.41; p≤0.01). The gain expected from selection of the 12 best progenies was greater than 11% for the three traits when considered separately. Although the magnitude of the estimates of phenotypic correlation between yield and grain score or percentage of cooked grains was low (r<0.18), selection carried out based only on grain yield, as occurs in most breeding programs, contributed to reduced expected gain for both grain score and percentage of cooked grains. The sum of the standardized variables (ΣZ) was also adopted as a selection criterion. The gain expected from selection in relation to the mean was substantial, 31.62%. In addition, this selection led to positive gains for the three traits (Table 3).
DISCUSSION
For application of the new methodology, the first question that arises is if it can replace the method most used for evaluation of dry bean cooking quality, the Mattson method. Thus, we performed preliminary tests using lines (Pádua et al. 2013). In these tests, we were able to demonstrate that the pressure cooker method better differentiated the lines
Table 1. Mean value of grain yield (g plot-1), grain type (score from 1 to 9), and percentage of cooked grains for each location and across locations, considering progenies and controls separately
Location Yield Grain type † Cooked grains
Lavras 423.33 5.16 39.05
Patos de Minas 396.38 4.70 36.55
Lambari 445.59 4.36 33.75
Mean value of the locations
Progenies 422.87 4.74 36.71
Controls 352.50 3.00 20.00
† Grain type score: 1, very bad and 9, very good.
Table 2. Estimates of genetic variance (VG), phenotypic variance (VP), progeny x location interaction (VGxL), and heritability (h2) among S0:2 progenies for grain yield (g plot-1), grain type (score from 1 to 9), and percentage of cooked grains. Data obtained per location and across locations
Location Parameters Yield Grain type† Cooked grains
Lavras
V
G 1449.59 1.27 62.09
(918.11 - 2780.30)1 (1.05 - 1.58) (46.35 - 88.29)
VP 4058.71 1.47 104.98
h2 35.72 86.39 59.14
(20.38 - 48.47)2 (83.03 - 88.94) (48.01 - 67.94)
Patos de Minas
V
G 761.22 1.02 60.93
(414.53 - 1923.53) (0.83 - 1.30) (46.87 - 84.07)
VP 2841.06 1.29 94.90
h2 26.79 79.07 64.20
(9.33 - 42.31) (74.64 - 83.47) (53.76 - 72.24)
Lambari
V
G 665.03 1.23 54.95
(294.97 - 4553.80) (1.01 - 1.52) (41.68 - 77.45)
VP 3815.73 1.42 89.80
h2 17.43 86.62 61.20
(-2.27 - 33.81) (82.87 - 88 84) (51.94 - 68.89)
Alllocations
V
G 942.64 0.43 10.63
(677.34 - 1393.73) (0.32 - 0.61) (5.48 - 38.59)
VP 1819.04 0.75 43.02
VGxL 15.98 0.74 59.92
h2 51.82 57.47 24.72
(40.52 - 61.28) (47.49 - 65.82) (7.05 - 39.50)
† Grain type score: 1, very bad and 9, very good. 1 Lower and upper limits of the confidence interval of V
P.2 Lower and upper limits of the confidence interval of h2consider
than the classic Mattson Method, since the lines were discriminated via this new method, but not via the former one. The criterion adopted in the new cooking methodology proposed in this study and the Mattson method is similar, that is, both consider the number of perforated grains using the same device. The difference is that in the Mattson method, the percentage of grains to be perforated is established before conducting the experiment, ranging from 50 to 100%, and the time necessary for achieving this range is recorded. This requires the constant attention of the evaluator until the pre-determined number of pegs perforates the grains. In contrast, the new methodology establishes the cooking time and evaluates the number of perforated grains in each progeny/line. Selection is carried out based on the percentage of cooked grains in a fixed time in an electric pressure cooker. Thus, a pre-established cutoff time may be adopted to achieve the best discrimination among the progenies.
There are some advantages of this method over the Mattson method. The first is in regard to evaluation time. In the Mattson method, it is necessary to soak the grains for 16 hours before performing the test. In the new methodology, soaking the grains is optional. In this study, we established 90 min for soaking, 40 min for cooking, and approximately 30 min for evaluation of 16 samples (quantity placed in each cooker in this study), considering only one operator. To make the process continuous, more samples are placed to soak every 50 min and are afterwards subjected to cooking. Thus, in one workday (eight hours), it is possible to perform nine evaluations, that is, 144 samples. In the conventional method, considering that the time spent on evaluations is an average of 30 min, in eight hours, it would be difficult to evaluate more than 16 samples. Even if the automated system is adopted (Wang and Daun 2005), the amount of time would not change; only the presence/attention of the operator is less necessary. Considering that in a 3.5 liters electric pressure cooker it is possible to evaluate up to 25 samples and not just 16, the advantage is even greater.
In recurrent selection programs, especially for the dry bean crop in which three crop seasons per year can be conducted in Brazil and in other tropical countries, the time between growing seasons is short. Evaluations need to be performed as efficiently as possible and superior progenies need to be identified for the following sowing operation. The cooking quality trait has not been used in these programs as a selection criterion because of the lack of an appropriate methodology to evaluate it. With the use of the methodology proposed in this study, the inclusion of the cooking quality trait as a selection criterion is feasible, because of the possibility of evaluating a relatively large number of samples per day. This is highly desirable in light of the aforementioned consumer demands.
Table 3. Estimate of gain from selection (GS), considering the three traits simultaneously, using grain yield and the Z index
Z Index Yield (g plot-1) Grain type† Grains cooked (%)
Response of direct selection on each trait
MS1 - 513.58 6.89 53.72
MO2 - 421.77 4.74 36.46
h2 - 51.82 57.47 24.72
GS - 47.58 1.23 4.27
GS/Mo (%) - 11.28 26.02 11.71
Correlated response to selection using grain yield
MS - 513.58 4.49 40.64
MO - 421.77 4.74 36.46
h2 - 51.82 57.47 24.72
GS - 47.58 -0.14 1.03
GS/Mo (%) - 11.28 -3.06 2.84
Correlated response to selection using the Z index
MS 10.29 474.36 6.47 46.95
MO 7.00 421.77 4.74 36.46
h2 67.23 51.82 57.47 24.72
GS 2.21 27.25 0.99 2.59
GS/Mo (%) 31.62* 6.46 20.97 7.12
† Grain type score: 1, very bad and 9, very good. 1 Mean of the 5% superior S
0:2 progenies.
2 Mean considering all the S
The precision of the experiments in evaluation of this trait was relatively high in all cases, which can be confirmed by the heritability estimates, always greater than 59% (Table 2), a magnitude similar to magnitudes reported in the literature when the Mattson method was used, and the number of progenies/lines evaluated was much lower (Jacinto-Hernandez et al. 2003, Garcia et al. 2012). The mean percentage of cooked grains varied among the locations, with the lowest percentage in Lambari (Table 1). The experiments were planted in late spring (November) and harvest coincided with intense rainfall, especially in Lavras and Patos de Minas. After harvest, the plants were sheltered until the time of threshing. In Lambari, there was no rain at the time of harvest and the plants remained in the field under high temperature for a longer time. There are reports that the climatic conditions, especially high temperatures, at the time of harvest and during drying affect cooking time (Rodrigues et al. 2005, Arruda et al. 2012).
Another aspect that should be noted relates to evaluation of grain appearance. Araújo et al. (2012) observed that for the early darkening of grain, there was no genotype x evaluation time period interaction, and it was already possible to discriminate the progenies 30 days after harvest. Thus, after this minimum period, a grain sample from each progeny, approximately 60 grams, was placed in a transparent plastic bag. This allowed the evaluators to classify the samples in a comparative manner, involving aspects of color (above all, early darkening of grain), grain size, and grain shape. The strategy worked and the accuracy of the evaluations was high, which can be confirmed by the heritability estimates at each location (Table 2).
For grain scores and percentage of cooked grains, the genotype x location interaction was significantly large. The existence of environmental variation at the time of harvest, mentioned above, probably contributed to this interaction. At any rate, it is evident that the response of the progenies in the grain score and cooking quality traits varied across the three locations. In the case of grain yield, reports of the genotype x location interaction are common in the dry bean crop (Lima et al. 2012, Faria et al. 2013), but non-significant interaction estimates have also been reported (Ramalho et al. 2005).
In the literature, there is no consensus in regard to the importance of dominance deviation for yield in the dry bean crop. There are studies that indicate predominance of additive variance (VA) (Nienhuis and Singh 1988, Corte et al. 2010). Others, however, have indicated that dominance variance (VD) was also present (Gonçalves-Vidigal et al. 2008). In the case of grain score and percentage of cooked grains, no reports were found regarding variances. Nevertheless, even if VD was present, the variance among S0:2 progenies only captures 1/16 of the estimates of VD, and so it may be inferred that
nearly all the genetic variance was attributable to VA. Thus, for practical purposes, the heritability estimates obtained in this case may be considered to be in the narrow sense.
The heritability estimates varied among the traits and were smaller for the percentage of cooked grains than for yield and grain type (Table 2). This probably occurred because of the progeny x location interaction, since in the individual analyses, the heritability estimates for this trait were of medium to high magnitude compared to the estimates reported by Elia (2003) and Ribeiro et al. (2006). For grain yield, the heritability estimate of 51.8% was within the limit reported for the same population in cycle 4 (Ramalho et al. 2005) and cycle 8 (Silva et al. 2010). All are within the confidence interval estimated in each cycle. It can be noted that the genetic variability of the population for grain yield has not decreased as a result of the recurrent selection cycles undertaken for yield and grain type. In the case of percentage of cooked grains and grain type score, as these traits were not included in selection in the previous cycles of the program, there is no information on these aspects. But, even so, for the reasons already presented, it may be inferred that there is still enough variability for continued progress in selection.
There was a positive correlation between percentage of cooked grains and grain type (r=0.41; p≤0.01). This may have arisen from pleiotropy and/or linkage of the genes that control these traits (Falconer and Mackay 1996). However, because of the relatively low magnitude of the correlation, it would not be possible to perform indirect selection for cooking quality based only on grain scores.
We can confirm that it is feasible to implement evaluation of cooking quality in early stages of breeding programs and/or use it in recurrent selection cycles. By doing so, it would be possible to select high yielding lines with better grain quality. In addition, for crops directly consumed by humans, like dry beans, traits associated with appearance and quality have significant importance, and thus it is recommended to apply the ΣZ selection index for selection of the best progenies including all the traits, that is, yield, appearance, and time taken to cook the dry bean. The association between grain yield and percentage of cooked grains or grain type is not complete, in other words, these traits are not controlled by genes with pleiotropic effects, allowing selection of plants with high yield, excellent appearance of grains, and shorter cooking time. It was also shown that recurrent selection was a good strategy for maintaining variability in long-term breeding programs.
ACKNOWLEDGMENTS
The authors are grateful to the Office for Improvement of Personnel in Higher Education (CAPES) and to the National Council for Technological and Scientific Development (CNPq) for financial support.
REFERENCES
Araújo LCA, Ramalho MAP and Abreu AFB (2012) Estimates of genetic parameters of late seed-coat darkening of carioca type dry beans.
Ciência e Agrotecnologia 36: 156-162.
Arruda B, Guidolin AF, Coimbra JLM and Battilana J (2012) Environment is crucial to the cooking time of beans. Ciência e Tecnologia de
Alimentos 32: 573-578.
Bernardo R (2010) Breeding for quantitative traits in plants. Stemma Press, Woodbury, 390p.
Black RG, Singh U and Meares C (1998) Effect of genotype and pretreatment of field peas (Pisium sativum) on their dehulling and cooking quality. Journal of the Science of Food and Agriculture 77:
251-258.
Broughton WJ, Hernández G, Blair M, Beebe S, Gepts P and Vanderleyden J (2003) Beans (Phaseolus spp.): model food legumes. Plant and Soil
252:55-128.
Carbonell SAM, Chiorato AF, Bolonhezi D, Barros VLNP, Borges WLB, Ticelli M, Gallo PB, Finoto EL and Santos NCB (2014) ‘IAC Milênio’ - Common bean cultivar with high grain quality. Crop Breeding and Applied
Biotechnology 14:273-276.
Corte AD, Moda-Cirino V,Arias CAA, Toledo JFF and Destro D (2010) Genetic analysis of seed morphological traits and its correlations with grain yield in common bean. Brazilian Archives of Biology and
Technology 53:27-34.
Elia FM (2003) Heritability of cooking time and water absorption in dry bean (Phaseolus vulgaris L.) using a North Carolina design II mating scheme. Tanzania Journal of Science 29: 25-34.
Falconer DS and Mackay TFC (1996) Introduction to quantitative genetics. Pearson, Malaysia, 464p.
Faria LC, Melo PGS, Pereira HS, Peloso MJD, Brás AJBP, Moreira JAA, Carvalho HWL and Melo LC (2013) Genetic progress during 22 years of improvement of carioca-type common bean in Brazil. Field Crops
Research 142:68-74.
Garcia RAV, Rangel PN, Bassinello PZ, Brondani C, Melo LC, Sibov ST and Vianello-Brondani RP (2012) QTL mapping for the cooking time of common beans. Euphytica 186:779-792.
Gonçalves-Vidigal MC, Mora F, Bignotto TS, Munhoz REF and Souza LD (2008) Heritability of quantitative traits in segregating common bean families using a Bayesian approach. Euphytica 164:551-560.
Jacinto-Hernandez C, Azpiroz-Rivero S, Acosta-Gallegos JA, Hernandez-Sanchez H and Bernal-Lugo I (2003) Genetic analysis and random amplified polymorphic DNA markers associated with cooking time in common bean. Crop Science 43:329-332.
Knapp SJ, Stroup WW and Ross WM (1985) Exact confidence intervals for heritability on a progeny mean basis. Crop Science 25:192-194. Lima LK, Ramalho MAP, Abreu AFB, Toledo FHRB and Ferreira RADC
(2014) Implications of predictable and unpredictable environmental factors in common bean VCU trials in Minas Gerais. Crop Breeding
and Applied Biotechnology 14:146-153.
Lima LK, Ramalho MAP and Abreu AFB (2012) Implications of the progeny x environment interaction in selection index involving characteristics of the common bean. Genetics and Molecular Research 11:4093-4099.
Melo LC, Abreu AFB, Ramalho MAP, Carneiro JES, Paula Júnior TJ, Del Peloso MJ, Pereira HS, Faria LC, Pereira Filho IA, Moreira JAA, Martins M, Vieira RF, Martins FAD, Coelho MAO, Costa JGC, Wendland A, Santos JB, Diaz JLC, Carneiro PCS, Del Giúdice MP and Faria JC (2014)
BRSMG Realce: Common bean cultivar with striped grains for the
state of Minas Gerais. Crop Breeding and Applied Biotechnology
14:61-64.
Nienhuis J and Singh SP (1988) Genetics of seed yield and its components in common bean (Phaseolus vulgaris L.) of Middle-American origin, I.General Combining Ability. Plant Breeding 101:143-154.
Pádua JMV, Ramalho MAP and Abreu AFB (2013) New alternative for assessing cooking time of common bean progenies. Annual Report of Bean Improvement Cooperative 56: 17-18.
Institute of Food Science and Technology 20:9-14.
Ramalho MAP, Abreu AFB, Carneiro JES, Melo LC, Paula Júnior TJ, Pereira HS, Del Peloso MJ, Pereira Filho IA, Martins M, Del Giúdice MP and Vieira RF (2016) BRSMG Uai: common bean cultivar with carioca grain type and upright plant architecture. Crop Breeding and Applied
Biotechnology 16:261-264.
Ramalho MAP, Abreu AFB and Santos JB (2005) Genetic progress after four cycles of recurrent selection for yield and grain traits in common bean. Euphytica 144:23-29.
Ribeiro ND, Rodrigues JA, Prigol M, Nogueira CW, Storck L and Gruhn EM (2014) Evaluation of special grains bean lines for grain yield, cooking time and mineral concentrations. Crop Breeding and Applied
Biotechnology 14:15-22.
Ribeiro SRRP, Ramalho MAP and Abreu AFB (2006) Maternal effect
associated to cooking quality of common bean. Crop Breeding and
Applied Biotechnology 6:304-310.
Rodrigues JDA, Ribeiro ND, Cargnelutti Filho A, Tretin M and Londero PMG (2005) Cooking quality of common bean grain obtained in differents sowing periods. Bragantia 64:369-376.
Silva GS, Ramalho MAP, Abreu AFB and Nunes JAR (2010) Estimation of genetic progress after eight cycles of recurrent selection for common bean grain yield. Crop Breeding and Applied Biotechnology 10:
351-356.
Steel RGD, Torrie JH and Dickey DA (1997) Principles and procedures of statistics: a biometrical approach. McGraw-Hill, New York, 666p. Wang N and Daun JK (2005) Determination of cooking times of pulses
using an automated Mattson cooker apparatus. Journal of the