Monitoring of physiological and blood parameters during perinatal and neonatal period in calves
[Monitoramento de parâmetros fisiológicos e sanguíneos de bezerros durante os períodos perinatal e neonatal]
G. Piccione1, S. Casella1,P. Pennisi2, C. Giannetto1, A. Costa1, G. Caola1
1
Facoltà di Medicina Veterinaria - Università degli Studi di Messina 98168 – Messina, Italy
2
Facoltà di Agraria. Università degli Studi di Catania – Catania, Italy
ABSTRACT
Rectal temperature, heart and respiratory rates, and the course of some blood parameters were monitored in calves during perinatal and neonatal periods. The study was carried out on eight Limousine calves. From all subjects, rectal temperature, heart rate, and respiratory rate were measured. Blood samples were taken at the same hour (9am) from the external jugular vein, and then centrifuged and stored until analyses. By means of an UV spectrophotometer, the following blood parameters were assessed for each subject: total protein, total cholesterol, triglycerides, glucose, non-esterified fatty acids (NEFA), urea, creatinine, cholinesterase, lactate dehydrogenase (LDH), hydroxybutirate, glutamate pyruvate transaminases (GPT), glutamate oxalacetate transaminases (GOT), direct and total bilirubin, magnesium, iron, potassium, phosphorus, chloride and sodium. The results showed a significant effect of days of life (P<0.05) only on total cholesterol, creatinine and GOT during the first week of life and a significant effect of days of life on rectal temperature, heart rate, respiratory rate, total cholesterol, NEFA, creatinina, and GOT during the first month of life. A correlation among individual values for postnatal age (days of life) and heart rate in calves during the first month of life was observed. In conclusion, modifications of studied parameters could be attributed to functional development of calves in neonatal period and contribute to the knowledge of adaptation processes in calf during the first week and the first month of life resulting useful for the diagnosis and treatment of any neonatal diseases.
Keywords: calf, neonatal period, perinatal period, blood parameters, physiological parameters
RESUMO
Realizou-se o monitoramento da temperatura retal das frequências cardíaca e respiratória e de alguns parâmetros sanguíneos em oito bezerros da raça Limousine, durante o período perinatal e neonatal. Paralelamente às mensurações da temperatura retal e das frequências cardíaca e respiratória (9h), foram pesquisados, por meio de espectrofotômetro de UV, proteína total, colesterol total, triglicérides, glicose, ácidos graxos não esterificados (NEFA), ureia, creatinina, colinesterose, lactato desidrogenase (LDH), hidroxibutirato, glutamato piruvato transaminases (GOT), direta e total bilirrubina, magnésio, fósforo, cloretos e sódio. Os resultados mostraram efeito significativo dos dias de vida (P<0,05) somente sobre o colesterol total, creatinina e GOT, durante a primeira semana e um significante efeito de dias de vida sobre a temperatura retal, as frequências cardíaca e respiratória, colesterol total, NEFA, creatina e GOT durante o primeiro mês de vida. Observou-se correlação entre os valores individuais para dias de vida e frequência cardíaca durante o primeiro mês de vida. Conclui-se que as modificações desses parâmetros podem ser atribuídas ao desenvolvimento dos bezerros no período neonatal, contribuindo para o conhecimento do processo de adaptação, em bezerros, durante a primeira semana e o primeiro mês de vida.
Palavras-chave: bezerro, período neonatal, período perinatal, parâmetros sanguíneos
INTRODUCTION
The neonatal period represents a critical stage in development of physiological functions. During this phase, known as the adaptive period, the changes necessary to adapt to the extra-uterine life take place in newborn animals. Adaptation in some body systems is slower than in others and there are also some variations between species (Piccione et al., 2007a; Piccione et al., 2008). Newborns are in metabolically unstable conditions, which make these subjects particularly sensitive to perinatal diseases resulting in high mortality (Dwyer, 2008).
Diseases of the newborn and neonatal mortality are a major cause of economic loss in livestock production (Piccione et al., 2008; Grøndhal et al., 2007). Breed, gender, and litter size on influence birth-weight that is an important factor for the growth of healthy and viable newborns (Buschmann et al., 1993). The effect of calfhood diseases on growth of female dairy calves during the first three months of life was studied and the importance of prevention of some chronic pathologies showed (Virtala et al., 1996). The influence of age on blood biochemical and hematological profiles (Brun-Hansen et al., 2006; Ježek et al., 2006; Knowles et al., 2006) and blood metabolites and body temperature of single calves at birth and from one to four days of age in a dairy herd (Diesch et al., 2004ab) were studied and quality of development and adaptation reactions of dairy calves at the specific age periods in early life were demonstrated (Steinhardt and Thielscher, 1999).
Some authors studied acid-base balance modifications in lambs and goat kids, and clotting profiles in newborn kids during the first week of life in order to provide useful information for the diagnosis and treatment of some neonatal diseases (Piccione et al., 2006; Piccione et al., 2008). Physiological parameters during the first 30 days postpartum were studied in lambs to make a contribution to the knowledge of neonatal physiology (Piccione et al., 2007a). Age related changes and comparison with blood composition in adults were observed in order to define reference values for the different ages (Mohri et al., 2007).
Given the importance of having physiological reference values as indicators of dynamic
homeostatic processes taking place during neonatal period, the aim of this study was to monitor rectal temperature, heart and respiratory rates, and to evaluate the course of some blood parameters (total protein, total cholesterol, triglycerides, glucose, non-esterified fatty acids (NEFA), urea, creatinine, cholinesterase, lactate dehydrogenase (LDH), hydroxybutirate, glutamate pyruvate transaminases (GPT), glutamate oxalacetate transaminases (GOT), direct and total bilirubin, magnesium, iron, potassium, phosphorus, chloride, and sodium) during the first week and the first month of life in eight Limousine calves, in order to obtain useful information for neonatal care.
MATERIALS AND METHODS
This study was carried out during spring in Sicily, Italy, on eight clinically healthy and full-term-born Limousine calves (four males: mean body weight 43.75±6.29kg; four females: mean body weight 40.00±4.08kg) which were monitored for 30 days. Calves were kept in a sheltered outdoor pen with their mothers and were fed only with maternal milk. For each calf, physiological parameters were measured and blood samples were collected at the same hour (9am).
The studied parameters were assessed on all animals in the following experimental conditions: from the day after the birth, daily for one week and every five days for 30 days.Rectal temperature was recorded using a digital thermometer (HI92704, Hanna Instruments - Bedfordshire, UK) with the probe being inserted to a depth of 9cm, heart rate was measured by means of an oscillometric apparatus( Argus TM-7, Schiller - Barr, Switzerland), and respiratory rate was visually recorded using a stopwatch over a 5min period.
triglycerides, NEFA, urea, creatinine, cholinesterase, LDH, hydroxybutirate, GPT, GOT, direct and total bilirubine, magnesium, iron, potassium, phosphorus, chloride, and sodium.
For each parameter, Bartlett’s test was used to test if all samples had equal variance. All results were expressed as mean±standard error of the means (SEM). On all data, normally distributed (P<0.05, Kolmogorov-Smirnov test), one way analysis of variance (ANOVA) was used to evaluate the effect of days of life during the first week and the first month of life. If ANOVA showed an acceptable level of significance (P<0.05), Bonferroni’s test was applied for post hoc comparison. Regression of the parameter studied on postnatal age (days of life), with 95% confidence intervals and the correlation
coefficient (r), was determined. Data were analyzed using the software Statistica 5.5 (Statsoft Inc., USA).
RESULTS
Tables 1 and 2 show the mean values of physiological parameters considered together with their standard errors (SEM) and with the statistical significances obtained during the first week and the first month of life in eight calves.
Tables 3-6 show the mean values of blood parameters considered together with their SEM and with the statistical significances obtained during the first week and the first month of life of calves.
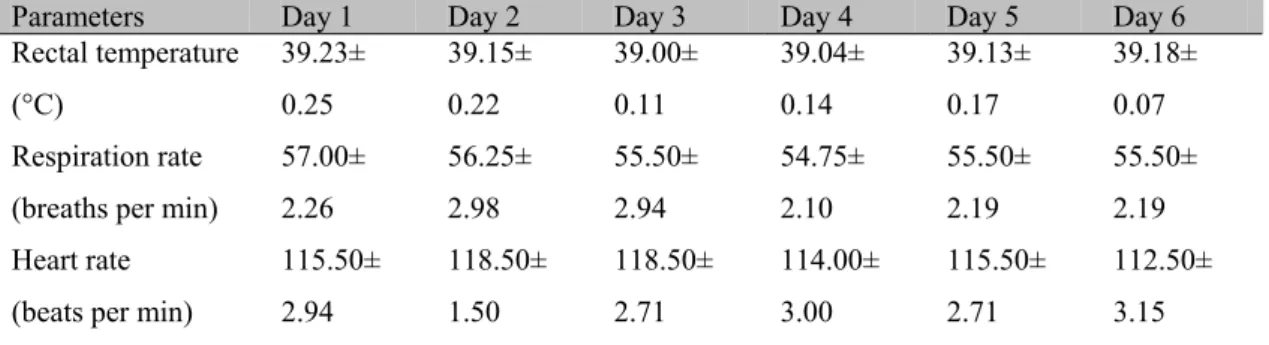
Table 1. Average values (± standard errors) of physiological parameters, expressed in their conventional units of measurement, of eight Limousine calves during the first week of life
Parameters Day 1 Day 2 Day 3 Day 4 Day 5 Day 6
Rectal temperature
(°C)
39.23±
0.25
39.15±
0.22
39.00±
0.11
39.04±
0.14
39.13±
0.17
39.18±
0.07
Respiration rate
(breaths per min)
57.00±
2.26
56.25±
2.98
55.50±
2.94
54.75±
2.10
55.50±
2.19
55.50±
2.19
Heart rate
(beats per min)
115.50±
2.94
118.50±
1.50
118.50±
2.71
114.00±
3.00
115.50±
2.71
112.50±
3.15
Table 2. Average values (± standard errors) of physiological parameters, expressed in their conventional units of measurement, with the statistical significances observed in eight Limousine calves during the first month of life
Parameters Day 1 Day 5 Day 10 Day 15 Day 20 Day 25 Day 30
Rectal
temperature (°C)
39.23±
0.25
39.13±
0.17
39.09±
0.10
39.03±
0.08
38.65±
0.10
38.64±
0.05
38.14±
0.37*●
Respiration rate
(breaths per min)
57.00±
2.26
55.50±
2.19
54.00±
1.96
56.25±
1.09
54.00±
1.13
52.50±
1.50
47.25±
1.35*∆
Heart rate
(beats per min)
115.50±
2.94
115.50±
2.71
108.80±
3.29
106.50±
2.94
105.80±
2.25
102.80±
0.75*
102.00±
0.75*
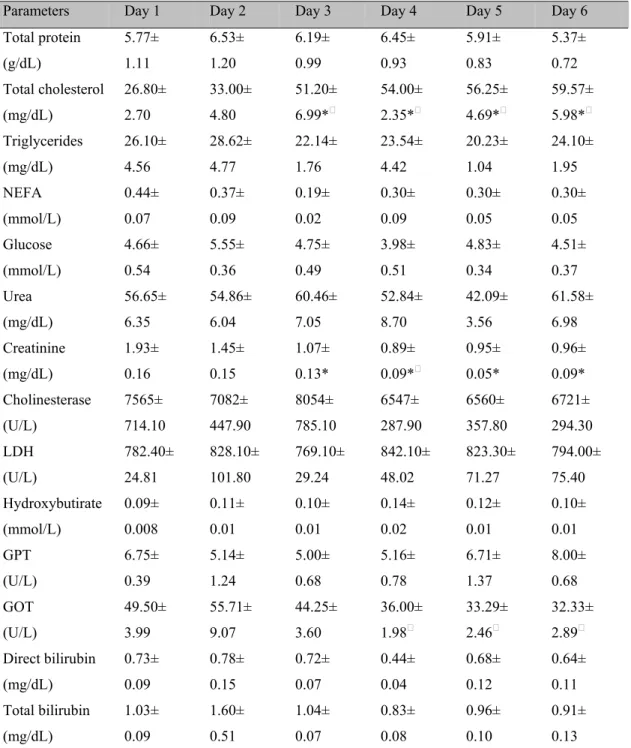
Table 3.Average values (± standard errors) of blood parameters, expressed in their conventional units of measurement, with the statistical significances observed in eight Limousine calves during the first week of life
Parameters Day 1 Day 2 Day 3 Day 4 Day 5 Day 6
Total protein (g/dL) 5.77± 1.11 6.53± 1.20 6.19± 0.99 6.45± 0.93 5.91± 0.83 5.37± 0.72 Total cholesterol (mg/dL) 26.80± 2.70 33.00± 4.80 51.20± 6.99* 54.00± 2.35* 56.25± 4.69* 59.57± 5.98* Triglycerides (mg/dL) 26.10± 4.56 28.62± 4.77 22.14± 1.76 23.54± 4.42 20.23± 1.04 24.10± 1.95 NEFA (mmol/L) 0.44± 0.07 0.37± 0.09 0.19± 0.02 0.30± 0.09 0.30± 0.05 0.30± 0.05 Glucose (mmol/L) 4.66± 0.54 5.55± 0.36 4.75± 0.49 3.98± 0.51 4.83± 0.34 4.51± 0.37 Urea (mg/dL) 56.65± 6.35 54.86± 6.04 60.46± 7.05 52.84± 8.70 42.09± 3.56 61.58± 6.98 Creatinine (mg/dL) 1.93± 0.16 1.45± 0.15 1.07± 0.13* 0.89± 0.09* 0.95± 0.05* 0.96± 0.09* Cholinesterase (U/L) 7565± 714.10 7082± 447.90 8054± 785.10 6547± 287.90 6560± 357.80 6721± 294.30 LDH (U/L) 782.40± 24.81 828.10± 101.80 769.10± 29.24 842.10± 48.02 823.30± 71.27 794.00± 75.40 Hydroxybutirate (mmol/L) 0.09± 0.008 0.11± 0.01 0.10± 0.01 0.14± 0.02 0.12± 0.01 0.10± 0.01 GPT (U/L) 6.75± 0.39 5.14± 1.24 5.00± 0.68 5.16± 0.78 6.71± 1.37 8.00± 0.68 GOT (U/L) 49.50± 3.99 55.71± 9.07 44.25± 3.60 36.00± 1.98 33.29± 2.46 32.33± 2.89 Direct bilirubin (mg/dL) 0.73± 0.09 0.78± 0.15 0.72± 0.07 0.44± 0.04 0.68± 0.12 0.64± 0.11 Total bilirubin (mg/dL) 1.03± 0.09 1.60± 0.51 1.04± 0.07 0.83± 0.08 0.96± 0.10 0.91± 0.13
NEFA: non-esterified fatty acids; LDH: loctate de hydrogenase; GPT: glutamate pyruvate transaminases; GOT: glutamate oxalacetate transaminases.
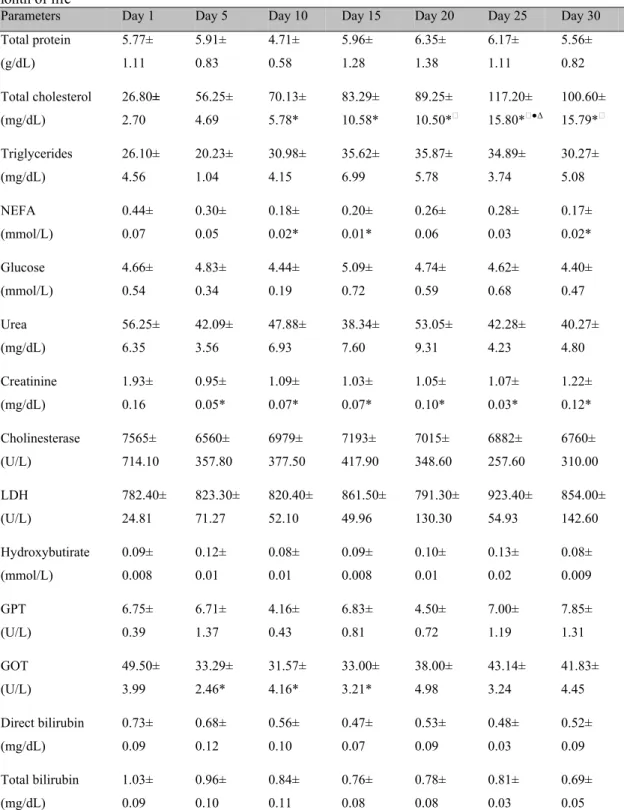
Table 4. Average values (± standard errors) of blood parameters studied, expressed in their conventional units of measurement, with the statistical significances observed in eight Limousine calves during the first month of life
Parameters Day 1 Day 5 Day 10 Day 15 Day 20 Day 25 Day 30
Total protein (g/dL) 5.77± 1.11 5.91± 0.83 4.71± 0.58 5.96± 1.28 6.35± 1.38 6.17± 1.11 5.56± 0.82 Total cholesterol (mg/dL) 26.80± 2.70 56.25± 4.69 70.13± 5.78* 83.29± 10.58* 89.25± 10.50* 117.20±
15.80*●∆
100.60± 15.79* Triglycerides (mg/dL) 26.10± 4.56 20.23± 1.04 30.98± 4.15 35.62± 6.99 35.87± 5.78 34.89± 3.74 30.27± 5.08 NEFA (mmol/L) 0.44± 0.07 0.30± 0.05 0.18± 0.02* 0.20± 0.01* 0.26± 0.06 0.28± 0.03 0.17± 0.02* Glucose (mmol/L) 4.66± 0.54 4.83± 0.34 4.44± 0.19 5.09± 0.72 4.74± 0.59 4.62± 0.68 4.40± 0.47 Urea (mg/dL) 56.25± 6.35 42.09± 3.56 47.88± 6.93 38.34± 7.60 53.05± 9.31 42.28± 4.23 40.27± 4.80 Creatinine (mg/dL) 1.93± 0.16 0.95± 0.05* 1.09± 0.07* 1.03± 0.07* 1.05± 0.10* 1.07± 0.03* 1.22± 0.12* Cholinesterase (U/L) 7565± 714.10 6560± 357.80 6979± 377.50 7193± 417.90 7015± 348.60 6882± 257.60 6760± 310.00 LDH (U/L) 782.40± 24.81 823.30± 71.27 820.40± 52.10 861.50± 49.96 791.30± 130.30 923.40± 54.93 854.00± 142.60 Hydroxybutirate (mmol/L) 0.09± 0.008 0.12± 0.01 0.08± 0.01 0.09± 0.008 0.10± 0.01 0.13± 0.02 0.08± 0.009 GPT (U/L) 6.75± 0.39 6.71± 1.37 4.16± 0.43 6.83± 0.81 4.50± 0.72 7.00± 1.19 7.85± 1.31 GOT (U/L) 49.50± 3.99 33.29± 2.46* 31.57± 4.16* 33.00± 3.21* 38.00± 4.98 43.14± 3.24 41.83± 4.45 Direct bilirubin (mg/dL) 0.73± 0.09 0.68± 0.12 0.56± 0.10 0.47± 0.07 0.53± 0.09 0.48± 0.03 0.52± 0.09 Total bilirubin (mg/dL) 1.03± 0.09 0.96± 0.10 0.84± 0.11 0.76± 0.08 0.78± 0.08 0.81± 0.03 0.69± 0.05
NEFA: non-esterified fatty acids; LDH: loctate de hydrogenase; GPT: glutamate pyruvate transaminases; GOT: glutamate oxalacetate transaminases.
Table 5. Average values (± standard errors) of electrolytes, expressed in their conventional units of measurement, in eight Limousine calves during the first week of life
Parameters Day 1 Day 2 Day 3 Day 4 Day 5 Day 6
Magnesium (mmol/L) 0.74± 0.01 0.72± 0.01 0.73± 0.01 0.76± 0.01 0.76± 0.01 0.75± 0.01 Iron (µmol/L) 26.62± 1.60 27.93± 2.19 26.96± 2.45 26.96± 2.46 32.32± 3.67 34.14± 4.31 Potassium (mmol/L) 7.51± 0.56 9.71± 1.52 8.51± 0.68 9.10± 0.49 9.70± 1.28 7.68± 0.60 Phosphorus (mmol/L) 2.03± 0.28 2.66± 0.34 3.22± 0.44 3.42± 0.52 3.47± 0.44 3.36± 0.42 Chloride (mmol/L) 93.00± 2.62 97.25± 3.33 96.00± 3.72 95.25± 3.78 94.88± 4.58 96.38± 4.69 Sodium (mmol/L) 132.00± 2.48 135.10± 3.58 133.50± 4.19 134.50± 4.13 134.50± 5.40 135.90± 5.31
Table 6. Average values (± standard errors) electrolytes, expressed in their conventional units of measurement, in eight Limousine calves during the first month of life
Parameters Day 1 Day 5 Day 10 Day 15 Day 20 Day 25 Day 30
Magnesium (mmol/L) 0.74± 0.01 0.76± 0.01 0.74± 0.01 0.74± 0.01 0.72± 0.01 0.73± 0.01 0.74± 0.01 Iron (µmol/L) 26.62± 1.60 32.32± 3.67 34.64± 3.71 36.67± 4.17 34.18± 2.55 29.94± 2.02 29.68± 1.78 Potassium (mmol/L) 7.51± 1.58 9.70± 1.28 8.12± 0.13 7.63± 0.33 9.36± 1.89 7.35± 0.57 8.74± 0.57 Phosphorus (mmol/L) 2.03± 0.28 3.47± 0.44 3.20± 0.22 3.45± 0.35 3.30± 0.60 3.66± 0.45 3.90± 0.38 Chloride (mmol/L) 93.00± 2.62 94.88± 4.58 92.25± 3.60 96.75± 3.11 91.88± 4.09 92.60± 4.30 93.88± 4.21 Sodium (mmol/L) 132.00± 2.48 164.50± 5.40 132.00± 4.04 136.10± 3.37 131.50± 4.26 135.50± 4.56 133.00± 4.56
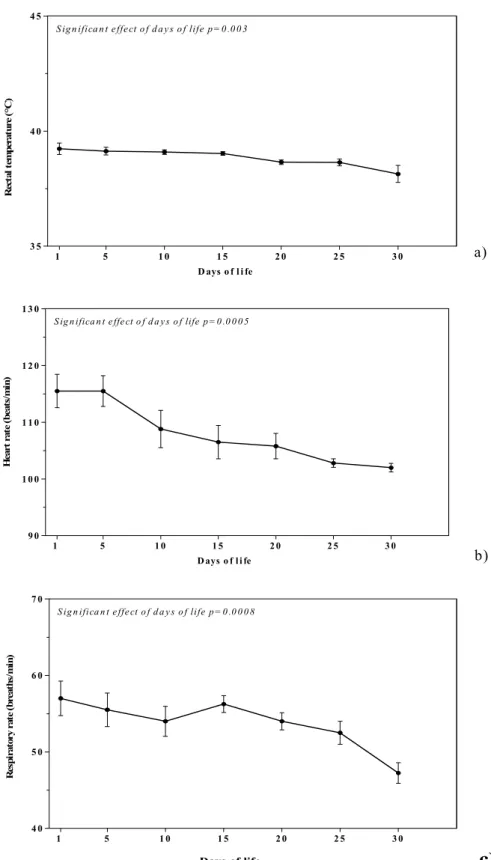
Figure 1 shows the patterns (Mean±SEM) of rectal temperature, respiratory rate, and heart rate, expressed in their conventional unit of measurement, during the first month of life in eight
1 5 1 0 1 5 2 0 2 5 3 0
3 5 4 0 4 5
D ays o f l i fe
R
ect
al
t
em
p
erat
u
re
(°
C
)
S ig n ifica n t e ffe ct o f d a y s o f life p = 0 .0 0 3
1 5 1 0 1 5 2 0 2 5 3 0
9 0 1 0 0 1 1 0 1 2 0 1 3 0
D ays o f l i fe
H
ea
rt r
a
te
(b
ea
ts/m
in
)
S ig n ifica n t e ffe ct o f d a y s o f life p = 0 .0 0 0 5
1 5 1 0 1 5 2 0 2 5 3 0
4 0 5 0 6 0 7 0
R
es
p
ir
at
ory r
a
te
(
b
reat
h
s/
m
in
)
S ig n ifica n t e ffe ct o f d a y s o f life p = 0 .0 0 0 8
a)
b)
Days of life
c)
1 2 3 4 5 6 0
25 50 75 100 125 150
Days of life
T
o
ta
l ch
o
les
te
ro
l (
m
g
/d
l)
Significant effect of days of life p<0.0001
1 5 10 15 20 25 30
0 25 50 75 100 125 150
Days of life
T
o
ta
l c
h
o
le
ste
ro
l (
m
g
/d
l)
Significant effect of days of life p<0.0001
1 2 3 4 5 6
0 1 2 3
Days of life
C
re
a
ti
ni
ne
(
m
g/
dl
)
Significant effect of days of life p<0.0001
1 5 10 15 20 25 30
0 1 2 3
Days of life
C
re
a
ti
ni
ne
(
m
g/
dl
)
Significant effect of days of life p<0.0001
1 2 3 4 5 6
0 25 50 75 100
Days of life
GOT
(
U
/l
)
Significant effect of days of life p=0.002
1 5 10 15 20 25 30
0 25 50 75 100
Days of life
GOT
(
U
/l
)
Significant effect of days of life p=0.0005
First week of life First month of life
a)
b)
c)
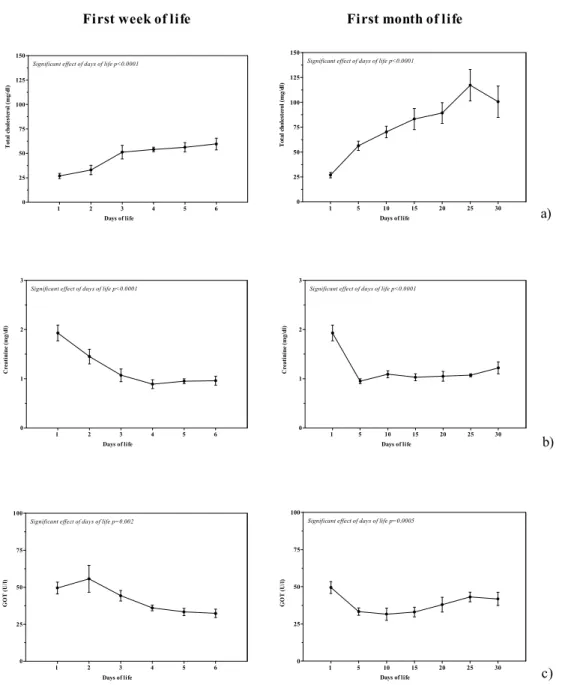
Figure 2.Means (±SEM) of total cholesterol (a), creatinine (b), and GOT (c) in eight calves during the first week of life and during the first month of life.
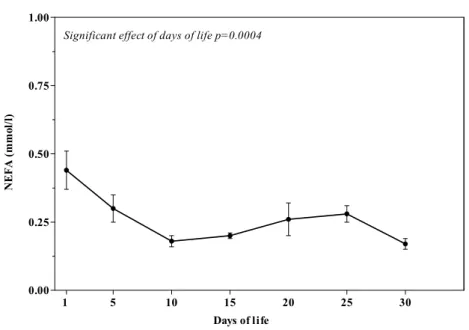
Figure 3 shows the patterns (Mean±SEM) of NEFA, expressed in their conventional unit of measurement, during the first month of life in eight calves.
ANOVA showed a significant effect of days of life
only on total cholesterol (F(5,35)= 17.06; P<0.0001),
creatinine (F(5,35)=11.41; P<0.0001), and GOT
(F(5,35)= 4.68; P=0.002) during the first week of life;
and a significant effect of days of life on rectal
temperature (F(6,42)= 3.92; P=0.003), heart rate
(F(6,42)= 5.16; P=0.0005), respiratory rate (F(6,42)=
4.80; P=0.0008), total cholesterol (F(6,42)= 19.40;
P<0.0001), NEFA (F(6,42)= 5.30; P=0.0004),
creatinine (F(6,42)= 11.99; P<0.0001), and GOT
(F(6,42)= 5.06; P=0.0005) during the first month of
1 5 10 15 20 25 30 0.00
0.25 0.50 0.75 1.00
Days of life
N
E
F
A
(
mmo
l/l)
Significant effect of days of life p=0.0004
Figure 3. Mean (±SEM) of non-esterified fatty acids (NEFA) in eight calves during the first month of life.
The application of a linear regression model (y=a+bx) showed a correlation (r=-0.90) among individual values for postnatal age (days of life) and heart rate in calves duringthe first month of
life. Figure 4 shows the regression of heart rate (beats/min) on postnatal days of life, with 95% confidence interval and the correlation coefficient (r).
0 5 10 15 20 25 30
90 100 110 120 130
r=-0.90
Days of life
H
ea
rt R
a
te
(b
ea
ts
/m
in
)
DISCUSSION
The results did not show a significant effect of days of life on the studied physiological parameters (rectal temperature, heart rate, and respiratory rate) during the first week of life. However, a significant effect of days of life on rectal temperature, heart rate, and respiratory rate was found in the first month of life. At birth, the ability to maintain heat homeostasis is particularly limited and it is based on the degree of maturity of the organism at the time of birth. Rectal temperature was between 39.00 and 39.23°C for the first days of life, with no significant differences recorded.
These temperatures show an immaturity of thermoregulatory system at birth; the lack of significant differences for this parameter confirms the performance in the newborn regarding the thermal homeostasis mechanisms only during the first month of life and not during the first week of life since the homeostatic regulation of body temperature is often incipient at birth and matures during the course of development (Piccione et al., 2002). In foal, in particular, the efficiency of these thermal homeostasis mechanisms was confirmed by the existence of a rhythmic pattern of body temperature that emerges within the first 10 days of birth, and matures fully during the first month of life (Piccione et al., 2007b).
The modifications recorded in the present study for respiratory rate during the first month of life, which displays homeostatic physiological variability during the neonatal period, are consistent with previous studies that pointed out variations in this parameter during the first four weeks postpartum (Davey et al., 1998). This confirms the irregularity of respiratory activity during the neonatal period; in fact, it is known that there is a physiological respiratory immature inj newborns due to an incomplete anatomical-functional development (Piccione et al., 2007b).
The cardiovascular system, as the respiratory system, during the neonatal period undergoes continuous morpho-functional modifications, leading the organism to adapt to the extra-uterine environment with a well defined homeostatic ability (Piccione et al., 2007a). The heart is forced to pump the blood through a vascular system that presents a strong elastic, peripheral
resistance and, since the organism of the newborn is not yet able to vary cardiac output, it compensates the limited systolic volume by increasing the heart rate. This may explain the significant effect of days of life during the first month on the significant decrease (P<0.0005) in heart rate observed in calves life (Piccione et al., 2007b).
The lack of significant differences for the physiological parameters studied in the first week of life demonstrate that thermoregulatory mechanism and homeostasis in the newborn calf are not fully functional during the first days of life and develop only later. Previous research conducted on other species showed, however, that the efficiency of these mechanisms is present from the earliest days of life, with full vesting in the month (Piccione et al., 2002; Piccione et al., 2006).
The results showed a significant effect of days of life on total cholesterol, creatinina, and GOT, both during the first week of life and during the first month of life. Although in the first six months of life a decrease of total cholesterol in calf was recorded by other researchers (Shope, 1928; Carcangiu et al., 2002). In the present study, a gradual increase of this parameter during the first-month of life was recorded. All animals bled at that time were fed colostrums, which is quite rich in cholesterol, especially the first colostrum (Carcangiu et al., 2002), and could easily account for the almost immediate onset of the rise. Instead, a decrease of creatinine concentration from birth up to the first week and the first month of life were recorded, indicating how neonates are adapting to the changes and to the maintenance of homeostasis (Kurz and Willett, 1991; Steinhardt and Thielscher, 1999).
According to other study (Birģele and Ilgaža, 2003), GOT values decrease in the first neonatal period (first week of life) and increase in the second period (first month of life); this increase of the enzymatic activity of the liver coincides with the period when morphofunctional condition of the liver of newborn calf is changing. This was also proved by the onset of the cytolytic syndrome of hepatocytes in animals (Brūveris et al., 2000).
of concentrations of NEFA in calves corresponds to the first nursing. Calves had greater initial NEFA concentrations because they were mobilizing fat reserves for energy demands (Lents et al., 1998). However, when calves receive the nutrients present in the milk, a decrease in NEFA concentrations is shown (Quigley et al., 1991; Egli et al., 1998).
The lack of significant modifications of the studied electrolytes allow to establish that magnesium, iron, potassium, phosphorus, chloride, and sodium are not influenced by the age. According to other authors, serum concentrations of some blood metabolites of calves during the first days of life were not showed any significance because the status of animals was compatible with good health and survival during the experimental period considered (Diesch et al., 2004a). However, modifications of these parameters in older subjects and metabolic changes were found during the growth (Davey et al., 1998). Therefore further investigation should be done on the serum concentration of studied electrolytes in calves in a longer neonatal period to confirm this conclusion.
CONCLUSIONS
Modifications of the studied parameters could be attributed to functional development of calves in neonatal period. These results contribute to the knowledge of adaptation processes in calf during the first week and the first month of life resulting useful for the diagnosis and treatment of any neonatal diseases.
REFERENCES
BIRĢELE, E.; ILGAŽA, A. Age and feed effect on the dynamics of animal blood biochemical values in postnatal ontogenesis in calves. Vet.
Zootech.,v.22, p.5-10, 2003.
BRUN-HANSEN, H.C., KAMPEN, A.H., LUND, A. Hematologic values in calves during the first 6 months of life.Vet. Clin. Pathol.,v.35, p.182-187, 2006.
BUSCHMANN, H.; HOFFMANN, B.;
KAMPHUES, J. et al. Anatomy and physiology of the newborn. In WALZER, K., BOSTEDT, H. (Ed.). Neonatal Diseases of the Animals.
Bologna: Agricole, 1993. p.1-44.
BRŪVERIS, Z.; BIRĢELE, E.; AUZĀNS, A. et al. Morphofunctional stase of liver and blood biochemicl parameters in new-born calves in milk eating period. Acta Veterinaria Baltica, 2000. p.46-50.
CARCANGIU, V.; PAZZOLA, M.; BUA, S. et al. Some hematochemical parameters pattern during first year of live in Friesian Calves. In: ATTI CONGRESSO INTERNAZIONALE, 10.,
2002, Tunisia. Proceedings… Tunisia:
FEMESPRUM, 2002. p.1-7.
DAVEY, M.G.; JOHNS, D.P.; HARDING, R. Postnatal development of respiratory function in lambs studied serially between birth and 8 weeks. Resp. Physiol., v.113, p.83-93, 1998.
DIESCH, T.J., MELLOR, D.J., STAFFORD, K.J. et al. The physiological and physical status of single calves at birth in a dairy herd in New Zealand. N. Z. Vet. J., v.52,p.250-255, 2004a.
DIESCH, T.J.; MELLOR, D.J.; STAFFORD, K.J. Blood metabolites and body temperature of single calves between 1 and 4 days of age in a dairy herd in New Zealand. N. Z. Vet. J., v.52, p.256-260, 2004b.
DWYER, C.M. The welfare of the neonatal lamb. Small Rum. Res., v.76, p.31-41, 2008.
EGLI, C.P.; BLUM, J.W. Clinical, haematological, metabolic and endocrine traits during the first three month of life of suckling simmentaler calves held in a cow-calf operation.
Zentbl. Vet. Med. A,v.45,p.99-118, 1998.
GRØNDHAL, A.M.; SKANCKE, E.M., MEJDELL, C.M. Growth rate, health and welfare in a dairy herd with natural suckling until 6-8 weeks of age: a case report. Acta Vet. Scand., v.49, p.1-5, 2007.
JEŽEK, J., KLOPČIČ, M., KLINKON, M. Influence of age on biochemical parameters in calves. Bull. Vet. Inst. Pulawy, v.50,p.211-214, 2006.
KNOWLES, T.G.; EDWARDS, J.E.; BAZELEY, K.J. et al. Changes in the blood biochemical and haematological profile of neonatal calves with age. Vet. Rec.,v.147, p.593-598, 2006.
LENTS, C.A.; WETTEMANN, M., LOOPER, L. et al. Concentrations of GH, IGF-I, Insulin, and glucose in postnatal beef calves. In:___Anim.
Sci. Res. Rep. Oklahoma: Oklahoma University
State, 1998. p.215-222.
MOHRI, M., SHAFIRI, K., EIDI, S. Hematology and serum biochemistry of Holstein dairy calves: Age related changes and comparison with blood composition in adults. Res. Vet. Sci., v.83,30-39, 2007.
PICCIONE, G.; ASSENZA, A.; COSTA, A. Monitoring of some physiological parameters during the first 30 days of a foal’s life. Med
Weter.,v.61, p.1142-1144, 2007a.
PICCIONE, G.; BERTOLUCCI, C.; GIANNETTO, C. et al. Clotting profiles in newborn Maltese kids during the first week of life. J. Vet. Diagn. Invest., v.20,p.114-118, 2008.
PICCIONE, G.; BORRUSO, M.; FAZIO, F. et al. Physiological parameters in lambs during the first 30 days postpartum. Small Rum. Res., v.72, p.57-60, 2007b.
PICCIONE, G.; COSTA, A.; BERTOLUCCI, C. et al. Acid-base balance modifications in the lamb and goat kids during the first week of life.
Small Rum. Res., v.63,p.304-308, 2006.
PICCIONE, G.; CAOLA, G.; REFINETTI, R. Maturation of daily body temperature rhythm in sheep and horse. J. Thermal Biol., v.27, p.333-336, 2002.
QUIGLEY, J.D.; CALDWELL, L.A.; SINKS, G.D. et al. Changes in blood glucose, nonesterified fatty acids, and ketones in response to weaning and feed intake in young calves. J.
Dairy Sci., v.74,p.250-257, 1991.
SHOPE, R.E. The effect of age on the total and combined cholesterol of the blood serum. J. Biol.
Chem., v.80, p.141-148, 1928.
STEINHARDT, M.; THIELSCHER, H.H. Quality of development and adaptation reactions of dairy calves at the specific age periods in early life. Effect of rearing variations on proteins and minerals and on metabolic variables of blood.
Dtsch Tierarztl. Wochenschr., v.106,p.510-518,
1999.