EFFECT OF THE SELECTED IMMUNOSTIMULATORS ON PHYSIOLOGICAL AND
PRODUCTION PARAMETERS OF SOWS
WPŁYW WYBRANYCH IMMUNOSTYMULATORÓW NA WSKAŹNIKI
FIZJOLOGICZNO-PRODUKCYJNE U LOCH
Anna REKIEL, Karolina BEYGA, Beata KUCZYŃSKA
Warsaw University of Life Sciences, Faculty of Animal Science, Department of Pig Breeding Ciszewskiego 8, 02-786 Warsaw, Poland, tel. +48 22 5936561 [email protected]
Manuscript received: June 18, 2007; Reviewed: May 12, 2008; Accepted for publication: June 02, 2008
ABSTRACT
The aim of the study was to determine the effect of immunostimulation of sows during the perinatal period (Biostymine, Lydium-KLP) on physiological-production parameters of the sows: haematological and biochemical blood indices, colostrum and milk composition and fatty acid profile, physical (pH) and cytological (somatic cells count - SCC) parameters as well as results of reproduction and rearing of piglets. None effect of the examined immunostimulators on the most of the studied traits and indices was found. There were the changes in pH, energy level and composition of milk. Additionally, the changes in fatty acid profile in milk fat were recorded; they consisted in significantly lower or higher participation of certain fatty acids in the samples, collected from the sows which received Biostymine, as compared to the group, receiving Lydium-KLP and/or groups which did not receive any additive.
KEY WORDS: sows, immunostimulation, blood, colostrum, milk, fertility, rearing piglets
STRESZCZENIE
Celem pracy było określenie wpływu immunostymulacji loch w okresie okołoporodowym (Biostymina, Lydium-KLP) na wskaźniki fizjologiczno-produkcyjne u loch: hematologiczne i biochemiczne krwi, skład siary i mleka oraz profil wybranych kwasów tłuszczowych, parametry fizyczne (pH) i cytologiczne (liczba komórek somatycznych - LKS), a także wyniki rozrodu i odchowu prosiąt. Nie stwierdzono wpływu badanych immunostymulatorów na większość badanych cech i wskaźników. Wystąpiły zmiany w pH, energetyczności i składzie mleka. Stwierdzono ponadto zmiany profilu kwasów tłuszczowych w tłuszczu mleka polegające na istotnie niższym lub wyższym udziale niektórych kwasów tłuszczowych w próbkach pobranych od loch, którym podano Biostyminę w porównaniu do grupy otrzymującej Lydium-KLP i/lub grupy bez dodatku.
STRESZCZENIE SZCZEGÓŁOWE
Celem pracy było określenie wpływu immunostymulacji loch (mieszańce F1 polska biała zwisłoucha x wielka biała polska, wieloródki:pierwiastki ~2:1, n=28) w okresie okołoporodowym (grupy doświadczalne: Biostymina (E1) i Lydium-KLP (E2) oraz grupa kontrolna bez dodatku (C)) na wskaźniki hematologiczne (RBC, WBC, HCT, MCV, WBC, leukogram) i biochemiczne krwi (ALB, GLU, BUN, TP, ALP, TRIG, CHOL, HDLC, VLDL, LDL), skład siary i mleka (sucha masa, białko, tłuszcz, laktoza), profil wybranych kwasów tłuszczowych (C14:0, C16:0, C16:1, C18:1, C18:2, CLA, C18:3, C20:4) oraz parametry fizyczne (pH) i cytologiczne (liczba komórek somatycznych - LKS), a także wyniki rozrodu i odchowu prosiąt. Nie stwierdzono wpływu badanych immunostymulatorów na większość badanych cech i wskaźników, a jedynie korzystne zwiększenie energetyczności mleka oraz zawartości suchej masy, białka i tłuszczu w mleku loch E1 w porównaniu z E2 i C (P≤0,01 lub P≤0,05) przy jednocześnie wysoko istotnie lub istotnie podwyższonym pH mleka w grupie E1 w stosunku do grup E2 i C. Stwierdzono różnice w profilu kwasów tłuszczowych (P≤0,01 i P≤0,05), polegające na niższym udziale kwasów C14:0, C16:0, C16:1 i wyższym kwasów C18:0, C18:1 i CLA w próbkach mleka loch, którym podano Biostyminę (E1) w porównaniu z grupą E2 i/lub C. Uzyskane rezultaty powinny być zweryfikowane na większym materiale badawczym.
INTRODUCTION
The supreme purpose of immunostimulation is to induce the antigen-independent cellular or humoral mechanisms of non-specific defence against pathogenic factors. In practice, immunostimulating agents of the 1st and 2nd
generation are applied. Their health-promoting and/or production-stimulating effect was revealed [1, 2, 14]. The preparations, containing antibodies of egg yolk (IgY) [9,15] or methanol extract of aloes [13] are also successfully employed.
The purpose of the study was to determine the effect of immunostimulating the sows during the perinatal period (Biostymine, Lydium-KLP) on haematological and biochemical blood parameters, colostrum and milk composition and profile of the selected fatty acids and physical (pH) and cytological (SCC) parameters as well as on the results of reproduction and rearing of piglets.
MATERIAL AND METHODS
The research material consisted of 28 sows of crossbreds F1 (multiparous: primiparous sows ~ 2:1) of Polish Large
White x Polish Landrace breeds and their progeny. The animals were classified into three groups. The sows from the experimental group 1 (E1; n=10 heads) received Biostymine (1 ml/head) for three successive days after parturition and those ones from experimental group 2 (E2; n=10 heads) obtained Lydium-KLP in the quantity of 0.02 mg/kg of body weight on the first day after parturition. The control sows (C group, n=8 animals) did not receive any immunostimulators.
During the duration of the experiment, the sows received the full-ration concentrate of “nursing sow” type (NS); during pregnancy, the feed was administrated twice and during lactation – three times a day, in conformity with the standards. During the first week of life, the piglets received milk substitute and from the 5th – 6th day, they
were additionally ad libitum fed the mixture Prestarter I. The mixture NS contained 2270 kcal, 17% of crude protein and 1.0% of lysine in 1 kg. Prestarter I had 2416 kcal, 20% of crude protein and 1.5% of lysine.
The sows and piglets were covered with the standard prophylactic programme.
The selected reproduction traits of sows and the production traits of their progeny were controlled. The litters were weighed at birth and the piglets were individually weighed at weaning at the age of 3 weeks (±0.1kg). The metabolic changes in sows were evaluated from the parameters of complete blood and serum and the functional ones of mammary gland were assessed on the ground of testing serum and milk.
Blood samples for haematological tests were collected from the sows in the presence of anticoagulant (EDTA) on the 104th day of pregnancy and on the day of piglets’
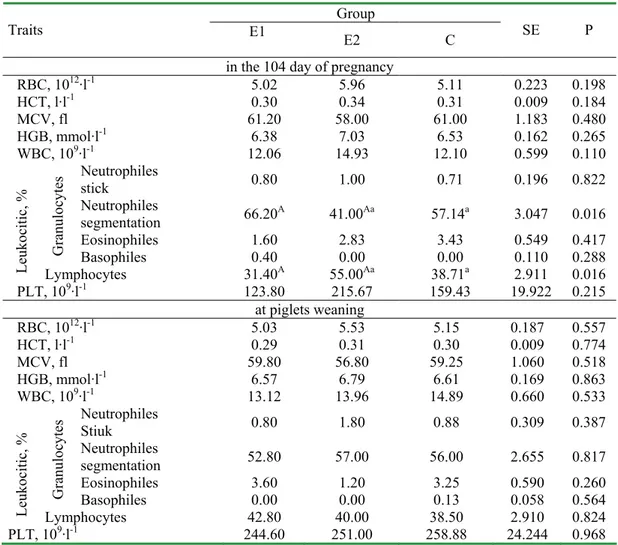
weaning; the blood samples were collected from neck vein before the morning feeding. The following determinations were carried out in full blood: haemoglobin concentration (HB), number of erythrocytes (RBC) and leukocytes (WBC), haematocrite (HCT), mean volume of red cells (MCV) and number of blood plates (PLT). The determinations were carried out in haematological analyser ABACUS of Diatron company. White blood cell composition, number of neutrophilic, acidophilic and basophilic granulocytes as well as lymphocytes and monocytes was determined.
Table 1. Morphological blood indices of sows Group
Traits E1 E2 C SE P
in the 104 day of pregnancy
RBC, 1012·l-1 5.02 5.96 5.11 0.223 0.198
HCT, l·l-1 0.30 0.34 0.31 0.009 0.184
MCV, fl 61.20 58.00 61.00 1.183 0.480 HGB, mmol·l-1 6.38 7.03 6.53 0.162 0.265
WBC, 109·l-1 12.06 14.93 12.10 0.599 0.110
Neutrophiles
stick 0.80 1.00 0.71 0.196 0.822 Neutrophiles
segmentation 66.20A 41.00Aa 57.14a 3.047 0.016 Eosinophiles 1.60 2.83 3.43 0.549 0.417
G ra nu lo cy te s
Basophiles 0.40 0.00 0.00 0.110 0.288
Le uk oc iti c, %
Lymphocytes 31.40A 55.00Aa 38.71a 2.911 0.016
PLT, 109·l-1 123.80 215.67 159.43 19.922 0.215
at piglets weaning
RBC, 1012·l-1 5.03 5.53 5.15 0.187 0.557
HCT, l·l-1 0.29 0.31 0.30 0.009 0.774
MCV, fl 59.80 56.80 59.25 1.060 0.518 HGB, mmol·l-1 6.57 6.79 6.61 0.169 0.863
WBC, 109·l-1 13.12 13.96 14.89 0.660 0.533
Neutrophiles
Stiuk 0.80 1.80 0.88 0.309 0.387 Neutrophiles
segmentation 52.80 57.00 56.00 2.655 0.817 Eosinophiles 3.60 1.20 3.25 0.590 0.260
G ra nu lo cy te s
Basophiles 0.00 0.00 0.13 0.058 0.564
Le uk oc iti c, %
Lymphocytes 42.80 40.00 38.50 2.910 0.824 PLT, 109·l-1 244.60 251.00 258.88 24.244 0.968
Mean values marked with the same capital letters AA are statistically significantly different at (P�0.01), small letters aa at (P�0.05)
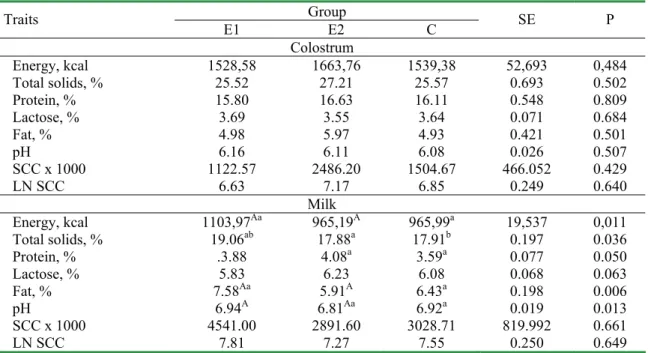
were performed by the so-called dry chemical method, with the application of VITROS DT 60 II System, using diagnostic kits of ICN Instruments Polska Ltd. The 50-ml samples of colostrum and bulk milk were collected in the presence of preservative (Mlekostat CC) during parturition and on the day of weaning the litter. Active acidity (pH) of colostrum and milk was determined by pH-meter pH 211 of Hanna Instrument company; the somatic cell count (SCC) was determined by Somacount 150 of Bentley company. In the samples of colostrum and milk, the basic composition, i.e. dry solids, fat, protein and lactose, was determined by IR interferometry method, using Milkoscan FT 120 of Foss Electric company. The energy level in colostrum and milk was calculated. Fat of colostrum and milk was extracted by Rőse-Gotlieb method according to PN-A-86122. Esters of fatty acids were separated by a gas chromatography; the analyses
were conducted in two repetitions and the mean result was considered. The results were statistically developed, using one-factor variance analysis, with the application of the least square method and computer programme SPSS. The numerical values of somatic cells were subject to logarithmic transformation.
RESULTS AND DISCUSSION
Table 2. Biochemical indices in sows serum Group
Traits E1 E2 C SE P
in the 104 day of pregnancy
ALB, g·l-1 37.60 43.17 41.67 1.123 0.182
GLU, mmol·l-1 4.09 3.17 3.53 0.159 0.114
BUN, mmol·l-1 4.07 5.06 4.79 0.185 0.142
TP, mmol·l-1 63.80 70.00 68.11 2.225 0.568
ALP, U·l-1 53.40 53.83 54.25 4.652 0.997
TRIG, mmol·l-1 0.71 0.73 0.58 0.067 0.548
CHOL, mmol·l-1 1.75 2.13 1.93 0.084 0.258
HDLC, mmol·l-1 0.69 0.87 0.88 0.043 0.184
VLDL, mmol·l-1 0.28 0.29 0.23 0.028 0.571
LDL, mmol·l-1 0.74 0.96 0.81 0.066 0.428
CHOL/HDL 2.20 2.47 2.19 0.083 0.292 at piglets weaning
ALB, g·l-1 40.60 40.67 40.89 0.761 0.985
GLU, mmol·l-1 2.39 3.09 2.87 0.181 0.336
BUN, mmol·l-1 3.64 3.93 4.21 0.170 0.402
TP, mmol·l-1 70.60 65.50 66.78 1.485 0.418
ALP, U·l-1 38.00 49.17 52.33 4.255 0.391
TRIG, mmol·l-1 0.45 0.32 0.33 0.023 0.084
CHOL, mmol·l-1 1.59 1.87 1.85 0.074 0.307
HDLC, mmol·l-1 0.74 0.85 0.87 0.031 0.230
VLDL, mmol·l-1 0.18 0.13 0.14 0.010 0.194
LDL, mmol·l-1 0.68 0.89 0.81 0.060 0.402
CHOL/HDL 2.18 2.23 2.07 0.079 0.678
Table 3. Basic composition and selected physical and cytological parameters of sows colostrum and milk Group
Traits E1 E2 C SE P
Colostrum
Energy, kcal 1528,58 1663,76 1539,38 52,693 0,484
Total solids, % 25.52 27.21 25.57 0.693 0.502
Protein, % 15.80 16.63 16.11 0.548 0.809
Lactose, % 3.69 3.55 3.64 0.071 0.684
Fat, % 4.98 5.97 4.93 0.421 0.501
pH 6.16 6.11 6.08 0.026 0.507
SCC x 1000 1122.57 2486.20 1504.67 466.052 0.429
LN SCC 6.63 7.17 6.85 0.249 0.640
Milk
Energy, kcal 1103,97Aa 965,19A 965,99a 19,537 0,011
Total solids, % 19.06ab 17.88a 17.91b 0.197 0.036
Protein, % .3.88 4.08a 3.59a 0.077 0.050
Lactose, % 5.83 6.23 6.08 0.068 0.063
Fat, % 7.58Aa 5.91A 6.43a 0.198 0.006
pH 6.94A 6.81Aa 6.92a 0.019 0.013
SCC x 1000 4541.00 2891.60 3028.71 819.992 0.661
LN SCC 7.81 7.27 7.55 0.250 0.649
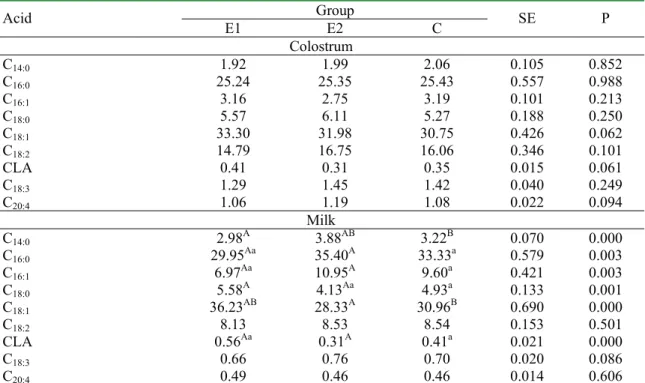
Table 4. The profile of fatty acids (% of a sum) in colostrum fat and milk of sows. Group
Acid E1 E2 C SE P
Colostrum
C14:0 1.92 1.99 2.06 0.105 0.852
C16:0 25.24 25.35 25.43 0.557 0.988
C16:1 3.16 2.75 3.19 0.101 0.213
C18:0 5.57 6.11 5.27 0.188 0.250
C18:1 33.30 31.98 30.75 0.426 0.062
C18:2 14.79 16.75 16.06 0.346 0.101
CLA 0.41 0.31 0.35 0.015 0.061
C18:3 1.29 1.45 1.42 0.040 0.249
C20:4 1.06 1.19 1.08 0.022 0.094
Milk
C14:0 2.98A 3.88AB 3.22B 0.070 0.000
C16:0 29.95Aa 35.40A 33.33a 0.579 0.003
C16:1 6.97Aa 10.95A 9.60a 0.421 0.003
C18:0 5.58A 4.13Aa 4.93a 0.133 0.001
C18:1 36.23AB 28.33A 30.96B 0.690 0.000
C18:2 8.13 8.53 8.54 0.153 0.501
CLA 0.56Aa 0.31A 0.41a 0.021 0.000
C18:3 0.66 0.76 0.70 0.020 0.086
C20:4 0.49 0.46 0.46 0.014 0.606
Mean values marked with the same capital letters AA are statistically significantly different at (P�0.01), small letters aa at (P�0.05)
lymphocytes in pregnant sows (Tables 1, 2). The number of red blood cells of sows varies during pregnancy and lactation periods [6]. In pregnancy, RBC, HGB and HCT are decreased what is related to mobilization of the sow’s haemoglobin to blood circulatory system of fetus and to the increase of blood plasma volume [18]. The decrease is often maintained till the end of lactation [4]. Other haematological indices in own studies remained on a stable level, irrespectively of the experimental factor and physiological state what is consistent with the literature data in this respect [6, 16].
None differences in biochemical indices between the groups E1, E2 and C (Table 2) were found. The changes in activity were recorded during physiological periods (pregnancy, lactation) what stays in accordance with the literature data [6]. The optimal activity of biochemical parameters in pigs is specified in standards [17]. Their values indicate the level of metabolic changes. They are studied in growing pigs, in those ones used in reproduction and in the pigs subjected to effect of stressing agents. Physiological rise of ALP activity is recorded during pregnancy; the level of alkaline phosphatase is lowered during lactation [17] what was observed in the own studies (Table 2). The changes in metabolic profile may indicate the deficit of protein in feed and easily digestible carbohydrates and also, necrotic phenomena. As a result,
tissue metabolism may change into catabolism. Such phenomenon was not observed in the experimental animals and biochemical parameters were found within the limits of reference standards for a given species and group [6, 17]. During lactation period, the decrease of GLU, TRIG and CHOL (Table 2) as compared to pregnancy period was recorded. Žvorc et al. [18] reported on a constant level of glucose in pregnant sows. The same authors [18] and Kudlač et al. [11] showed the increase of GLU level in blood of the sows during lactation, as compared to pregnancy period. The occurring changes in glucose concentration result from physiological changes, which take place in metabolic processes at the beginning of lactation [10]. The lipid management was also discussed by other authors [8].
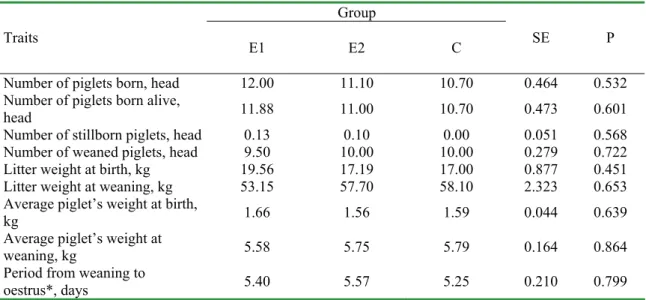
Table 5. Selected indices of sows’ reproduction Group
Traits E1 E2 C SE P
Number of piglets born, head 12.00 11.10 10.70 0.464 0.532
Number of piglets born alive,
head 11.88 11.00 10.70 0.473 0.601
Number of stillborn piglets, head 0.13 0.10 0.00 0.051 0.568
Number of weaned piglets, head 9.50 10.00 10.00 0.279 0.722
Litter weight at birth, kg 19.56 17.19 17.00 0.877 0.451
Litter weight at weaning, kg 53.15 57.70 58.10 2.323 0.653
Average piglet’s weight at birth,
kg 1.66 1.56 1.59 0.044 0.639
Average piglet’s weight at
weaning, kg 5.58 5.75 5.79 0.164 0.864
Period from weaning to
oestrus*, days 5.40 5.57 5.25 0.210 0.799
* period between weaning and efficient mating
milk as compared to colostrum what was confirmed by literature [5].
Fatty acid profile in milk of sows from E1, E2 and C groups was comparable but many differences (P≤0.01; P≤0.05) were recorded (Table 4). In group E1, as compared to E2 and C, the participation of acids: C14:0, C16:0 and C16:1 was lower whereas that one of acids C18:0, C18:1 and CLA was higher. The obtained results should be verified on greater material although the obtained fatty acid profile is supported by literature data on the discussed subject [12]. The results of sows’ fertility were quite good and those of piglets rearing should be considered as correct (Table 5). Lack of differences between the groups suggest that the immunostimulators, employed in groups E1 and E2 did not have any effect on the controlled production traits. The subject requires further studies.
CONCLUSIONS
None effect of Biostymine (group E1) and Lydium-KLP (E2) on the most of the studied traits and parameters was found. Only a favourable increase of energy level in milk and content of dry solids, protein and fat in milk of the sows from E1 group was recorded, as compared to E2 and C groups (P≤0.01 or P≤0.05). There was a simultaneous highly significant or significant increase of pH of milk in group E1 in relation to the remaining groups. Differences in fatty acid profile (P≤0.01 and P≤0.05) consisting in lower participation of acids C 14:0, C16:0 and C16:1 and higher participation of acids C18:0, C 18:1 and CLA in the samples of milk from the sows, fed the addition of Biostymine (E1) as compared to E2
and/or C. The obtained results should be verified on more greater research material.
REFERENCES
[1] Caceres L., Mc Gil G. B., Pena F., Effect of levamisole on the preweaning development of low birth weight piglets, Med. Vet. (2001) 5: 435-438.
[2] Cąkała S., Nowy preparat Lydium-KLP w leczeniu chorób zakaźnych zwierząt, Życie Wet. (1994) 4: 138-141.
[3] Coffey M.T., Seerley R.W., Mabry J.W., The effect of source of supplemental dietary energy on sows milk yield, milk composition and litter performance. J. Anim. Sci. (1982) 55: 1388-1394.
[4] Dungan L.J., Weist D.B., Fyte D.A., Smith A.C., Swindle M.M., Normal hematology, serology, and serum protein electrophoresis values in fetal Yucatan miniature swine. Lab. Anim. Sci. (1995) 45: 285-289.
[5] Garst A.S., Ball S.F., Williams B.L., Wood C.M., Knight J.W., Moll H.D., Aardema C.H., Gwazdauskas F.C., Influence of pig substitution on milk, yield, litter weights, and milk composition on machine milked sows. J. Anim. Sci. (1999) 77: 1624-1630.
[6] Friendship R.M., Henry S.C., Cardiovascular system, hematology and clinical chemistry, in: Leman A.D., StrawLeman B.E., Mengeling W.L., D’Allaire S., Taylor D.J. (Eds.), Diseases of Swine. Iowa State Uniwersity Press, USA, 1996, pp 3-11.
Gračner D., Haematological and biochemical values in blood of wild boar (Sus strofa ferus), Vet. Arhiv. (2003) 6: 333-343.
[8] Jezkova D., Smrckova M., Changes in lipid level in the blood of pregnant sows, Vet. Med. (1991) 10: 599-606.
[9] Kobayashi Ch., Yokoyama H., Nguyen S.V., Kodama Y., Kimała T., Izeki M., Effect of egg yolk antibody on experimental Cryptosporidium parvum infection in acid mice. Vaccine (2004) 23: 232-235.
[10] Komatsu T., Itoh F., Kushibiki S., Hodate K., Changes in gene expression of glucose transportes in lactating and nonlactating cows, J. Anim. Sci. (2005) 83: 557-564.
[11] Kudlač E., Vlček Z., Hloušek A., Studenčik B., Nedbalkova J., Zmeny v biochemicke skladbe krve prasnic v puerperiu. Vet. Med. (1988) 33: 401-410.
[12] Migdał W., Fats and glucose in feeding doses for pregnancy and lactation sows, Biotehnologija u stocarstvu. I Yugoslav International Congress on Animal Husbandry, (1997) 13, 3-4, pp. 149-154.
[13] Rekiel A., Wykorzystanie Biostyminy w
odchowie prosiąt charłaczych. Trz. Chlew. (1992) 6: 6-7.
[14] Rethefford M., Rekonstrukcyjny wpływ Mycobacterium Chaloane na odpowiedź immunologiczną drobiu będącego w stanie immunosupresji. Praca doktorska ART. Olsztyn, 1999.
[15] Stefaniak T., Kopeć W., Gąsowska A., Borkowski J., Gierzyńska E., Popławski M., Zastosowanie immunoglobuliny żółtka jaja w profilaktyce biegunek u prosiąt ssących. Med. Wet. (2003) 6: 539-542.
[16] Ursache O., Meissonnier E., Chevrier L., Quinchon C., Tillon J.P., Profil biochemique des truies reproductrices. II. Resultats en elevage de type experimental. Revue Med. Vet. (1980) 131: 75-82.
[17] Winnicka A., Wartości referencyjne podstawowych badań laboratoryjnych w weterynarii. Wyd. SGGW Warszawa, 2005.