(Annals of the Brazilian Academy of Sciences) ISSN 0001-3765
www.scielo.br/aabc
Quantification of porosity evolution from unaltered to propylitic-altered granites:
the
14C-PMMA method applied on the hydrothermal system of
Lavras do Sul, Brazil
EVERTON M. BONGIOLO1, DANIELA E. BONGIOLO1, PAUL SARDINI2, ANDRÉ S. MEXIAS3, MARJA SIITARI-KAUPPI4, MÁRCIA E.B. GOMES3 and MILTON L.L. FORMOSO3
1Programa de Pós Graduação em Geociências da UFRGS, Instituto de Geociências
Av. Bento Gonçalves 9500, 91501-970 Porto Alegre, RS, Brasil
2UMR 6532 CNRS HYDRASA, Université de Poitiers, 40 Avenue du Recteur Pineau, 86022 Poitiers, France 3UFRGS, Instituto de Geociências. Av. Bento Gonçalves 9500, 91501-970 Porto Alegre, RS, Brasil 4Laboratory of Radiochemistry, Department of Chemistry, PO Box 55, 00014, University of Helsinki, Finland
Manuscript received on September 14, 2006; accepted for publication on January 31, 2007; contributed byMILTONL.L. FORMOSO*
ABSTRACT
This work is an application of the14C-Polymethylmethacrylate method to compare the porosity evolution between unal-tered and propylitic-alunal-tered granites, using samples from Lavras do Sul region, Brazil. This method, when coupled with optical and electronic petrography has the advantage over other methods to provide the quantification and identification of total and local porosity of rocks. From petrographic observations, different kinds of porous zones were identified and quantified (microfractures, grain boundaries, alteration of minerals, etc). Results show that unaltered granites have 0.5 to 0.6% porosity and propylitic-altered ones have 1.7 to 1.8% porosity, even between samples with different textures. Porosity of altered rocks increases mainly due to higher porosity of neoformed chlorite, calcite, sericite and microfractures. Field observations show that later phyllic alteration halos are wider in equigranular than in porphyritic granites, which could not be explained by different original porosity between those rocks. The observed differences of phyllic halos diffusion were controlled by structural and fluid/rock ratio variations between the equigranular and porphyritic granitic facies during the later hydrothermal stage.
Key words: porosity quantification, 14C-PMMA method, granite porosity, hydrothermal alteration, propylitic alteration, Lavras do Sul.
INTRODUCTION
Methodologies for rock porosity quantification like wa-ter impregnation, mercury injection, fluorescent resin im-pregnation and gas adsorption in different kinds of rocks have been developed in the last decades (Dubois et al. 1998, Schild et al. 2001, Yue et al. 2004). These meth-ods however, have reasonable resolutions only for total rock porosity. The14C-Polymethylmethacrylate (14
C-*Member Academia Brasileira de Ciências Correspondence to: Everton Marques Bongiolo E-mail: [email protected]
PMMA) method has the advantage over those methods because it provides also the porosity quantification of se-lected areas of the rock surface (Hellmuth et al. 1993). When coupled with petrographic data and image analy-sis, it is possible to recognize the petrophysical charac-teristics of its associated sites (Oila et al. 2005, Sardini et al. 2006).
regimes; (2) porous zones are pathways for fluid flow and solute diffusion and (3) orientation of microfissures controls the anisotropy of petrophysical and mechanical properties of rocks that can indicate stress regimes. In hydrothermal systems, porosity quantification of altered and unaltered rocks can be used as a tool for prevision of fluid/rock ratio and for recognition and quantification of pathways controlling hydrothermal alteration.
The Lavras do Sul Gold Mining District (LD) com-prises hydrothermally altered Au-Cu (± Pb, Zn, Ag)-bearing prospects hosted in Neoproterozoic granitic and volcanogenic sequence, located near the town of Lavras do Sul, Rio Grande do Sul State (RS), southernmost Brazil (Fig. 1). The major gold mineralizations (0.4 to 5 ppm) are located in N40◦E to E–W quartz + diocta-hedral phyllosilicates + pyrite (±chalcopyrite) veins and breccia and their related alteration halos. These highly al-tered and deformed zones are associated to an alteration stage (phyllic alteration) that superimposes initially unal-tered and propylitic (pervasive alteration) alunal-tered rocks. The granitic complex which hosts the mineraliza-tions is characterized by a reverse zonation of its geo-chemical and petrographic features, called central, trans-itional and border facies (Nardi and Lima 1985). The central facies comprises shoshonitic rapakivi coarse-grained porphyritic granodiorites and monzogranites, while the border facies hosts mainly alkaline coarse-grained equigranular perthite granites. The transitional facies comprises textural and geochemical hybrid rocks (monzo and syenogranites) generated by partial assim-ilation of the central facies by the border one (Nardi and Lima 1985). The occurrence of microgranular mafic enclaves (MME) attests a coeval mafic magmatism with both central and border granitoids (Nardi and Lima 2000), besides swarms of enclaves are more likely found in the transitional and border granitic facies.
It is known from field observations and borehole descriptions (E.M. Bongiolo, unpublished data) that dif-fusion of hydrothermal alteration halos around veins (phyllic alteration) is quite different between the granitic facies. Perthite granites from border facies have com-monly wider halos (up to 40 m width) than rapakivi granites from the central facies (<10 m width), although phyllic alteration was probably produced at the same time in both facies, as they have similar 595±5 Ma
magmatic age (Remus et al. 2000) and structural ori-entation of later mineralized veins associated to phyllic alteration.
The aims of the present contribution are (1) to com-pare the evolution of porosity between unaltered and propylitic-altered granitic rocks using samples from Lavras do Sul area and (2) to test the influence of primary porosity of rocks on the diffusion (width) of later phyl-lic alteration halos around veins from different granitic facies. The14C-polymethylmethacrylate (14C-PMMA)
method, coupled with detailed petrographic and digital image processing studies were carried out to identify and quantify the micrometer to decimeter porosity hetero-geneities of rocks from central and border granitic facies and to compare the obtained results with field data.
MATERIALS AND METHODS
It was selected four granitic rock samples of drill cores from Bloco do Butiá (sample A) and Valdo Teixeira (sam-ples C and D) prospects and of a surface quarry from Cerrito (sample B) prospect (Fig. 1B).
Samples A and B represent original or near unal-tered rocks with contrasting compositions and textures (border and central granitic facies respectively) that hosts different alteration halos width of later phyllic alteration. They were collected in zones where fractures and faults are not observed. Samples C and D represent avail-able boreholes comprising propylitic-altered rocks (bor-der granitic facies) of contrasting texture, i.e. associated to an intermediate (pervasive) alteration stage between unaltered and highly altered rocks. They were collected in altered zones near structurally controlled quartz veins from Valdo Teixeira prospect, but with weak or no influ-ence of later alteration halos.
THE 14C-POLYMETHYLMETHACRYLATE
(14C-PMMA) METHOD
The14C-PMMA method developed by Hellmuth et al.
(1993) consists in sample impregnation with14C-MMA
under vacuum, polymerization by irradiation and au-toradiography of sample surface. A bidimensional (2D) porosity image is obtained and optical density and poros-ity calculations were performed on samples using digital image processing techniques.
po-Fig. 1 – Simplified geological map of the Lavras do Sul region. Modified from Gastal and Lafon (1998). Sampling was performed in the following prospects: Bloco do Butiá (sample A), Cerrito (sample B), and Valdo Teixeira (samples C and D).
lar molecule with low viscosity (0.00584 Pa s at 20◦C) and small size (100.1 g/mol) when compared to the wa-ter molecule, which allows an effective penetration in the rock porous spaces. The14C low-energy (maximum 155 keV) and its 5360 years half-life yields good
autora-diographic resolutions for rocks submitted to long time impregnation.
has a hydrophobic characteristic that inhibits its com-plete infiltration in rocks when water is present. This step was followed by the impregnation of samples with
14C-MMA in the same vacuum chamber during 21 days.
After that, the14C-MMA impregnated in samples was
polymerized (fixed in the rock matrix) during 8 days, which consists inγ-ray irradiation (total dose: 77 kGy) using a 60Co source. The initial concentration of the 14C-MMA tracer used in this study was 0.5 MBq/ml.
Thin sections of impregnated rock fragments were pro-duced for petrographic observations of the similar areas and to obtain an estimative of the volume (%) of mineral phases present in each sample by point counting (1500 points). A better quantification of mafic mineral contents in exactly the same areas used for porosity quantification of unaltered rocks was performed digitally on JPEG im-ages after selective staining techniques (see below) using Adobe Photoshop software. The main petrographic characteristics and the mineral content in each sample are summarized on Table I. The sawn surface of rock samples was polished (1/4µm) and cleaned ultrason-ically for 3 minutes to obtain very plane surfaces be-fore to perform the autoradiography exposition. After performed the autoradiography, the plane surfaces were covered with carbon to obtain additional petrographic observations directly on the rock, using a Jeol JSM-5800 Scanning Electron Microscope (SEM) equipped with an EDS quantitative analyzer.
The autoradiography method is based on detection of radiation with nuclear emulsions. The sensibility of the autoradiographic film is a function of exposition time, activity of the radiation target and the blacken-ing of the photographic film (Hellmuth et al. 1993). A KodakX-OMAT MA film (20µm resolution) was used with the impregnated samples and together with 14
C-PMMA calibration series (5.1356–3to 97.535–3MBq/ml
activities). These patterns are used to calculate the cali-bration function for quantitative analyses of rock poros-ity (Hellmuth et al. 1993). The exposition time of rock samples and thin sections was 5 days. The obtained au-toradiographies were digitalized in BMP grey level (8 bit), using transparent option and a resolution of 1200 dpi (each pixel is 21.2µm2) using a UMAX Power Look
III scanner.
THEORETICALASSUMPTIONS OFPOROSITY
CALCULATION
The porosity quantification is based on the assumption that optical densities on autoradiographies are propor-tional to the decaying isotope contents in the studied ma-terial (Hellmuth et al. 1993, Oila et al. 2005).
The rock porosity calculation using the autoradio-graphies comprises the following steps:
– initially all grey-levels intensities(I)and its related background(I0)are determined digitally in several areas of the sample;
– the optic densities (D) are calculated using the Lambert-Beer law (Equation 1) and lately converted into activities (A) using Microcal Origin soft-ware. This software provides a calibration curve based on interactive calculation using tree param-eters: the k correction factor, the minimum opti-cal density(D0)and the maximum optical density
(Dmax)shown in equation 2 (Treutler and Freyer 1988);
– the activities are then converted to porosities us-ing the Autoradio©software (D. Prêt, unpublished
data).
D= −log
I I0 (1) A= −1 k ln 1− D
−D0
Dmax
(2)
The quantitative porosity measurement is based on the assumption that the rock matrix dilutes the 14
C-PMMA. If the pore sizes are under the resolution of the autoradiography (usually>0.1µm), the major frac-tion of the emittedβ-radiation is attenuated by the rock and the porosity calculation is applicable. The local rock porosity (φ) is obtained by the calculation of the 14C
tracer contents in an analyzed area (Equation 3):
φ%=β
A
A0
100% (3)
TABLE I
Location, classification, texture features and mineral contents from each sample obtained by point counting (1500 points) of thin sections. Legend: sericite (ser), chl (chlorite), calcite (cal), opaque minerals (op),
hematite (hem), zircon (zr) and monazite (mz).
Sample A B C D
Location Bloco do Butiá Cerrito Valdo Teixeira Valdo Teixeira Sampling references BB0384 (100m depth) Surface quarry VT02 (58.7m depth) VT02 (58.8m depth)
Texture Equigranular Porphyritic Porphyritic Equigranular Classification Perthite granite Monzogranite Syenogranite Perthite granite
Primary (magmatic) minerals (volume %)
K-feldspar 62.8 50.5 44.5 57.4
Quartz 26.4 25 33 20.6
Plagioclase 4.6 16 5.2 4
Biotite 0.6 3.5 – –
Amphibole 3.6 3 – –
Accessory (zr, mz) <1 <1 <1 <1
Secondary (hydrothermal) minerals (volume %)
<2 (chl, cal) <2 (chl, cal) ser (2.4), cal (2.8), chl ser (3.9), cal (2.8), chl (5.5), op (0.9), hem (5.7) (4.6), op (0.6), hem (5.8)
β = ρe
ρ0 (4)
ρeis the sample density (g/cm3) andρ0is the density of MMA polymer, which is 1.18. The plot of porosity histograms allows the observation of the relative porosity frequency for individual zones of rocks. The porosityεt of a whole measured area is obtained from the porosity distribution by taking a weighted average (Equation 5), where Ar ean is the area of pixeln, andεn is the local porosity corresponding to pixeln.
εtotal=
n Ar eanεn
n Ar ean
(5)
Finally, the intensity levels observed in the autora-diography are proportional to the14C-PMMA tracer
con-tents in the rock porous spaces according to relations (1), (2) and (3). Lower intensities of grey level on the film represent 100% porosity.
MINERALSTAINING
After autoradiography, the primary minerals were identi-fied on unaltered rock surfaces by staining procedure and digital processes to obtain an estimative of volume (%) of rock forming minerals in that area. As mafic minerals are highly susceptible to alteration, this technique had
the aim to test the influence of different mafic contents on total porosity of unaltered rocks. Altered rocks were excluded from this process because staining techniques are similar for carbonates and mafic minerals. First, the samples were etched with hydrofluoric acid during 30 seconds, washed with distilled water, immersed in a K-ferrocyanide solution (Müller 1967) for 12 hours to stain the ferro-magnesian minerals blue and dried at room tem-perature for 1 hour. Second, the colored surfaces were etched with hydrofluoric acid during 30 seconds, washed with distilled water, immersed in a Na-cobaltinitrite so-lution (Hutchison 1974) for 1 minute and dried at room temperature for 1 hour. The latter step stain the feldspars yellow, plagioclase white and quartz grey and did not affect ferro-magnesian minerals that had already been stained.
sample were individualized after threshold processes on each phase.
RESULTS
PETROGRAPHIC ANDAUTORADIOGRAPHIC
OBSERVATIONS
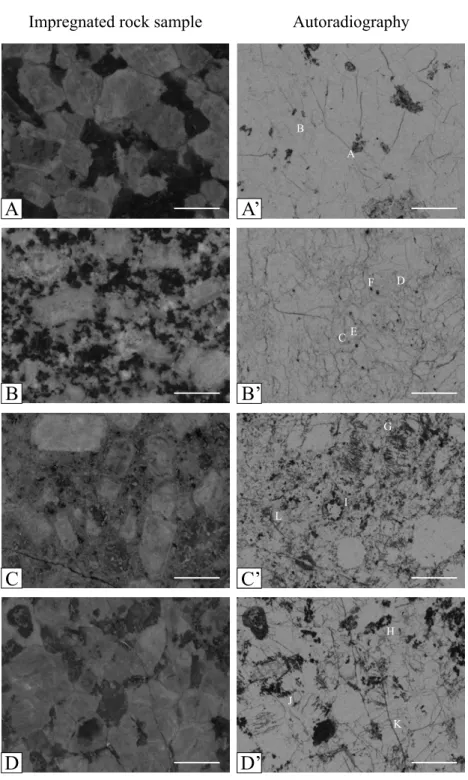
Figure 2 shows the original (not treated) rock samples (A to D) and its corresponding autoradiographies (A’ to D’) of the same area. From autoradiography images of impregnated samples, thin sections and SEM observa-tions, several types of pores were identified, i.e. these data are used for porosity qualitative identification, be-fore quantification of total and local porosity of rocks. The nomenclature of pore types follows the suggestion of Siitari-Kauppi (M. Siitari-Kauppi, unpublished data): (i) transgranular, that transect mineral grains; (ii) inter-granular, represented by a connected network between grains; and (iii) intragranular (inside grains), that can be found connected to another pore type or isolated, as a residual pore. It is also important to point out that rocks usually called “unaltered” have always minor amounts of secondary minerals, as observed in the studied sam-ples (Table I).
In sample A, porous zones observed in the autora-diography are mainly associated to transgranular and in-tragranular microfissures and wider patches of different grey-level intensity. The transgranular microfissure net-work predominates and is regularly distributed through the equigranular sample, affecting all rock forming min-erals. These fissures are always unfilled or filled by a thin film of hematite. They have commonly homoge-neous grey level intensity in the autoradiography and long linear forms with average 4 µm aperture. It can be better observed on alkali feldspar and quartz grains, due to volumetric predominance and lighter grey level of these minerals in the autoradiography image when compared to microfissures. Intragranular porosity is as-sociated to linear microfissures with 2 to 3 µm aper-ture, usually interconnected with transgranular ones that locally coincide with cleavage plans of mafic minerals (Fig. 3A). Twin plans and perthitic exsolution structures do not correspond to porous zones (Fig. 3B) and inter-granular microfissures are observed only locally. Wide patches with mean grey level intensity in the
autora-diography were identified after petrographic studies as amphibole and minor amounts of biotite with 0.8 to 2 mm grain size and locally to slight sericitization of feldspars. Different grey level are observed inside the limits of mafic minerals: darker zones in the autora-diography (higher porosity) represent high density of microfissures or alteration of amphibole (±biotite) to chlorite through cleavage planes, sometimes associated to lesser amounts of calcite, hematite and pyrite. Lighter zones of lower porosity correspond to unaltered zones of the same minerals and to quartz inclusions.
In sample B, the porphyritic texture of the rock al-lows us to differentiate two main sites with visual con-trasting porosity intensity on autoradiography: (i) phe-nocrysts (alkali feldspar) and (ii) matrix (alkali feldspar, plagioclase, quartz, amphibole and biotite). Both sites comprise an interconnected network of randomly dis-tributed trans-, intra- and intergranular microfissures af-fecting all rock forming minerals. Transgranular mi-crofissures are always unfilled or partly filled by a thin film of hematite. Phenocrysts represent ample lighter areas on the autoradiography, where transgranular and intragranular microcracks occur with linear forms with average 3 µm aperture and intergranular microfissures contour grain boundaries (∼3µm aperture). The weak alteration of plagioclase from rapakivi mantling rims provides a bad visual estimative of alkali feldspar phe-nocrysts contents on autoradiography image, as alkali feldspar grains seems to be smaller (only the core is completely preserved) than they really are. The fine grained matrix provides an interconnected network of tortuous intergranular microfissures with 1.5 to 8 µm aperture (Fig. 3C), which yields a mean grey level inten-sity of the matrix in the autoradiography. This grey level intensity of the matrix is also provided by the presence of amphibole and biotite (in general<0.6 mm size), usu-ally less fractured and altered than in sample A, and in minor amounts to sericitization of plagioclase and slight alteration to chlorite and calcite. The intragranular mi-crofissures of mafic minerals are mainly represented by opened cleavage plans with 1.3 to 4µm width (Fig. 3D and E). Associated quartz and alkali feldspar represent always the lower porosity minerals of the matrix on the autoradiography.
Fig. 3 – SEM images in backscattered mode (A to L) of specific sites indicated by the white letters on autoradiographies (Figure 2, A’ to D’). A – intragranular microfissures in amphibole grain (sample A) that locally coincide with cleavage plans; B – perthitic exsolution texture and twin plans of alkali feldspars (sample A) do not correspond to porous sites. Note transgranular microfissure crosscutting feldspar grain (white arrow); C – fine gained matrix (sample B) yields a narrow and tortuous interconnected network of intergranular microfissures; D and E – intragranular microfissures in mafic minerals (sample B) are associated to cleavage plans of amphibole (D) and biotite (E) and intergranular ones at grain boundaries. Mafic minerals are less fractured and altered in sample B than in sample A; F – dark dots on autoradiography from sample B are associated to zircon and/or monazite crystals; G – highly connected network of tortuous intergranular microfissures from sample C, which is tighter than the same porous zones from sample B due to finer grain size of the matrix; H – pseudomorphic replacement of original biotite and amphibole for chlorite (sample D). Note that open cleavages are wider that on sample B; I – high porous zones (sample C) associated to crystallization of lath-shaped ilmenite particles; J – micro inclusions of hematite on feldspar grains (sample D); K – calcite veinlets and associated microfissures (sample D); L – very fine grained chlorite crystallizing around a thin microfissure. Key: amph (amphibole), K-f (alkali feldspar), qtz (quartz), bte (biotite), zir (zircon), ilm (ilmenite), hem (hematite), chl (chlorite) and cal (calcite).
corresponds mainly to zircon and monazite crystals (Fig. 3F).
As for the previous samples, ample light zones (low porosity) on autoradiographies of samples C and D com-prise quartz and alkali feldspar. High porosity (darker) zones are mainly associated to (i) microfissures and (ii) hydrothermal alteration of original rock forming miner-als. The microfissure density and width in these samples is higher than for samples A and B. It comprises a marked and connected network of trans-, intra- and intergranular pores with contrasting forms and mineral fillings, de-pending on rock texture.
In sample C, transgranular microfissures with 2 to 4µm aperture have linear to slightly tortuous forms in both the rock matrix and phenocrysts (alkali feldspar and quartz). It is highly connected with a tight network of tortuous intergranular microfissures with 1 to 2µm aperture (Fig. 3G) that follows grain boundaries. In sam-ple D, long linear transgranular microfissures with 2.5 to 9 µm aperture (average 4 µm) predominates over all rock forming minerals, commonly connected with a network of intragranular microfissures, besides minor amounts of intergranular ones are locally observed.
minerals and filling of microfissures is characteristic for samples C and D, which allows the observation of ample areas with variable grey levels (and consequently poros-ity) on autoradiographies. It is represented mainly by the following secondary features:
(a) pseudomorphic replacement of original mafic min-erals for chlorite (Fig. 3H) and sericite (±calcite). These minerals are associated to low grey level (high porosity) areas on autoradiographies and shows wider porosity paths in open cleavages (up to 12µm aperture) than in samples A and B. They are locally aligned or in clusters that can form rims around feldspar grains;
(b) destabilization of ilmenite (Fig. 3I), generate high porosity sites (up to 4µm aperture) mainly in the core of the crystals, which corresponds to dark zones on the autoradiography;
(c) micro inclusions of hematite (Fig. 3J) or very fine grained chlorite±sericite±calcite crystallization mark commonly the compositional zoning of mag-matic alkali feldspars which correspond to medium grey level intensity on autoradiography. These sec-ondary phases were observed in either the border or the core of feldspar grains as patches or over perthite exsolution structures;
(d) calcite veinlets (Fig. 3K) with up to 150µm width and very fine grained chlorite crystallized through infillings of microfissures (Fig. 3L) represent the al-teration minerals in longer linear transgranular and in tortuous inter and intragranular porosity respec-tively;
(e) mafic microgranular enclaves (MME) were ob-served only locally on sample C. They are com-pletely altered to chlorite±sericite±calcite and represents highly altered and porous zones. When present, these petrographic sites increase the poros-ity of the analyzed surface and comparison between original rock porosity would have no significance. For that reason, zones containing MME were ex-cluded from total porosity quantification of that sample.
MINERALOGY OFQUANTIFIEDAREASAFTERSTAINING
The main rock-forming minerals observed in the stud-ied samples were quartz, alkali feldspar, plagioclase and mafic minerals (amphibole and biotite). The mafic min-eral contents calculated on binary (black and white) im-ages of selected areas from samples A and B obtained after digital threshold of stained surfaces are 7.4% and 3.5% respectively (Fig. 4). Quantification of mafic min-eral contents in altered samples by staining were not used, however they have similar values between por-phyritic (A and D, ∼7%) and equigranular (B and C, ∼4%) samples. Tectosilicate contents (%) are Qz = 28.1 and KF = 64.5 for sample A and Qz = 27.3, KF = 58.2 and Pl = 11 for sample B.
POROSITYQUANTIFICATION
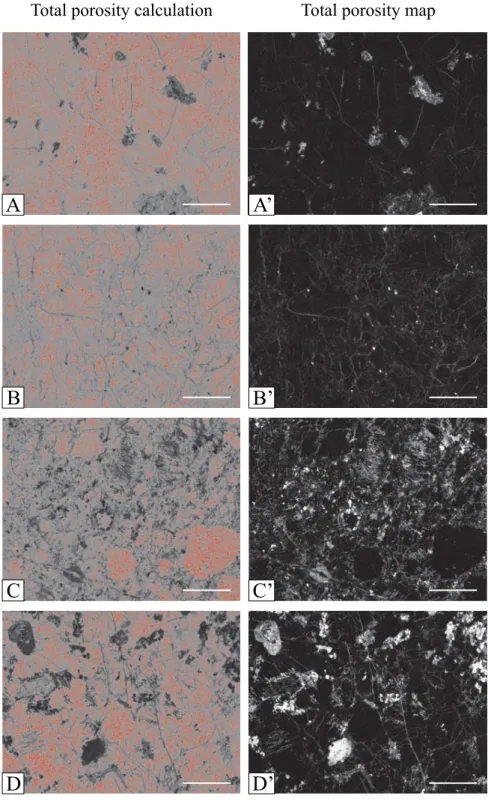
Total rock porosity of each sample was calculated using the Autoradio© software. In the image generated
dur-ing total rock porosity calculation (Fig. 5A–D), small red points correspond to zones with very low porosity (near null) that were not computed. The correspond-ing total rock porosity map (Fig. 5A’–D’) is obtained after transformation of the logarithmic ratio grey level of autoradiographies to a linear one, which is visually an easier way to compare between different porosity values in selected areas of the samples. However, this process of transformation generates an image with inverse tonal-ity, when compared to the autoradiography, i.e. in this case, black represent the lowest porosity areas and white the highest porosity ones.
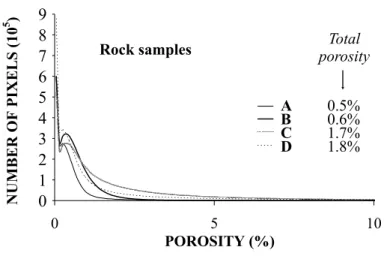
Calculated values of connected porosity for 4.4 cm2 rock surfaces are 0.5% for sample A, 0.6% for sample B, 1.7% for sample C and 1.8% for sample D. The poros-ity histograms of rocks represented in a log-linear scale (Fig. 6) show similarities between samples with the same textural characteristics (porphyritic or equigranu-lar). Images from samples A and D have the highest quantity of pixels with 0.25% porosity and samples B and C with 0.35% porosity respectively. Porosity curves increases up to 4% for unaltered rocks and up to 10% for altered rocks.
Fig. 4 – Binary (black and white) image generated by threshold of unaltered samples A (A) and B (B) using Adobe Photoshopsoftware after selective staining. Black corresponds to mafic minerals (amphibole and biotite) contents in each sample. Scale bars are 0.5 cm length.
6% when associated to calcite veinlets and 5 to 8.5% when very fine grained chlorite is present.
The mineral-specific porosity in all samples was es-timated on the autoradiographies using rectangular areas with homogeneous grey-level zones in each identified mineral phase. It shows constant values between 0.2 to 0.4% for quartz and alkali feldspar in all samples. Av-erage of mineral porosity in samples A and B was 1 to 1.8% for amphibole, 1.7 to 2% for biotite and 12% for accessory minerals (zircon and monazite). In samples C and D mineral sites shows porosity values up to 4.5% for calcite altering mafic minerals or feldspars, 4 to 7% for sericite + chlorite + calcite altering mafic minerals, 8% for oxide + very fine grained chlorite crystallized over feldspars, 1.5 to 5% for sericitization of feldspars, 8% for destabilized ilmenite and 14% for altered micro-granular mafic enclaves.
DISCUSSION AND CONCLUSIONS
Natural microcracks in granitic rocks are commonly as-sociated to (i) thermal contraction during cooling, (ii) stress relaxation during uplift or unroofing and (iii) tonic deformation (Kowallis and Wang 1983). No tec-tonic deformation was visually recognized near sam-pling locations during fieldwork, however infillings of secondary veinlets can generate additional microcracks in propylitic-altered rocks.
14C-PMMA porosity results of total rock
calcula-tions were compared with data obtained by the same
method on granitic rocks worldwide. Unaltered, fairly and strongly altered granitic rocks show commonly 0.1 to 0.5%, 0.4 to 1% and 1 to 5% porosity respectively (Siitari-Kauppi et al. 1997, Hölttä et al. 1997, Johans-son et al. 1998). Consequently, the obtained data on unaltered (0.5% to 0.6%) and propylitic-altered (1.7% to 1.8%) granitic samples from Lavras do Sul region are in agreement with the range of porosity values for simi-lar rocks reported by other authors (Sardini et al. 2006). Results of total rock porosity between unaltered rocks (A and B) are quite similar, if we take into account that sample B (inactive quarry) was exposed to surface alteration for a longer period of time (up to 50 years) than sample A (borehole). However, slightly differences in the weathering and the slight propylitic alteration be-tween unaltered samples are possible. Surface exposition through time yields a low increase in total rock porosity as argued by other authors (Guillot et al. 2000, Thuro and Scholz 2003, Iñigo et al. 2000).
Fig. 6 – Histogram of total rock porosity (%) calculated for samples A, B, C and D. See text for discussion.
data, those different textural characteristics seem to have no effective influence on the fluid flow through very low porosity media as unaltered granitic rocks. Moreover, slight increase of the measured total porosity of sam-ple B is expected due to its higher contents of accessory minerals (zircon and monazite), which contain radioac-tive elements excited during sample irradiation. Con-cerning mafic minerals, amphibole predominates largely over biotite. These grains are in general well preserved and differences of mafic mineral contents or extension of surface areas (in clusters or as single grains) between samples do not modify their connected (total) porosity value. Total porosity histogram for these rocks is com-patible with specific porosity of individual sites, which shows predominance of up to 4% porosity. The range of porosity values for mafic minerals increases linearly with open cleavages, intragranular microfissures and chloriti-zation contents of these petrographic sites.
The main difference between samples C and D com-prises also the rock texture. Both samples were collected in the same depth (borehole) and for that reason they were exposed to identical events of primary and sec-ondary porosity formation (i.e. microcrack evolution, hydrothermal alteration and weathering). As for unal-tered rocks, the occurrence of intergranular microfis-sures did not allowed high variations in the measured porosity between samples C and D (1.7 and 1.8%). His-tograms of total porosity have higher maximal values
than for unaltered rocks, and porosity values vary up to 10%. These data agree with porosity calculated for indi-vidual petrographic sites. Opened cleavages, carbonate and chlorite veinlets and diffuse alteration (chloritization, sericitization) of original minerals allow an effective in-crease in total porosity of these samples in comparison to values obtained for unaltered rocks.
From the bulk results we can consider the follow-ing aspects:
• spatial distribution of porosity values is dependent on the mineralogy (either primary or secondary), as reported in previous papers (Oila et al. 2005, Sar-dini et al. 2006);
• variable porosity values within a single mineral grain is dependent on its alteration degree or imper-fect development of crystal growth;
• undeformed quartz and unaltered alkali feldspar have null to very weak porosity values and felds-par sericitization (weathered or hydrothermal) in-creases its porosity and total porosity of rocks;
• high mafic mineral contents and clusters increase conditions to form secondary porosity if they are previously altered or fractured.
The results obtained in this study shows that original porosity of granitic rocks with different textures (sam-ples A and B) have no significant influence on the dif-ferences of diffusion (width) of later phyllic alteration halos around veins observed during field works between central and border facies granitoids.
Secondary porosity represented by propylitic-al-tered rocks (samples C and D) has higher porosity val-ues either in total or specific mineral quantifications be-tween different rock textures. Propylitic alteration com-monly develops in response to low water/rock ratio in ample areas of hydrothermal systems (Berger and Velde 1992, Titley 1982) and phyllic alteration, on the con-trary, needs high fluid/rock ratio in narrow zones of ac-tive fluid flow (fractures, veins) to develop.
Early and widespread propylitic alteration in the studied area may have provided additional porosity for rocks due to fluid interaction (Holl et al. 1997) through cleavage plans, microcracks and secondary minerals of higher porosity prior to phyllic alteration stage near quartz veins, but the variability of diffusion width ob-served on alteration halos between granitic facies might be produced during phyllic alteration. If true, central and border facies were influenced by different fluid/rock ratio or fluid composition during phyllic alteration stage. That hypothesis must also consider variations in the hydrothermal products, timing between granitic facies emplacement and/or paleoenvironment of rocks (depth, superimposing alteration stages, tectonic deformation and location within the granitic body). Moreover, micro-granular mafic enclaves (MME) commonly found in the border facies are also highly porous zones that if present can locally contribute to increase the hydrothermal fluid diffusion.
The14C-polymethylmethacrylate (14C-PMMA)
im-pregnation method, coupled with petrographic (optical and through SEM) observations and digital image pro-cessing provides a valuable methodology to identify and quantify the porosity heterogeneities in hydrothermally altered rocks and specific minerals. The modeling of fluid flows and evolution of porosity in different stages
during hydrothermal alteration is also possible. The initial porosity (fairly altered, unaltered) and porosity generated during early alteration stages (propylitic) of these granitic rocks obtained by the14C-PMMA method
should be compared with other hydrothermal stages/ environments (phyllic alteration, around vein selvages) within the same locations to test the observation of por-osity evolution until its final stages. The recognition and quantification of the connective network and of alter-ation products observed in this study can be also used as a data basis for calculation of mass balance of alteration.
ACKNOWLEDGMENTS
This study was partly funded by Programa de Apoio de Núcleos de Excelência (PRONEX) / Fundação de Amparo à Pesquisa do Estado do Rio Grande do Sul (FAPERGS) – project 04/0825.3. The authors wish to thank Companhia Brasileira do Cobre (CBC) and Com-panhia Riograndense de Mineração (CRM) for providing access to drill core samples. Everton M. Bongiolo also thanks Conselho Nacional de Desenvolvimento Cien-tífico e Tecnológico (CNPq) for Ph.D. scholarship and Coordenação de Aperfeiçoamento de Pessoal de Nível Superior – Comité d’Évaluation de la Coopération Uni-versitaire avec le Brésil (CAPES-COFECUB) project (349-01/2003).
RESUMO
Este trabalho é uma aplicação do método14
propilitização, são maiores em rochas equigranulares do que em porfiríticas, o que não pode ser explicado pelo valor seme-lhante da porosidade original dessas rochas. A difusão diferen-cial da alteração fílica foi, portanto, condicionada por variações estruturais ou da razão fluido/rocha entre as facies equigranular e porfirítica durante este estágio hidrotermal posterior.
Palavras-chave: quantificação de porosidade, método 14 C-polimetilmetacrilato, porosidade de granitos, alteração hidro-termal, alteração propilítica, Lavras do Sul.
REFERENCES
BERGERGANDVELDEB. 1992. Chemical parameters con-trolling the propylitic and argillic alteration process. Eur J Mineral 4: 1439–1454.
DUBOISC, COUCHOTP, ALVAREZCALLEJAA, BOEGLIN
EANDCHAMBAUDETA. 1998. Specific mercury poro-simetry for low-porosity materials. Meas Sci Technol 9: 2016–2022.
GASTALMCPANDLAFONJM. 1998. Gênese e evolução dos granitóides metaluminosos de afinidade alcalina da porção oeste do escudo Sul-riograndense: Geoquímica e isótopos de Rb-Sr e Pb-Pb. Rev Bras de Geocienc 28: 11–28. GUILLOTL, SIITARI-KAUPPI M, HELLMUTH K-H, DU
-BOIS C, ROSSY M ANDGAVIGLIO P. 2000. Porosity changes in a granite close to quarry faces: quantification and distribution by14C-MMA and Hg porosimetries. Eur Phys J AP 9: 137–146.
HELLMUTHK-H, SIITARI-KAUPPIMANDLINDBERGA. 1993. Study of porosity and migration pathways in crys-talline rocks by impregnation with14 C-polymethylmeta-crylate. J of Contam Hydrol 13: 403–418.
HOLL A, ALTHAUSE E, LEMPP C ANDNATAU O. 1997. The petrophysical behavior of crustal rocks under the in-fluence of fluids. Tectonoph 275: 253–260.
HOLTTAP, SIITARI-KAUPPIM, HAKANENM, HUITTIT, HAUTOJARVIAANDLINDBERGA. 1997. Radionuclide transport and retardation in rock fracture and crushed rock column experiments. J of Contam Hydrol 26: 135–145, HUTCHISONCS. 1974. Laboratory handbook of petrographic
techniques, J Wiley & Sons, New York, USA, 527p. IÑIGOAC, VICENTE MA ANDRIVESV. 2000.
Weather-ing and decay of granitic rocks: its relation to their pore network. Mech Mater 32: 555–560.
JOHANSSON H, SIITARI-KAUPPI M, SKÅLBERGM AND
TULLBORGEL. 1998. Diffusion pathways in crystalline rock-examples from Äspö-diorite and fine-grained gran-ite. J of Contam Hydrol 35: 41–53.
KOWALLISBJANDWANGHF. 1983. Microcrack study of granitic cores from Illinois deep borehole UPH-3. J Geo-phys Res 88: 7373–7380.
MÜLLERG. 1967. Methods in sedimentary petrology. In: ENGELHARDTWVET AL. (Eds), Sedimentary petrol-ogy, v. I, Schweizerbart’sche, Stuttgart, p. 163–167. NARDILVS ANDLIMAEF. 1985. A Associação
Shosho-nítica de Lavras do Sul, RS. Rev Bras de Geocienc 15: 139–146.
NARDILVSANDLIMAEF. 2000. O magmatismo Shosho-nítico e Alcalino da Bacia do Camaquã – RS. In: HOLZM
ANDDEROSLF (Eds), Geologia e Estratigrafia do Rio Grande do Sul. Editora Gráfica da UFRGS, Porto Alegre, RS Brasil, p. 119–131.
OILAE, SARDINIP, SIITARI-KAUPPIMANDHELLMUTH
K-H. 2005. The14C-polymethylmetacrylate (PMMA) impregnation method and image analysis as a tool for porosity characterization of rock-forming minerals. In: HARVEYPKET AL. (Eds), Petrophysical properties of crystalline rocks. Geol Soc London S Publ 240: 335–342. REMUSMVD, HARTMANNLA, MCNAUGHTON NJAND
GROVESDI. 2000. Distal Magmatic-Hydrothermal Ori-gin for the Camaquã Cu (Au-Ag) and Santa Maria Pb, Zn (Cu-Ag) Deposits, Southern Brazil. Gondwana Res 3: 155–174.
SARDINIP, SIITARI-KAUPPIM, BEAUPORTDANDHELL
-MUTHK-H. 2006. On the connected porosity of mineral aggregates in crystalline rocks. Am Miner 91: 1069–1080. SCHILDM, SIEGESMUNDS, VOLLBRECHTAANDMAZU
-REKM. 2001. Characterization of granite matrix porosity and pore-space geometry byin situand laboratory meth-ods. Geophys J Int 146: 111–125.
SIITARI-KAUPPIM, LINDBERGA, HELLMUTH K-H, TI
-MONENJ, VÄÄTÄINENK, HARTIKAINENJANDHAR
-TIKAINENK. 1997. The effect of microscale pore struc-ture on matrix diffusion – a site specific study of tonalite. J of Contam Hydrol 26: 147–158.
THUROKANDSCHOLZM. 2003. Deep weathering and al-teration in granites – a product of coupled processes. In: PROCEEDINGS OF THEINTERNATIONALCONFERENCE ONCOUPLEDT-H-M-CINGEOSYSTEMS: Fundamen-tals, Modelling, Experiments and Application, 1, Stock-holm, Royal Institute of Technology (KTH), p. 1–6. TITLEYSR. 1982. The style and progress of mineralization
and alteration in porphyry copper systems. In: TITLEY
TREUTLER HC AND FREYER K. 1988. Die quantitative autoradiographie als methode der radioaktivitatsmessung. Isotopenpraxis 24: 220–223.