Intergroup Emotions, Perceived Threats and Hostility
against Foreigners: Comparing Brazil, Portugal, and Spain
Sônia Maria Guedes Gondim
1, * Orcid.org/0000-0003-3482-166XJosé Luis Álvaro-Estramiana
2Orcid.org/0000-0002-3017-0305
Cícero Roberto Pereira
3, 4Orcid.org/0000-0003-3406-3985
Leôncio Camino
4Orcid.org/0000-0002-8666-7898
Ana Raquel Torres
4Orcid.org/0000-0002-3161-0309
Alícia Garrido-Luque
2Orcid.org/0000-0002-2785-5071
Elza Maria Techio
1Orcid.org/0000-0002-8229-7674
João Almeida Barreiros
3Orcid.org/0000-0002-9563-6911
Raquel Lorente-Clemares
2Orcid.org/0000-0001-8940-4949
Patrícia Elbereth Alonso-Flores
2Orcid.org/0000-0002-3519-6387
––––––––––––––––––––––––––––––––––––––––––––––––
1
Universidade Federal da Bahia, Salvador, BA, Brasil
2Universidad Complutense de Madrid, Madrid, Spain
3Universidade de Lisboa, Lisboa, Portugal
4Universidade Federal da Paraíba, João Pessoa, PB, Brasil
Abstract
This study analyzed whether hostility towards foreigners perceived as competitors in the labor market would be related to the perception of threat (symbolic and economic) and negative intergroup emotions. 270 people between 18 and 63 years participated. In Brazil (N = 89), mostly men (59%) and average age 32.5 years; In Portugal (N = 87), mostly men (56.3%) and average age 39.9 years; in Spain (N = 94), mostly women (53.2%) and average age of 32.8 years. The results (t-test, analysis of variance and multiple regressions) indicated that in Spain negative emotions are associated with less hostility
––––––––––––––––––––––––––––––––––––––––––
* Mailing address: Rodrigo Argolo, 293, Apto. 502, Rio Vermelho, Salvador, BA, Brazil 41940-220. Phone: (71) 9382-2233. E-mail: [email protected]
towards immigrants; In Brazil, positive emotions are associated with hostile attitudes. In Portugal, the relationship between positive emotions and hostility is positive, but not signifi cant. The symbolic threat was the best predictor of hostility only in the Brazilian sample. Positive emotions predispose to a greater kindness towards foreigners in the three countries. The main conclusion of the study is that the economic crisis does not seem to be associated with the perception of competitiveness of foreigners in the local labor market and hostility towards this social group.
Keywords: Immigration, comparative study, intergroup emotions, discrimination.
Emoções Intergrupais, Ameaças Percebidas e Hostilidade
para com Estrangeiros: Comparando Brasil, Portugal e Espanha
Resumo
O estudo analisou se a hostilidade para com estrangeiros percebidos como concorrentes no mercado de trabalho estaria relacionada com a percepção de ameaça (simbólica e econômica) e as emoções intergru-pais negativas. Participaram 270 pessoas entre 18 e 63 anos, assim distribuídas: Brasil (N = 89), idade média de 32.5 anos, maioria de homens (59%); Portugal (N = 87), idade média de 39.9 anos, maioria de homens (56.3%); e Espanha (N=94), idade média de 32.8 anos, maioria de mulheres (53.2%). Os resultados do Teste-t, análise da variância e regressões múltiplas indicaram que enquanto na Espanha emoções negativas se associam a menos hostilidade para com imigrantes, no Brasil é a expressão de emoções positivas que se encontra associada a tais atitudes hostis. Em Portugal a relação entre emoções positivas e hostilidade é positiva, mas não signifi cativa. A ameaça simbólica foi o melhor preditor de hostilidade somente na amostra brasileira. Emoções positivas predizem maior amabilidade para com estrangeiros nas amostras dos três países. A principal conclusão do estudo é que a crise econômica não parece estar associada com a percepção de competitividade do estrangeiro no mercado de trabalho local e a hostilidade para com este grupo social.
Palavras-chave: Imigração, estudo comparativo, emoções intergrupais, discriminação.
Emociones Intergrupales, Amenazas Percibidas y Hostilidad
contra Extranjeros: Comparando Brasil, Portugal y España
Resumen
Este estudio analizó si la hostilidad hacia los extranjeros percibidos como competidores en el mercado de trabajo estaría relacionada con la percepción de amenaza (simbólica y económica) y las emociones intergrupales negativas. Participaron 270 personas entre 18 y 63 años. En Brasil (N = 89), mayoría de hombres (59%) y edad media 32.5 años; en Portugal (N = 87), mayoría de hombres (56.3%) y edad media 39.9 años; en España (N = 94), mayoría de mujeres (53.2%) y edad media de 32.8 años. Los resultados (test-t, análisis de la varianza y regresiones múltiples) indicaron que en España las emocio-nes negativas se asocian a una menor hostilidad hacia los inmigrantes; en Brasil las emocioemocio-nes positi-vas están asociadas a actitudes hostiles. En Portugal la relación entre emociones positipositi-vas y hostilidad es positiva, pero no signifi cativa. La amenaza simbólica fue el mejor predictor de hostilidad sólo en la muestra brasileña. Las emociones positivas predisponen a una mayor amabilidad hacia los extranjeros en los tres países. La principal conclusión del estudio es que la crisis económica no parece estar asociada a la percepción de competitividad de los extranjeros en el mercado laboral local y la hostilidad hacia este grupo social.
The worldwide crisis and globalization have contributed to the current discussion about the phenomenon of migration across the world. Despite being a recurring theme, the contemporary scenario of changes in migration
fl ows between countries brings new elements to the discussion on global migration (e.g., Boski, 2013; Cerrutti & Parrado, 2015; Collier, 2013; Hunter, Luna, & Norton, 2015), especially for the psychology of intergroup relationships. There are growing social demands for a better understanding of attitudes towards foreigners and taking action to reduce confl icts between immigrants and natives of the receiving countries. Among other topics of interest are the economic and social benefi ts for the countries that send immigrants (e.g., António & Policarpo, 2001; Mulvey, 2011), for the receiving countries, and also for the immigrants themselves (e.g., Wagner, Christ, & Heitmeyer, 2010).
Data released by the World Bank reveal the importance of economic migration for the countries of origin, whose remittances sent from abroad contribute to local socio-economic devel-opment (e.g., Portes, 2009). But, if on one hand, the migration processes contribute to the devel-opment of the countries in the hope of reducing economic inequalities, on the other, they bring internal consequences for the recipient country, particularly in times of economic crisis, in which the struggle to fi nd jobs and for access to goods and services offered by these governments is associated with negative attitudes, prejudice, and discriminatory behavior against foreigners (e.g., Davidov & Meuleman, 2012; Facchini & Mayda, 2012; Gang, Rivera-Batiz, & Yun, 2013; Markaki & Longhi, 2012; Semyonov, Raijman, & Gorodzeisky, 2006; Sniderman, Hagendoorn, & Prior, 2004).
In this sense, the primary objective of this study is to analyze to what extent the hostility in dealing with foreigners is related to perceived threat (symbolic and economic) and negative in-tergroup emotions of natives towards foreigners perceived as strong competitors in the job mar-ket. The second objective is to analyze whether the relationships of threat and intergroup emo-tions (positive and negative) with hostility and
friendliness vary depending on the national context of three countries in different socioeco-nomic situations. Data from 2012 released by the World Bank reveal that there are differences in the human development index of Portugal (HDI = 0.81), Brazil (HDI = 0.73), and Spain (HDI = 0.88). However, Spain and Portugal were more affected by the global fi nancial crisis of 2008 than Brazil, since the latter has achieved signifi -cant economic growth in recent years, while the other two have experienced a reduction in eco-nomic activity. The main hypothesis to be tested in this study is that the impact of the threat on intergroup hostility will be greater in the two countries in crisis than in Brazil. Although this situation is changing since Brazil is facing a deep economic and political crisis, the study was made at the end of the economic cycle and the data presented corresponds to this specifi c peri-od we are referring to. This study contributes to the explanation of intergroup relations, particu-larly in times of economic crisis and competition for scarce resources, highlighting the diversity among countries (Faist, 2016). In addition, it can help in social support policies for foreigners who migrate to work.
The Role of the Perceived Threat
the confl ict can only achieve their goals if they defeat the other party. In addition, these theories assume that confl icts of interest contribute to increased threat perception, making the occur-rence of intergroup hostility more likely.
Accordingly, intergroup hostility is more likely to occur when two groups want to achieve the same goal, and where only one group can succeed (e.g., negative interdependence con-text). These hypotheses were tested in three fi eld experiments conducted by Sherif et al. (1961). In these studies, the structure of relations be-tween groups (competition vs. cooperation) was manipulated, resulting in greater discrimination in the contexts of competition (i.e., negative in-terdependence). In the contexts of cooperation (i.e., positive interdependence, or superordinate goals), on the contrary, there was a decrease in aggressiveness and, overall, reduced hostility against members of the “outgroup”. These re-sults were seen in other fi eld experiments (e.g., Ageev, 1990 cited in Platow & Hunter, 2001) and in the laboratory (Blake & Mouton, 1961). They have also received empirical support and ecological validity in studies conducted with representative population samples from various European countries, as exemplifi ed in the study by Quillian (1995), which used the Eurobarom-eter Survey database, and more recently, the study by Bello (2013) using data from the Euro-pean Social Survey.
Of major importance for the argument of this article, the psychological process that sustains the effects obtained in these studies is the development of a sense that members of the outgroup pose a threat to the goal of the ingroup to achieve its goal. The perception of threat, then, would be the cause of hostility against members of the outgroup. Objectively, the threat perception is a central factor for understanding “intergroup” tensions. The active psychological principle in the effect of the threat on hostility is the perception that the outgroup can decrease the well-being of the ingroup, and this justifi es defending the interests of the ingroup through hostile behavior towards outgroup members, perceived as the source of threat (e.g., Pereira, Vala, & Costa-Lopes, 2010).
Considering the role of confl icts of interest and the perception of threat in intergroup hostil-ity, the following hypotheses were proposed:
H1: The perceived threat (economic, sym-bolic, and security-related) from groups of for-eigners will be higher in countries that suffer greater impact from the economic crisis (Portu-gal and Spain).
H2: The perceived threat from foreign groups is a predictor of hostility toward the foreigner, especially in the two countries more affected by the economic crisis.
The assumption is that scarce jobs activate the perception of competition from foreign groups, which come to be seen as a threat to the survival and standing of the national group. Another assumption is that there would be greater similarity between the indicators of Spain and Portugal, due to the socio-economic crisis they are facing, differing from Brazil, which despite having a lower Human Development Index (HDI) than these two countries, at the time of this study, still experienced more favorable economic times.
The Role of Intergroup Emotions
It is recognized that the type of emotion of the individual is related to distinct behavioral in-tentions towards others (Fridja, Kuipers, & ter Shure, 1989). Anger leads to aggression against the other person, while guilt motivates repara-tory behavior. But emotions can also be con-sidered at the group level, with implications for behavioral intentions of group members towards other social groups (outgroups). The assessment process fi lls an important role in these relation-ships, since the way the other group is evaluated triggers emotions that activate certain action ten-dencies.
accord-ing to the view of the authors of this article, the emotions could also act independently of the perceived threat. In this case, positive attitudes toward foreigners would be associated with pos-itive intergroup emotions and would be respon-sible for friendliness toward such people, even in situations of higher competition for scarce jobs in the domestic market.
To sustain our arguments in the bi-dimen-sional perspective of intergroup emotions (nega-tive and posi(nega-tive), we distance ourselves some-what from the original approach to intergroup emotions theory (IET), whose focus is to explore the role of discrete emotions (e.g., fear, guilt) in intergroup relations. However, we converge with the IET where it affi rms that group level emotions are activated by a process of self-cate-gorization (self-stereotyping) that makes people see themselves as members of a group acting and moving collectively. The perception of belong-ing to a group activates social identity, by mak-ing each member act as they think that members of their group do. The group therefore becomes part of the self and comes to guide the behavior towards members of the other group (outgroup).
In summary, two psychological forces would be contributing to sustain these relation-ships between group emotions and action ten-dencies towards other groups: the intergroup ap-praisal process (how the other group is viewed) and emotional self-stereotyping (incorporation of an emotion that is believed to be the group’s; Mackie, Smith, & Ray 2008). The consequences of this twofold process would be the alertness, perception, information processing, judgment, decision making, and closeness (friendliness) or distance (hostility) behaviors toward the other groups.
In order to predict the capacity of intergroup emotions in a two-dimensional perspective, the study being described in this article, rather than emphasizing the relationship between discrete negative emotions and the types of behavioral tendencies towards outgroups, explored the predictive power of negative and positive emo-tions in the behavioral intenemo-tions of hostility and friendliness toward foreigners in the workplace. The assumption was that, in addition to testing
the strength of the association between per-ceived threat, negative intergroup emotions, and hostility toward groups of foreigners, what could also be explored was the explanatory power of the positive and negative intergroup emotions in friendliness (prosocial behavior) and hostility behavior toward these same groups.
Based on this understanding, the following hypotheses were formulated:
H3 (a) Negative intergroup emotions to-wards foreigners is a predictor of the perceived hostility toward the foreigner (avoidance behav-ior), (b) Positive intergroup emotions toward foreigners is a predictor of the perceived friend-liness toward the foreigner (intergroup engage-ment behavior).
Method
Participants
The study included participants from three countries: Brazil, Portugal, and Spain. In each country, national citizens aged between 18 and 63 years old participated in this research. In Brazil, 89 people participated, the majority being men (59%). The average age of respondents was 32.57 years (SD = 10.61), ranging from 18 to 63 years. Regarding educational level, 54.6% (n = 38) had a college and a graduate degree. Five participants (5.6%) had at least one foreign parent and 15 (16.9%) had at least one grandparent of another nationality. As to occupational status, 74% (n = 66) were active in the labor market. Most of them, 53.93% (n = 48), worked or had worked with foreigners, but work experience abroad was modest (n = 10), and not exceeding four years.
In Portugal, 87 people participated in the survey, the majority being men (56.31%). The average age of respondents was 39.94 years (SD
foreign-ers, and 21% (n = 19) had experience working abroad, and for 14 (16%) of them this experience exceeded one year.
In Spain, 94 people participated in the survey, the majority being women (53.2%). The average age of respondents was 32.84 years (SD
= 11.23), ranging from 18 to 60 years. Regarding educational level, 54.25% (n = 51) had a college and a graduate degree. Fourteen participants (14.9%) had at least one foreign parent and 12 (12.8%) had at least one grandparent of another nationality. As to occupational status, 54.25% (n=51) were active in the labor market. Most of them, 53.19% (n = 50), worked or had worked with foreigners, and 37.2% (n = 35) had experience working abroad, 33 (32%) of them with experience of over one year.
Instruments
Measure of Perceived Threat. The mea-sure was adapted from the scale developed by Stephan and Stephan (2000) of perceived threat to political security (“The arrival of these people can cause an increase of crime in the country”), economic security (e.g., “The resources and economic development of Brazilians (Portu-guese, Spaniards) are threatened by foreigners who come to work in the country”) and sym-bolic security (e.g., “our freedom and rights are threatened by foreigners who come to work in the country”). The measure has six items to be answered on a fi ve-point Likert scale ranging from (1) “Strongly disagree” to (5) “strongly agree”. Among the items, two refer to the per-ceived economic threat, three are related to the perceived symbolic threat, and one is about the perceived threat to political security. This items were validated in Portugal and Spain by Pereira et al. (2010) and in Brazil by Pereira and Vala (2011). In the current study, the internal consis-tency of the measure presented the following in-dicators: α=0.65 (Brazil), α=0.81 (Portugal), and
α=0.70 (Spain).
Measure of Intergroup Emotions and Feel-ings. The measure of feelings in intergroup rela-tions was based on previous studies on attribu-tions of emoattribu-tions between leaders and followers (Gondim, Álvaro-Estramiana, Schweiger-Gallo,
Sá, & Rios, 2008). The measure has 28 items de-scribing feelings and emotions present in group interactions, divided into two dimensions of 14 items each: positive sociability (e.g., friendship, solidarity, understanding) and negative socia-bility (e.g., insincerity, repulsion, superiority). The response scale is the fi ve-point Likert type, ranging from (1) “Defi nitely not what we feel” to (5) “Defi nitely is what we feel”. The wording of the question is: Next you will be presented with a list of feelings (emotions and affections) and we would like you to indicate how strongly you believe that each of them is present in the relationships between Brazilians (Portuguese or Spaniards) and the group of foreigners you named as a strong competitor in the job market.
In order to address the factorial validity of this measure we carried out a principal compo-nent analysis with oblique rotation which indi-cated, as solutions in each of the three samples, the following parameters: Brazil - two factors, positive emotions and negative emotions, ex-plaining 43.7% of the variance. The factor load-ings ranged from λ = 0.35 (sincerity) to λ = 0.77 (understanding) in the positive sociability di-mension (α = 0.90), and from λ = 0.49 (guilt) to
λ = 0.74 (insincerity) in negative sociability (α = 0.88); Portugal - two factors, positive and nega-tive emotions, explaining 43.27% of the vari-ance. The factor loadings ranged from λ = 0.33 (tolerance) to λ = 0.77 (friendship) in positive sociability (α = 0.86), and from λ = 0.44 (pity) to λ = 0.80 (shame) in negative sociability (α = 0.90); Spain - two factors, positive and nega-tive emotions, explaining 46.44% of the vari-ance. The factor loadings ranged from λ = 0.40 (tolerance) to λ =0.79 (sociability) in positive sociability (α =0.91), and from λ = 0.34 (pity) to λ = 0.74 (arrogance) in negative sociability (α = 0.87). This set of parameters demonstrate the factorial validity and reliability of the measure of intergroup Emotions and Feelings.
foreigners in the workplace that are targeted at the social group of foreigners perceived as com-petitors. The measure consists of 22 items divid-ed into two dimensions: Friendliness - intergroup engagement behavior; and Hostility - intergroup behaviors of avoidance and minimal cordiality. The wording of the question is: Indicate how much each of these behaviors is present in re-lations between Brazilian (Portuguese, Spanish) workers and the foreigners that you considered strong competitors in the domestic labor mar-ket. The response scale is the fi ve-point Likert style, ranging from (1) “Brazilians (Portuguese, Spaniards) defi nitely do not do that” to (5) “They defi nitely act that way.”
We used a principal component analysis with oblique rotation to address the factorial validity of this measures. Results showed two factors, friendliness and hostility, each with 11 items in each of the three samples: in Brazil, the two factors explained 43.7% of the variance. In the hostility dimension (α = 0.89), the factor loadings ranged from λ = 0.47 (imitating their accent to ridicule them in front of others) to λ = 0.80 (intentionally ruin some object of their work), and in the friendliness dimension (α = 0.72), the loadings ranged from λ = 0.32 (avoid name calling) to λ = 0.73 (speak well of them to others); in Portugal the two factors explained 48% of the variance, and factor loadings ranged from λ = 0.58 (make threatening phone calls) to
λ = 0.82 (making gestures of contempt in front of them - sighs, scornful looks, shrugging shoul-ders, etc.) in the hostility dimension (α = 0.90), and from λ = 0.37 (avoid spreading rumors about them) to λ = 0.78 (to agree with them, when in agreement with their ideas) in the friendliness dimension (α = 0.85). Finally, in Spain the two factors explained 49% of the variance. The fac-tor loadings ranged from λ = 0.57 (imitating their accent to ridicule them in front of others) to
λ = 0.85 (making gestures of contempt in front of them - sighs, scornful looks, shrugging shoul-ders, etc.), in the hostility dimension (α = 0.91), and from λ = 0.191 (avoid name calling) to λ =
1 The reliability analysis of the friendliness
dimen-sion showed no signifi cant improvement in the
0.83 (try work on the same team as them) in the friendliness dimension (α = 0.82). This set of pa-rameters demonstrate the factorial validity and reliability of the measure of perceived hostility and friendliness towards foreigner in the work-place.
Measure of Competition. Perceived compe-tition was measured by the following question: Considering the type of work you do (or plan to do), could you tell us (using the scale from 1 to 5) to what extent you consider the members of each group mentioned are more likely to com-pete for a job similar to the one you have (or plan to have), or of higher status in the domestic mar-ket, with 1 meaning “is not a strong competitor” up to 5 meaning “is a strong competitor.”
For Brazil the following groups were pre-sented: Africans (e.g., Angolans, Mozambicans), Asians (e.g., Chinese), North Americans (e.g., U.S. Americans), Latin Americans (e.g., Boliv-ians, Paraguayans, Uruguayans, and Argentin-ians), and Europeans (e.g., Portuguese, Span-iards, Germans). For Spain the following groups were presented: Africans (e.g., Moroccans, sub-Saharan countries), Asians (e.g., Chinese), North Americans (e.g., U.S. Americans), Latin Americans (e.g., Ecuadorians, Dominicans, and Argentinians), Europeans (e.g., Germans, Eng-lish, and French), and Eastern Europeans (e.g., Romanians, Ukrainians). For Portugal the fol-lowing groups were presented: Africans (e.g., Angolans, Mozambicans, Cape Verdeans, São Tomeans, Moroccans), Asians (e.g., Chinese), North Americans (e.g., U.S. Americans, Cana-dians), Latin Americans (e.g., Brazilians, Boliv-ians, Paraguayans, Uruguayans, ArgentinBoliv-ians, and Venezuelans), Europeans (e.g., Spaniards, English, Dutch, and French) and Eastern Euro-peans (e.g., Romanians, Ukrainians). The choice of examples included in parentheses sought to take into account the numerical and symbolic representativeness in each of the three countries where the study was conducted.
Data Collection Procedures
For data collection, an electronic question-naire (Globalpark’s EFS Survey) was used. We opted for data collection via laptop computers and internet access in the public areas of inter-national airports in Salvador (Bahia, Brazil) and Madrid (Spain), and at the National Library of Portugal. Thus the criterion that collection be taken in public-access locations was met.
The people present in the public-access areas of the airports and the library were approached by a member of the site research team (locals) and invited to fi ll out the online questionnaire. The sample, therefore, was not random. After confi rmation that the invited person was a native of the country, a member of the research team provided the initial clarifi cations and invited the subject to respond to the online questionnaire, using the research team’s notebook or their own portable via the access link. On the fi rst page of the study, the consent form for participation was presented, which the participant had to accept to go on responding to the survey. The maximum survey completion time was 25 minutes.
Data Analysis Procedures
Descriptive and Comparative Analyses (ANOVA and t-test) were used for the perceived threat, perceived competition and intergroup emotions to foreigners among the samples of the three countries considered. Correlation analysis tested the relationship between the main variables. Multiple regression analysis was used to investigate the extent to which the variables included in this study would be predictors of the perceived hostility and friendliness towards foreigners in each country.
Ethics Procedures
All participants were instructed by the re-searchers to individually answer all the items. The informed consent was obtained in the be-ginning of the questionnaire from all of them. They were informed that their answers were completely anonymous and that absolute confi -dentiality was guaranteed in the treatment of the data. All American Psychological Association
(APA) guidelines for research with humans were followed.
Results
The descriptive analyses and correlations, and in sequence, the results of the multiple re-gression analysis, designed to test the predictive value of antecedent variables in the perceived hostility and friendliness to foreigners in the workplace, will be presented fi rst.
Descriptive and Comparative Analyses
Perceived Threat from Foreigners. The results of an ANOVA with repeated measures revealed that there was an interaction effect be-tween country and the three types of threat, F
(2, 267)= 13.72; p<.001. Multiple comparisons with Bonferroni correction (with p<.05) indicate that the primary foreign threat is economic, for the three countries, especially for Spaniards (M
= 2.95; SD = 0.90), followed by Brazilians (M
= 2.72; SD = 0.83), and the Portuguese (M = 2.45; SD = 0.85). Regarding the other two types of threat (symbolic and security) the countries split, as the threat to security is the second most important for Portugal (M = 2.76; SD = 1.17) and Spain (M = 2.50; SD = 1.25), while for Brazil it is the symbolic threat (M = 2.39; SD = 0.72). In third place appears the symbolic threat for Spain (M = 2.36; SD = 0.88) and Portugal (M = 1.92;
SD = 0.83), while for Brazil it is the security threat (M = 2.08; SD = 1.18).
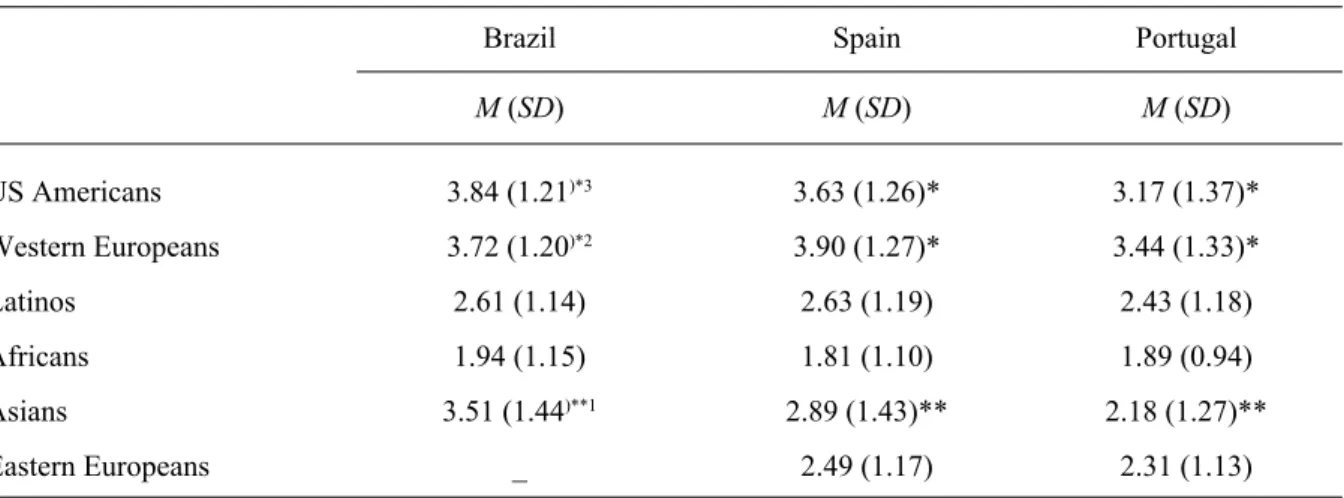
Perceived Competition from Groups of For-eigners. The results of the analysis of variance comparing perceived competition between na-tives and foreign groups are detailed in Table 1.
the means differ from the midpoint of the range, except for the Americans. Western Europeans are the strongest competitors.
Comparison of means of the general indi-cator of perceived foreign competition (overall average perception of competition, taking into account all target groups) between countries proved to be signifi cant, F (2, 269) = 10.34,
p<.001, Brazil holding fi rst place (M = 3.12; SD
= 0.79), followed by Spain (M = 2.89; SD =0.79), and lastly Portugal (M = 2.56; SD = 0.84). All the differences between the averages are signifi -cant according to the Bonferroni test with p<.05.
Intergroup Emotions. The results of the analysis of variance comparing the positive and negative emotions of natives in relation to foreigners perceived as stronger competitors showed signifi cant differences only for negative emotions, F (2, 269) = 3.63; p<.05, with the Bra-zilians showing the highest mean (M= 2.37; SD
= 0.78), followed by the Spaniards (M = 2.23;
SD = 0.68), and the Portuguese (M= 2.07; SD
= 0.75). In the comparison within each country, it was found that in all three countries, people reported expressing more positive emotions than negative ones towards foreign competitors: Brazilians (M = 3.06, SD = 0.78), t [t(88) = 5.32;
p<.001], Portuguese (M = 3.08, SD = 0.63), t
[t(86) = 8.40; p<.001], and Spaniards (M = 2.92,
SD = 0.71), t [t(93) = 6.03; p<.001].
Correlation Analysis
Table 2 presents the results of the correla-tions between the main study variables. The re-sults indicate that the economic and symbolic threats have the highest association with the study variables. The perception of friendliness is strongly associated with positive intergroup emotions, whereas the perception of hostility is strongly associated with negative intergroup emotions.
Regression Analysis
We used multiple regression analysis to investigate the extent to which the study variables would be predictors of perceived hostility and friendliness towards foreigners in each country, in order to test the hypothesis that the role of the perceived threat and negative emotions in the attitudes towards immigrants (hostility and friendliness) would be stronger in the countries more affected by the fi nancial crisis than in Brazil. To carry out this proposal, we used the dummy variable coding system for the countries variable: Dummy 1 (Brazil = 0, Portugal = 0, Spain = 1); Dummy 2 (Brazil = 0, Portugal = 1, Spain = 0). In this coding system, Brazil is used as the reference group against which each of the other two countries is compared. The other variables we included in the analyses
Table 1
Comparison of Perceived Competition among the Six Groups of Foreigners by Country
Brazil Spain Portugal
M (SD) M (SD) M (SD)
US Americans 3.84 (1.21)*3 3.63 (1.26)* 3.17 (1.37)*
Western Europeans 3.72 (1.20)*2 3.90 (1.27)* 3.44 (1.33)*
Latinos 2.61 (1.14) 2.63 (1.19) 2.43 (1.18)
Africans 1.94 (1.15) 1.81 (1.10) 1.89 (0.94)
Asians 3.51 (1.44)**1 2.89 (1.43)** 2.18 (1.27)**
Eastern Europeans _ 2.49 (1.17) 2.31 (1.13)
Note. In the Brazilian survey only the Western European group (Germans, Portuguese, Spaniards, French, etc.) was presented. The scale ranges from 1 to 5.1 size of effect 0.13, 2 size of effect 0.04, 3 size of effect 0.06.
Table 2
Correlations between the Study Variables
Variables M SD 1 2 3 4 5 6 7
Competition 2.86 0.84
-Economic threat 2.71 0.89 0.06
-Symbolic threat 2.13 0.86 -0.02 0.55**
-Positive emotions 3.02 0.71 0.15* -0.22** -0.21**
-Negative emotions 2.23 0.75 0.11 0.15* 0.13* -0.25**
-Friendliness 3.16 0.70 0.11 -0.17** -0.16** 0.49** -0.06
-Hostility 2.02 0.74 0.08 0.16** 0.18** 0.10 0.53** -0.23**
-Note. Due to the main focus of the research, only the symbolic threat (associated with social identity, which could be refl ected in friendliness) and the economic threat (associated with the global crisis) were included, the security threat being left out. * p< .001 and ** p<.05.
Table 3
Regression Analysis for Hostility and Friendliness
Variables
Hostility1 Friendliness2
b SE b β b SE b β
Constant 2.091 0.070 3.213 0.069
Spain_dummy -0.068 0.097 -0.043 -0.126 0.096 -0.086
Portugal_dummy -0.043 0.102 -0.027 -0.034 0.100 -0.023
Perc_compet_Z -0.117 0.087 -0.132 0.134 0.085 0.162
Econ_threat_Z -0.001 0.093 -0.001 -0.067 0.092 -0.085
Symb_threat_Z 0.215 0.095 0.249* -0.017 0.094 -0.021
Neg_emotions_Z 0.453 0.088 0.455** 0.023 0.087 0.025
Posi_emotions_Z 0.226 0.090 0.217* 0.278 0.088 0.286*
Spain*compet_Z 0.155 0.122 0.097 -0.167 0.120 -0.122
Portugal*compet_Z 0.213 0.118 0.143 -0.138 0.116 -0.099
Portugal*symb_threat_Z -0.248 0.143 -0.161 0.089 0.141 0.062
Spain*symb_threat _Z -0.155 0.126 -0.111 -0.060 0.124 -0.046
Spain*econ_threat_Z -0.028 0.124 -0.020 0.068 0.122 0.053
Portugal*econ_threat _Z 0.172 0.139 0.115 -0.002 0.136 -0.001
Portugal*neg_emotions _Z 0.100 0.128 0.058 0.109 0.126 0.068
Spain*neg_emotions _Z 0.154 0.135 0.083 0.000 0.133 0.000
Portugal*posi_emotions_Z -0.081 0.147 -0.040 0.360 0.144 0.187*
Spain*posi_emotions_Z -0.404 0.132 -0.230* 0.274 0.130 0.167*
were centered on their means. These centered variables were multiplied by the two dummy variables representing countries in order to obtain the interaction effects between countries, emotions, competition, and perceived threats. The signifi cant interactions were interpreted following the procedures recommended by Aiken and West (1991). These procedures allowed us to plot the interaction effects, and test for signifi cant differences between the slopes
The results of the regression analyses are presented in Table 3.
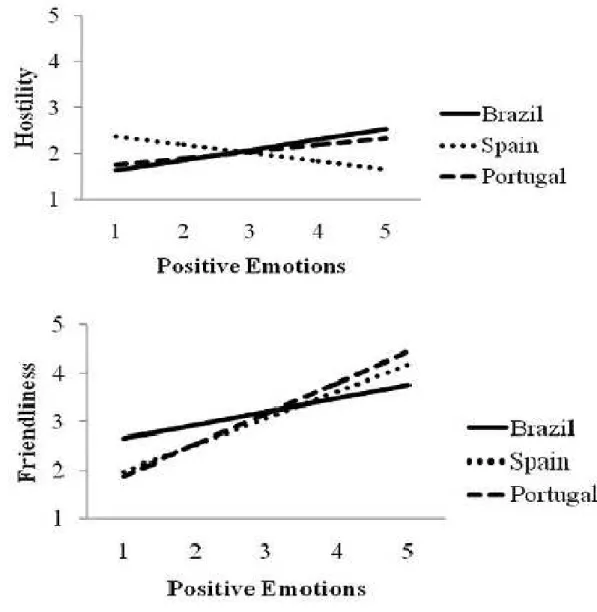
In relation to hostility, we found a signifi cant interaction effect between the expression of positive emotions and the Spain dummy variable, which compares the Spanish participants with the Brazilians. This interaction means that the effect of positive emotions on hostility is
different between Spain and Brazil. As can be seen in Figure 1a, in Spain the relationship between these emotions and hostility is negative, where the expression of positive emotions implies less hostility (b = -0.178, SE = 0.097; β = -0.17; p = .06), while in Brazil and in Portugal the relationship is positive and the strength of this relationship does not differ between the two countries, as indicated by the absence of significant interaction between the Portugal dummy variable and positive emotions. In Brazil’s case, however, the expression of more positive emotions is associated with attitudes more hostile towards immigrants (b = 0.226; SE = 0.090; β = 0.217, p < .01). In Portugal the relationship between positive emotions and hostility is also positive, but not signifi cant (b = 0.144; SE = 0.116; β = 0.139, ns.).
We also found a signifi cant effect of per-ceived symbolic threat, such that the greater this perception, the greater the hostility towards im-migrants. Similarly, the effect of negative inter-group emotions is also signifi cant: the greater the indicators of negative intergroup emotions towards immigrants, the greater also is the per-ceived hostility. Since these variables did not interact signifi cantly with the dummy variables (Portugal or Spain), the effect of the symbolic threat and negative emotions are the same in each of these countries.
With regard to friendliness, the two dummy variables (Spain and Portugal) interacted signifi -cantly with the expression of positive emotions. These interactions indicate that the relationship between these emotions and friendliness, in Por-tugal and Spain, is different from that observed in Brazil. In fact, analyzing Figure 1b, we can see that the effect of these emotions in the ex-pression of greater friendliness is stronger in Portugal and Spain than in Brazil. In Portugal, for example, the more participants indicated ex-pressing positive emotions, the stronger also was the friendliness toward immigrants (b = 0.638; SE = 0.114; β = 0.656; p < .001). A similar effect was observed in Spain, with the expression of positive emotions implying greater friendliness (b = 0.552; SE = 0.096; β = 0.568; p < .001). In Brazil, although the relationship between these two variables is positive, the strength of the relationship is lesser (b = 0.278; SE = 0.088;
β =0.286; p < .001). The interaction effects ob-served show that, in fact, positive emotions lead to greater friendliness in all the countries, but their strength is more pronounced in Spain and Portugal than in Brazil.
Discussion
Two principal objectives guided the study reported here. The fi rst was to analyze whether the perception of hostility-friendliness toward foreigners perceived as the strongest competi-tors in the labor market could be explained by perceived threat (symbolic and economic) and negative intergroup emotions. The second objec-tive was to analyze whether the relationships of threat and emotions (positive and negative) with
hostility and friendliness vary depending on the national context of three countries, in differing socioeconomic situations.
Contrary to the main hypothesis of this re-search, the economic crisis does not seem to be associated with the perception of greater com-petition with foreigners. Portugal and Spain, experiencing greater impact from the global fi -nancial crisis of 2008 and with high unemploy-ment fi gures, presented lower overall averages of perceived competition with foreigners than Brazil, a country that at the time of this research had more favorable economic indicators. Al-though the multilevel studies by Quillian (1995) and Bello (2013) have included contextual vari-ables, corroborating their explanatory power in negative attitudes towards immigrants, no clear evidence was found in this study of the relation-ship between perceived foreign competition in the domestic labor market and hostility towards foreigners. The results corroborate the studies by Davidov and Meuleman (2012), Facchini and Mayda (2012), and Gang et al. (2013), that actual economic factors are not suffi cient to ex-plain the negative attitudes towards foreigners in the workplace.
This interpretation that there is no evidence of a direct association between a country’s eco-nomic situation and the perception of hostility toward foreigners was again supported in the re-gression analysis results, in which the perceived symbolic threat variable (β= 0.249) appeared as a predictor only for the Brazilian sample. In the same bent, negative emotions served as predic-tors only for the Brazilian sample (β = 0.455). It is noteworthy, the predictor role of positive emo-tions in the samples from Brazil (β = 0.217) and Spain (β = -0.17), and that in the latter case it is negative.
Regarding friendliness towards the for-eigner in the workplace, the regression analysis results clearly suggest the predictor role of posi-tive emotions in the three samples, being stron-ger in Portugal (β= 0.656) and Spain (β =0.568), than in Brazil (β = 0.286).
not the country is in crisis, this variable predicts the perceived friendliness toward the foreigner in the workplace. This result does not corrobo-rate the main thesis of this study, that people from countries in crisis would have more nega-tive emotions toward foreigners, which would be refl ected in the indicators of perceived hostil-ity toward these social groups in the workplace.
Regarding the perception of threat, one has to consider that although Spain, one of the coun-tries in crisis, presented the highest average for economic threat, followed by Brazil, only the averages for perceived security threat followed the sequence: Portugal, Spain, and Brazil - most likely due to the high indicators of violence in Brazil, which makes it understandable that Bra-zilians do not perceive foreigners as contributing to the increase of violence in the country, seen as already quite high.
In order to better understand the relation-ship between threat perception, negative inter-group emotions, and negative attitudes toward foreigners, according to the model by Quillian (1995), claiming association not only with the economic crisis, but with the relative size of the country’s foreign population, we consulted the website of the International Organization for Migration (IOM)2 and made a rough calculation
of the foreign community in the three countries, taking as reference the two leading groups of foreigners considered strong competitors: Brazil (US Americans and Western Europeans - Por-tuguese, Spanish, and German), Portugal (West-ern Europeans - French, Spanish, German - and US Americans), and Spain (Western Europeans - Portuguese, German, French, and English - and US Americans). In the case of Brazil, US Americans and Western Europeans represent 0.05% of the country’s total population (nearly 191 million in 2010)3. In Spain these two
immi-grant groups represent a much higher
percent-2 http://www.iom.int/cms/en/sites/iom/home/
about-migration/world-migration.html
3 U.S. Americans approximately 14,000 and
West-ern Europeans 92,000. Source: http://www.ibge. gov.br/home/estatistica/populacao/censo2010/de-fault.shtm
age, 0.56% (of the country’s population of 45.8 million4). In Portugal the same groups represent
0.68% (of the country’s population of 10.6 mil-lion5). These data show clearly that Portugal
has the highest concentration of foreign groups considered competitors in the labor market, fol-lowed by Spain. However, the results from the samples in the three countries do not suggest an explanation from the measure of the immigrant community in the country.
Finally, we turn to the importance of ex-plaining why the results indicate that despite the country being in crisis or not, there is greater friendliness than hostility towards foreigners. One possible explanation is the profi le of the samples in the three countries: high educational level (Brazil, 54.6%; Spain, 54.25%; Portugal 62%); foreign descent (Brazil, 22.5%; Spain, 27.7%; Portugal, 9.1%); experience working with foreigners (Brazil, 53.93%; Spain, 53.19%; Portugal, 62%); and work experience abroad (Brazil, 11.23%; Spain, 37.2%; Portugal, 21%).
Specifi cities of each country may also help to explain this result, as has already been pointed out by Markaki and Longhi (2012). In Brazil’s case, for example, we may resort to the myth of the cordial reception of foreigners. In the view of Simai and Baeninger (2011), the myth is under-stood as a process of naturalization and mask-ing of internal ideological confl icts which denies the presence of xenophobic traits in the national identity, revealed by a history of exploitation of indigenous peoples, Africans, and internal mi-grants in Colonial Brazil.
Moreover, the welcoming of foreigners as a national identity trait is strengthened by the his-tory of miscegenation in Brazil (Freyre, 1940) and the transmission of that image via mass com-munication. Another explanation along the same lines can be found in Floriani, academic
coordi-4 U.S. Americans approximately 39,000 and
West-ern Europeans 218,000. Source: http://europa.eu/ about-eu/countries/member-countries/spain/in-dex_pt.htm
5 U.S. Americans approximately 10,000 and
nator of the Casa Latino-Americana (CASLA), in Curitiba, for whom, in the Brazilian imagina-tion, tolerance towards the arrival of foreigners stems from the ethnic-cultural hybridism in the population’s makeup (Assad, 2012).
Following the same line of interpretation, the explanation for the low hostility towards for-eigners among the Portuguese, when compared with Brazil and Spain, can be explained by the strong anti-racism norm owing to the ideology of Luso- tropicalism and the self-perception of the Portuguese of their role in the history of the colonization of other peoples (Vala, Lopes, & Lima 2008), functioning as if it were a form of compensation.
One of the main limitations of this study was the impossibility of including context variables in the analyses and doing a multilevel analysis of the predictors of hostility. This permitted us to take only indirect readings of the impact of the economic crisis on the perception of the natives of each country. Another important variable that was not included in the study and that could help explain the relationships of positive and nega-tive intergroup emotions with the perceptions of hostility and friendliness toward the migrant for-eigner is values (Davidov & Meuleman, 2012). As general, ideal and guiding principles of in-dividual and collective behaviors, values could act as mediators or moderators. We also suggest replicating the study with other samples of the three countries, particularly in Brazil, because of differences in educational level in the country, which are not properly represented in this study. Finally, it is important to add that the data collection in which this study is based was ob-tained at a moment in which the economic situation of the countries considered was quite different. Spain and Portugal were still experi-encing the consequences of an economic crisis with very high unemployment rates. On the con-trary, Brazil was still benefi ting from a period of economic growth. Since 2013 this situation has gradually changed; while Spain and Portugal are in a better economic situation, Brazil has entered a period of deep fi nancial and political turmoil. Nevertheless, the results obtained are important since the show how emotions (positive and
neg-ative), perception of competition and symbolic threat can explain attitudes towards immigrants.
Further studies could take into account the changes that have occurred in these countries and contrast the results with the ones obtain in this study. This will allow us to understand in a better way to what extend the economic situa-tion of a country can explain the prejudice and hostility in dealing with foreigners. Future stud-ies should also include contextual variables that would allow to perform multilevel analysis.
Although perceived symbolic threat and negative emotions are associated with perceived hostility, positive emotions towards foreigners are better indicators in explaining positive atti-tudes towards immigrants. The fact that the eco-nomic situation of the three countries considered do no interact with these emotional variables is a strong indicator of the validity of our results. It opens a space to rethink the mecanicistic view of the intergroup studies based on the hypothesis that economic threat is a determinant of negative attitudes towards members of outgroups consid-ered as competitors in the labour market.
One of the most important practical impli-cations of these results is that in times of social confl icts, economic and political crisis, inter-group tolerance can be better achieved by those strategies that favour the spread of positive in-tergroup images. The belief that what we have in common is greater than what differentiates us may have a positive impact on positive attitudes towards out groups. Attach positive values to the cultures of other groups may minimize the gap between social groups with different national identities, thus generating positive emotions among them.
References
Aiken, L. S., & We st, S. G. (1991). Multiple regres-sion: Testing and interpreting interactions. Newbury Park, CA: Sage.
António, J. H. C., & Policarpo, V. (Eds.). (2011). Os imigrantes e a imigração aos olhos dos portu-gueses: Manifestações de preconceito e per-spectivas sobre a inserção de imigrantes [Immi-grants and immigration to the portuguese eyes: Prejudice demonstrations and perspectives on immigrant integration]. Lisboa: Universidade Católica Portuguesa.
Bello, V. (2013). Actitudes hacia los inmigrantes en período de crisis: una comparación entre las teo-rías del confl icto de grupo y las teorías de los valores interculturales através de un análisis multinivel [Attitudes toward immigrants in cri-sis period: A comparison between the theories of confl icto group and theories of intercultural values using a multilevel analysis]. In Anales XI Congreso Español de Sociología. Madrid: Federación Española de Sociología. Retrieved- fromhttp://www.fes-web.org/congresos/11/po-nencias/1561/
Blake, R. R., & Mouton, J. S. (1961). Reactions to in-tergroup competition under win-lose conditions. Management Science, 7, 420-435.doi:http:// dx.doi.org/10.1287/mnsc.7.4.420
Boski, P. (2013). A psychology of economic migra-tion. Journal of Cross-Cultural Psychology, 44, 1067-1093. doi:10.1177/0022022112471895
Cerrutti, M., & Parrado, E. (2015). Intraregional mi-gration in South America: Trends and a research agenda. Annual Review of Sociology, 41, 399-421. doi:10.1146/annurev-soc-073014-112249
Collier, P. (2013). Exodus: How migration is changing our world. Oxford, UK: Oxford University Press.
Davidov, E., & Meuleman, B. (2012). Explaining at-titudes towards immigration policies in Europe-an countries: The role of humEurope-an values. Journal of Ethnic and Migration Studies,38, 757-775. do i:10.1080/1369183X.2012.667985
Facchini, G., & Mayda, A. M. (2012). Individual attitudes towards skilled migration: An em-pirical analysis across countries. The World Economy, 35, 183-196. doi:10.1111/j.1467-9701.2011.01427.x
Faist, T. (2016). Cross-broader migration and so-cial inequalities. Annual Review of Sociol-ogy, 42, 323-346. doi:10.1146/annurev-soc-081715-074302
Freyre, G. (1940). O mundo que o português criou: Aspectos das relações sociais e de cultura do
Brasil com Portugal e as colônias portuguesas [The world that the Portuguese created: Aspects of social affairs and culture of Brazil with Portu-gal and the Portuguese colonies]. Rio de Janeiro, RJ: José Olympio. Retrieved from http://prossi-ga.bvgf.fgf.org.br
Fridja, N. H., Kuipers, P., & ter Shure, E. (1989). Re-lations among emotion, appraisal, and emotion-al action readiness. Journemotion-al of Personemotion-ality and Social Psychology, 57(2), 212-228. doi:http:// dx.doi.org/10.1037/0022-3514.57.2.212
Gang, I. N., Rivera-Batiz, F. L., & Yun, M. S. (2013). Economic strain, education and attitudes towards foreigners in the European Union. Review of International Economics, 21, 177-190. doi:10.1111/roie.12029
Gondim, S. M. G., Álvaro-Estramiana, J. L. Schweiger-Gallo, I., Sá, M. O., & Rios, M. (2008). O chefe tem sempre razão? Um Estudo intercultural das expectativas sociais em interações de trabalho [The chief is always right? An intercultural study of social work expectations interactions]. Revista Interamericana de Psicologia, 42, 381-389. Retrieved from http://pepsic.bvsalud.org/ pdf/rip/v42n2/v42n2a19.pdf
Hirigoyen, M. F. (2001). Assédio moral: A violência-perversa no cotidiano [Bullying: The evil vio-lence in everyday life]. São Paulo, SP: Bertrand Brasil.
Hunter, L. M., Luna, J. K., & Norton, R. M. (2015). Enviromental dimensions of migration. Annual Review of Sociology, 41, 377-397. doi:10.1146/ annurev-soc-073014-112223
Levine, R. A., & Campbell, D. T. (1972). Ethnocen-tricism: Theories of confl ict, ethnic attitudes and group behavior. New York: Wiley.
Mackie, D. M., Smith, E. R., & Ray, D. G. (2008). Intergroup emotions and intergroup rela-tions. Social and Personality Psychology Compass, 2, 1866-1880. doi:10.1111/j.1751-9004.2008.00130.x
Maitner, A. T. D., Mackie, D. M., & Smith, E. R. (2006). Evidence for the regulatory function of intergroup emotion: Emotional consequences of implemented or impeded intergroup ac-tion tendencies. Journal of Experimental So-cial Psychology, 42, 720-728. doi:10.1016/j. jesp.2005.08.001
European countries? An analysis at the regional level. Institute for Social & Economic Research (ISER), 25. doi:10.1093/migration/mnt015. Re-trieved fromhttps://www.iser.essex.ac.uk/publi-cations/working-papers/iser/2012-25
Mulvey, G. (2011). Immigration under new labour: Policy and effects. Journal of Ethnic and Migra-tion Studies, 37, 1477-1493. doi:10.1080/13691 83X.2011.623622
Pereira, C. R., & Vala, J. (2011). A legitimação da discriminação em diferentes contextos norma-tivos [The legitimation of discrimination in diferente normative contexts]. In E. M. Techio & M. E. Lima (Eds.), Cultura e produção das diferenças: Estereótipos e preconceito [Culture and construction of differences: Stereotypes and prejudice] (pp. 363-404). Brasília, DF: Tech-noPolitik.
Pereira, C., Vala, J., & Costa-Lopes, R. (2010). From prejudice to discrimination: The legitimizing role of perceived threat in discrimination against immigrants. European Journal of Social Pschol-ogy, 40, 1231-1250. doi:10.1002/ejsp.718
Platow, M. J., & Hunter, J. A. (2001). Realistic in-tergroup confl ict: Prejudice, power and protest. In M. Augoustinos & K. J. Reynolds (Eds.), Understanding the psychology of prejudice and racism (pp. 195-214). London: Sage. doi:http:// dx.doi.org/10.4135/9781446218877.n12
Portes, A. (2009). Migration and development: Rec-onciling opposite views. Ethnic and Racial Stud-ies, 32, 5-22. doi:10.1080/01419870802483668
Quillian, L. (1995). Prejudice as a response to per-ceived group threat: Population composition and anti-immigrant and racial prejudice in Europe. American Sociological Review, 60, 586-611. doi:10.2307/2096296
Semyonov, M., Raijman, R., & Gorodzeisky, A. (2006). The rise of anti-foreigner sen-timent in European societies, 1988-2000. American Sociological Review, 71, 426-449. doi:10.1177/000312240607100304
Sherif, M., Harvey, O. J, White, B. J., Hood, W. R., & Sherif, C. W. (1961). Intergroup confl ict and cooperation: The robbers cave experiment. Nor-man, OK: University of Oklahoma Book Ex-change.
Simai, S., & Baeninger, R. (2011). The national myth of receptivity in Brazil. AmeriQuests, 8, 1-12. Retrievedfromhttp://ejournals.library. vanderbilt.edu/index.php/ameriquests/article/ view/245/1338
Sniderman, P. M., Hagendoorn, L., & Prior, M. (2004). Predisposing factors and situational trig-gers exclusionary reactions to immigrant minor-ities. The American Political Science Review, 98, 35-49. doi:10.1017/S000305540400098X
Stephan, W. G., & Stephan, C. (2000). An integrated threat theory of prejudice. In S. Oskamp (Ed.), Reducing prejudice and discrimination (pp.23-45). Mahwah, NJ: Lawrence Erlbaum.
Vala, J., Lopes, D., & Lima. M. O. (2008). Black immigrants in Portugal: Luso-tropicalism and prejudice. Journal of Social Issues, 64, 287-302. doi:10.1111/j.1540-4560.2008.00562.x
Wagner, U., Christ, O., & Heitmeyer, W. (2010). Ethnocentrism and bias towards immigrants. In J. F. Dovidio, M. Hewstone, P. Glick, & V. M. Esses (Eds.),Handbook of Prejudice, Stereotyp-ing, and Discrimination (pp.361-376).Thousand Oakes, CA: Sage.
Received: 23/09/2016 1st revision: 14/02/2017
Accepted: 15/02/2017
__________________________________________________________________________________________