December, 2015
Bruno Fonseca Duarte Santos
Master in Chemical Engineering
Optimization of Wastewater Quality in the
Sines Refinery
Dissertation to obtain the degree PhD in Refining, Petrochemical and Chemical Engineering
Advisor: Svetlozar Velizarov, Investigator, Universidade Nova de Lisboa
Co-advisor: Francisco Lemos, Professor, Instituto Superior Técnico Empresarial
coordinator: Maria António Santos, Chemical Engineer, Galp Energia
Jury:
President: PhD Fernando José Pires Santana
Members: PhD Francisco Manuel da Silva Lemos
PhD João Paulo Serejo Goulão Crespo PhD Rosa Maria de Oliveira Quinta Ferreira
PhD Fernando Gomes Martins PhD Svetlozar Gueorguiev Velizarov
Optimization of wastewater quality in Sines Refinery
Copyright © Bruno Fonseca Duarte Santos, Faculdade de Ciências e Tecnologia, Universidade Nova de Lisboa.
iii
Life is like a marathon… It doesn’t matter how it starts, but how it ends!
v
Acknowledgements
I like to express thank to my advisor, Svetlozar Velizarov for helping me in the pursuit of the achieved results with his valuable guidance and suggestions. I would like to acknowledge my co-advisor Francisco Lemos for its help and I express my gratitude to my empresarial coordinator Maria António Santos, because without her support, it will be impossible to develop my work and achieve all the proposed goals and more.
For the opportunity of developing and supporting an industrial investigation I would like to thank Galp Energia for being one of the founders of EngIQ doctoral program, and Sines Refinery for giving me all the conditions to work and pursuit every goal that was defined.
I would also like to acknowledge Fernando Machado for believing in my capabilities and opening new doors to my professional future, and professor João Crespo for being always available and interest in my work, and for his help since the first minute.
To Sandra Dias and Pedro Antunes, for their key recommendations and letting me feel part of the team every day, to Ana Cavaco and Carla Costa for their valuable teaching and companionship in laboratory and to Cláudia Galinha for helping me with the successful development of PLS models.
To my parents, sister and girlfriend for their incentive, support and love during all this time.
vii
Abstract
In order to address and resolve the wastewater contamination problem of the Sines refinery with the main objective of optimizing the quality of this stream and reducing the costs charged to the refinery, a dynamic mass balance was developed nd implemented for ammonia and polar oil and grease (O&G) contamination in the wastewater circuit.
The inadequate routing of sour gas from the sour water stripping unit and the kerosene caustic washing unit, were identified respectively as the major source of ammonia and polar substances present in the industrial wastewater effluent. For the O&G content, a predictive model was developed for the kerosene caustic washing unit, following the Projection to Latent Structures (PLS) approach. Comparison between analytical data for ammonia and polar O&G concentrations in refinery wastewater originating from the Dissolved Air Flotation (DAF) effluent and the model predictions of the dynamic mass balance calculations are in a very good agreement and highlights the dominant impact of the identified streams for the wastewater contamination levels. The ammonia contamination problem was solved by rerouting the sour gas through an existing clogged line with ammonia salts due to a non-insulated line section, while for the O&G a dynamic mass balance was implemented as an online tool, which allows for prevision of possible contamination situations and taking the required preventive actions, and can also serve as a basis for establishing relationships between the O&G contamination in the refinery wastewater with the properties of the refined crude oils and the process operating conditions. The PLS model developed could be of great asset in both optimizing the existing and designing new refinery wastewater treatment units or reuse schemes.
viii refinery kerosene caustic washing unit effluent using an alkaline-resistant nanofiltration (NF) polymeric membrane were performed in order to evaluate its applicability for treating these highly alkaline and contaminated streams. For a constant operating pressure and temperature and adequate operating conditions, 99.9% of oil and grease rejection and 97.7% of chemical oxygen demand (COD) rejection were observed. No noticeable membrane fouling or flux decrease were registered until a volume concentration factor of 3. These results allow for NF permeate reuse instead of fresh caustic and for significant reduction of the wastewater contamination, which can result in savings of 1.5 M€ per year at the current prices for the largest Portuguese oil refinery. The capital investments needed for implementation of the required NF membrane system are less than 10% of those associated with the traditional wet air oxidation solution of the spent caustic problem. The operating costs are very similar, but can be less than half if reusing the NF concentrate in refinery pH control applications. The payback period was estimated to be 1.1 years. Overall, the pilot plant experimental results obtained and the process economic evaluation data indicate a very competitive solution through the proposed NF treatment process, which represents a highly promising alternative to conventional and existing spent caustic treatment units.
xi
Resumo
A otimização da qualidade das águas residuais da Refinaria de Sines tinha como principal objetivo reduzir os custos cobrados pela Estação de Tratamento de Águas Residuais pela descarga de efluente contaminado. Com essa motivação um balanço de massa dinâmico foi implementado para os teores de amónia e óleos polares no circuito de águas residuais.
xii otimizar as unidades de tratamento de águas residuais existentes como para permitir uma adequada projeção de novos sistemas ou sistemas de reutilização.
Com o objetivo de encontrar uma solução possível para o tratamento da soda exausta, for realizado um teste através de uma planta piloto para recuperação de NaOH da unidade de lavagem cáustica do petróleo, usando uma membrana de nanofiltração, polimérica e alcalino-resistente. Para uma pressão de operação constante e temperatura e condições operacionais adequadas, observou-se uma taxa de rejeição de óleos de 99,9% e uma taxa de rejeição de 97,7% para a Carência Química de Oxigénio. Não se observou
fouling ou diminuição de fluxo até um fator de concentração volumétrica de 3. Estes resultados permitem a reutilização do permeado ao invés de utilização de soda cáustica fresca e antecipam uma significativa redução da contaminação das águas residuais, o que pode resultar numa economia de 1,5 M € por ano a preços correntes. O capital necessário para um sistema de membrana de NF são inferiores a 10% relativamente à solução tradicional através de oxidação térmica com ar. Os custos operacionais são muito semelhantes, mas podem ser otimizados e reduzidos a menos de metade através da reutilização do concentrado em aplicações de controlo de pH na refinaria. O período de retorno é de 1,1 anos. No geral, os resultados obtidos na unidade piloto e os dados de avaliação económica do processo indicam uma solução muito competitiva por meio do processo de tratamento com membranas de NF proposto, o que representa uma alternativa altamente promissora face às unidades de tratamento de sodas exaustas convencionais que representam custos de investimento superiores.
xiii residuais, com um reator de leito fluidizado e injeção de ar em contra-corrente com as águas residuais a tratar apresenta uma redução de mais de 90% dos óleos solúveis. Os resultados também indicam que o processo de descontaminação ocorre por um processo catalítico pelo que o tratamento proposto apresenta-se como uma alternativa à utilização de carvão ativado ou outros adsorventes.
xv
Contents
1. INTRODUCTION ... 1
-1.1. WORK MOTIVATION AND OBJECTIVES ...-1
-1.2. THESIS STRUCTURE ...-2
-1.3. CRUDE OIL REFINING PROCESS ...-4
-1.4. SINES REFINERY WASTEWATER CIRCUIT ...-7
-1.5. WASTEWATER CHARGES ... -10
-2. CONTAMINANTS IDENTIFICATION ... 15
-2.1. OIL AND GREASE ... -15
-2.2. AMMONIA ... -23
-3. PREDICTION OF POLAR OIL AND GREASE CONTAMINATION LEVELS IN REFINERY WASTEWATER THROUGH MULTIVARIATE STATISTICAL MODELING . 37 -3.1. INTRODUCTION ... -37
-3.2. MATERIALS AND METHODS ... -40
-3.3. RESULTS AND DISCUSSION ... -45
-4. AN ON-SITE PILOT SCALE RECOVERY OF PETROLEUM REFINERY SPENT CAUSTICS BY NANOFILTRATION: PROCESS VALIDATION AND ECONOMIC EVALUATION ... 55
-4.1. INTRODUCTION ... -55
-4.2. MATERIALS AND METHODS ... -58
-4.3. RESULTS AND DISCUSSION ... -62
-5. SOLUBLE OIL AND GREASE REMOVAL OF PETROLEUM REFINERY WASTEWATER USING SPENT FCC CATALYST ... 75
-5.1. INTRODUCTION ... -75
-5.2. MATERIALS AND METHODS ... -76
-5.3. RESULTS AND DISCUSSION ... -79
xvii
Figures list
FIGURE 1.1–CRUDE DESALINATION UNIT SCHEME [4]. ... -5
-FIGURE 1.2–WASTEWATER TREATMENT COSTS CHARGED BY EXTERNAL WWTP. ... -12
-FIGURE 1.3–NUMBER OF OCCURRENCES OF CLASS 5 IN THE WASTEWATER BY PARAMETER. ... -12
-FIGURE 1.4–NUMBER OF OCCURRENCES OF PENALIZATIONS IN THE WASTEWATER BY PARAMETER. ... -13
-FIGURE 2.1–SCHEMATIC REPRESENTATION OF WASTEWATER CIRCUIT IN THE LARGEST PORTUGUESE OIL REFINERY, WITH IDENTIFICATION OF SAMPLE COLLECTION POINTS FOR O&G ANALYSIS. ... -17
-FIGURE 2.2–HYDROCARBON AND SOLUBLE OIL CONCENTRATION IN THE DISCHARGE POINT FOR THE EXTERNAL WWTP BETWEEN 2010 AND 2012. ... -19
-FIGURE 2.3–AVERAGE POLAR O&G MASS FLOW RATE CONTRIBUTION OF DIFFERENT EMISSION POINTS FOR O&G WASTEWATER CONTAMINATION AT THE DISCHARGE POINT FOR EXTERNAL WWTP. ... -20
-FIGURE 2.4–SCHEMATIC REPRESENTATION OF SOUR WATER STRIPPER (SWS)[3]. ... -23
-FIGURE 2.5–SCHEMATIC REPRESENTATION OF WASTEWATER CIRCUIT IN THE LARGEST PORTUGUESE OIL REFINERY, WITH IDENTIFICATION OF SAMPLE COLLECTION POINTS FOR AMMONIA ANALYSIS. ... -25
-FIGURE 2.6–AVERAGE MASS CONTRIBUTION OF DIFFERENT EMISSION POINTS FOR AMMONIA WASTEWATER CONTAMINATION AT THE DISCHARGE POINT FOR THE EXTERNAL WWTP. ... -26
-FIGURE 2.7–AVERAGE MASS CONTRIBUTION OF SLOP OIL, DIESEL AND CRUDE OIL TANKS FOR AMMONIA WASTEWATER CONTAMINATION AT THE OIL SEPARATOR FOR CRUDE OIL TANK AREA. ... -28
-FIGURE 2.8–AMMONIA MASS BALANCE ESTIMATION COMPARED WITH ANALYTICAL RESULT AT THE DISCHARGE POINT FOR EXTERNAL WWTP DURING NOVEMBER 2011. ... -29
-FIGURE 2.9–MASS CONTRIBUTIONS OF DESALTER EFFLUENT, SLOP OIL TANK BOTTOMS AND OTHER EMISSION POINTS FOR THE ESTIMATED AMMONIA VALUE AT THE DISCHARGE POINT FOR EXTERNAL WWTP IN NOVEMBER 2011. ... -30
-FIGURE 2.10–SIMPLIFIED SCHEME OF A FLARE SYSTEM [25]. ... -31
-FIGURE 2.11–COMPARISON BETWEEN SLOP OIL FLOW ESTIMATION AND TANK INVENTORY VARIATIONS IN DECEMBER 2011. ... -32
-FIGURE 2.12–VOLUMETRIC CONTRIBUTIONS TO SLOP OIL FLOW ESTIMATIONS OF DIFFERENT SOURCES UPSTREAM OF SLOP OIL TANK, WITH INDICATION OF FLARE KNOCKOUT DRUMS (FL-V1 AND FL-V5) AND PRIMARY SEPARATION WASTEWATER EQUIPMENT (API,CPI AND DAF) IN DECEMBER 2011. ... -32
-FIGURE 2.13–CORRELATION BETWEEN SOUR GAS VALVE OPENING TO FLARE CIRCUIT AND AMMONIA CONTENT IN REFINERY WASTEWATER AT THE DISCHARGE POINT FOR THE EXTERNAL WWTP. ... -34
-FIGURE 2.14–AMMONIA AVERAGE CONCENTRATION IN DISCHARGE POINT TO EXTERNAL WWTP AND NUMBER OF PENALIZATIONS OCCURRENCES (AMMONIA >125 PPM). ... -35
-xviii
FIGURE 3.2–COMPARISON BETWEEN PLS MODEL ESTIMATIONS AND EXPERIMENTAL DATA FOR POLAR OIL AND GREASE CONTENT IN THE KEROSENE CAUSTIC WASHING UNIT EFFLUENT, WITH SLOPE AND QUADRATIC ERROR,
FOR THE TRAINING AND VALIDATION DATA SETS. ... -47 -FIGURE 3.3–COMPARISON OF DYNAMIC MASS BALANCE ESTIMATION LINE OF POLAR OIL AND GREASE CONTENT IN
THE EFFLUENT OF THE DISSOLVED AIR FLOTATION UNIT WITH EXPERIMENTAL DATA POINTS. ... -49 -FIGURE 3.4–COMPARISON OF DYNAMIC MASS BALANCE ESTIMATION LINE OF POLAR OIL AND GREASE CONTENT AT
DISCHARGE POINT FOR EXTERNAL WWTP WITH ANALYTICAL VALUES. ... -53
-FIGURE 4.1–NOMINAL DIMENSIONS FOR THE PROPRIETARY COMPOSITE NANOFILTRATION MEMBRANE, FROM
KOCH, TESTED FOR SPENT CAUSTIC FILTRATION [58] ... -59 -FIGURE 4.2–PERMEATE FLUX ACROSS ULTRAFILTRATION CERAMIC MEMBRANE FOR DEMINERALIZED WATER
BEFORE AND AFTER FILTRATION USING WASTEWATER AND CLEANING WITH A 2%NAOH SOLUTION, FOR WASTEWATER SAMPLE #1 ... -63 -FIGURE 4.3–EFFECT OF TRANSMEMBRANE PRESSURE ON PERMEATE FLUX, AND HYSTERESIS EFFECT WITH
WASTEWATER SAMPLE #1. ... -65 -FIGURE 4.4–EFFECT OF CROSSFLOW VELOCITY ON PERMEATE FLUX AT A TRANSMEMBRANE PRESSURE OF 0.5 BAR
FOR WASTEWATER SAMPLE #1. ... -66 -FIGURE 4.5–EFFECT OF CROSSFLOW VELOCITY ON PERMEATE FLUX AT A TRANSMEMBRANE PRESSURE OF 1 BAR
FOR WASTEWATER SAMPLE #1. ... -66 -FIGURE 4.6–PERMEATE FLUX ACROSS NF MEMBRANE FOR DEMINERALIZED WATER BEFORE AND AFTER
FILTRATION OF SPENT CAUSTIC SAMPLE #1 ... -69 -FIGURE 4.7–APPARENT NF MEMBRANE REJECTION VALUES FOR O&G,COD, SULFUR AND SODIUM, WITH
CONCENTRATION FACTOR, FOR SPENT CAUSTIC SAMPLE #1 ... -70 -FIGURE 4.8–PERMEATE FLUX ACROSS NF MEMBRANE FOR DEMINERALIZED WATER BEFORE AND AFTER
NANOFILTRATION USING SPENT CAUSTIC AND CLEANING WITH A 2%NAOH SOLUTION, AND FOR SPENT CAUSTIC SAMPLE #2. ... -71 -FIGURE 4.9–APPARENT NF MEMBRANE REJECTION VALUES FOR O&G,COD, SULFUR AND SODIUM IN PERMEATE,
WITH CONCENTRATION FACTOR, FOR SPENT CAUSTIC SAMPLE #2 ... -72
-FIGURE 5.1–SCHEMATICALLY REPRESENTATION OF THE GLASS CHROMATOGRAPH COLUMN USED FOR THE
WASTEWATER TREATMENT TESTS IN FIXED AND FLUIDIZED BED ARRANGEMENT ... -78 -FIGURE 5.2–POLAR OIL AND GREASE CONCENTRATION REDUCTION FOR FILTRATION OF REFINERY WASTEWATER
SAMPLE IN A FIXED BED CATALYST TEST ... -79 -FIGURE 5.3–POLAR OIL AND GREASE CONCENTRATION REDUCTION FOR FILTRATION OF REFINERY WASTEWATER
SAMPLE IN A NON-AERATED CATALYST BED (INITIAL 2000 ML) AND IN A FLUIDIZED CATALYST BED TEST
(AFTER INITIAL 2000 ML) ... -81 -FIGURE 5.4–POLAR OIL AND GREASE CONCENTRATION REDUCTION IN WASTEWATER SAMPLE FOR DIFFERENT
CATALYST TO WASTEWATER RATIOS, AFTER 3H30 MIXING BATCHES WITH SPENT FCC CATALYST ... -82 -FIGURE 5.5–POLAR OIL AND GREASE CONCENTRATION REDUCTION IN WASTEWATER SAMPLE, FOR DIFFERENT
MIXING TIME BATCHES WITH 50 G OF SPENT FCC CATALYST ... -83 -FIGURE 5.6–POLAR OIL AND GREASE CONCENTRATION REDUCTION IN WASTEWATER SAMPLES, FOR DIFFERENT
INITIAL POLAR OIL AND GREASE CONCENTRATIONS, WITH A MIXING TIME OF 15 MINUTES AND 50G OF SPENT
-xix
Tables list
TABLE 1.1–MATRIX FOR CLASSIFICATION AND CHARGE OF THE WASTEWATER SENT TO EXTERNAL WWTP ... -11
-TABLE 2.1–TYPICAL COMPOSITION OF A NAPHTHENIC SPENT CAUSTIC FROM A KEROSENE CAUSTIC WASHING UNIT [18,21] ... -21
-TABLE 2.2–AMMONIA ANALYTICAL RESULTS IN KNOCKOUT DRUM FL-V5 AND SLOP OIL TANK BOTTOMS IN DECEMBER 2011 ... -33
-TABLE 3.1–PROCESS DATA USED AS INPUTS FOR PLS MODEL DEVELOPMENT FOR PREDICTION OF SPENT CAUSTIC CONTAMINATION WITH POLAR OIL AND GREASE ... -42
-TABLE 3.2–PLS MODELS, CAPTURED VARIANCE AND CORRELATION COEFFICIENTS FOR VALIDATION AND TRAINING SETS ... -45
-TABLE 4.1–AVERAGE COMPOSITION OF SPENT CAUSTIC EFFLUENT [21,44] ... -56
-TABLE 4.2–ANALYTICAL RESULTS FOR WASTEWATER SAMPLES BEFORE AND AFTER ULTRAFILTRATION ... -64
-TABLE 4.3–ANALYTICAL RESULTS OF SPENT CAUSTIC SAMPLES BEFORE AND AFTER NANOFILTRATION ... -68
-TABLE 4.4–ECONOMIC DATA FOR A SPENT CAUSTIC TREATMENT INSTALLATION WITH POLYMERIC MEMBRANES, ASSUMING A DIRECT EXTRAPOLATION OF PILOT PLANT RESULTS ... -73
xxi
Abreviations
AdSA Águas de Santo André
APA Portuguese Environmental Agency API American Petroleum Institute BAL Clean Water Basin
BAT Best Available Technology CDU Crude Distillation Unit
CF Volume Concentration Factor COD Chemical Oxygen Demand CPI Coalescence Plate Interceptor DAF Dissolved Air Flotation FCC Fluid Catalytic Cracking LEL Lowest Emission Limit LPG Liquefied Petroleum Gas l.q. Quantification Limit n.a. non applicable NF Nanofiltration O&G Oil and Grease
OSPAR Oslo and Paris Conventions for the Protection of the Marine Environment of the North-East Atlantic
xxii PO&GSC Polar Fraction of Oil and Grease in Spent Caustic of Kerosene
Caustic Washing Unit (ppm) ppb part per billion (µg.l-1)
ppm part per million (mg.l-1)
Q Kerosene flow (m3.h-1)
RARISA Wastewater Collection and Treatment Rules in Santo André System
RMSECV Root Mean Square Error of Cross Validation RMSEP Root Mean Square Error of Prediction
RSH Kerosene Mercaptan content (ppm) %S Kerosene sulfur content (%m/m) SWS Sour Water Stripper
TAN Naphthenic Oil Acidity (mgKOH.g-1)
TAN Naphthenic Kerosene Acidity (mgKOH.g-1)
TSS Total Suspended Solids UF Ultrafiltration
WWTP Wastewater Treatment Plant ρ Crude Oil Density (kg m-3)
1.
Introduction
1.1.
Work motivation and objectives
Crude oil refining employs the use of significant quantities of fresh water. A great fraction of this water contacts intimately with the processed oil and, as consequence, the contaminants present, such as hydrocarbons, sulfides, ammonia, phenolic compounds, among others are carried over and solubilized by water due to diffusion mechanisms that occur in oil/water interface. Refinery wastewater contamination is mainly associated with feedstock’s quality and the technological level of refining process units [1]. Despite the possibility to find in the literature several ranges for contaminants level, to the best of the author´s knowledge, no correlation between feedstock’s quality, process operating conditions and the concentration of different substances in the industrial liquid effluent have been reported so far in the available literature.
In the largest and most complex Portuguese oil refinery, a wastewater pre-treatment system exists, while the final correction and adjustment of the contaminants levels is done in an external WWTP. To discharge wastewater, the refinery is charged according to its quantity and quality, suffering a penalization each time when there is a documented contamination.
Therefore the work developed within the frame of this PhD thesis, was devoted to identifying and studying the different phenomena involved in the production of the refinery wastewater and their impacts on the wastewater pretreatment system, especially targeting optimizing the wastewater circuits, improving the wastewater quality and, through all this; reducing of the costs charged by the WWTP to the refinery.
- 2 - wastewater treatment solutions or in order to mitigate or eliminate their impacts. This was accomplished by developing a mass balance to the refinery wastewater circuit for prediction and identification of contamination sources of ammonia and O&G.
The important relevance of spent caustic discharge to O&G contamination was clearly demonstrated and a predictive model based on Projection to Latent Structures (PLS) was developed for the kerosene caustic washing unit. The O&G concentration was set as an output of the PLS model and was used as an input for the refinery wastewater mass balance. In order to reduce the impact of this stream on the wastewater contamination, a pilot plant nanofiltration unit was built and installed on site in order to test the feasibility of nanofiltration to remove and/or significantly reduce the water pollution caused by spent caustic at the source.
Laboratory tests were also performed to explore the possibility for reduction of oil and grease concentration in the wastewater effluent after its clarification in the dissolved air flotation unit, by passing it through a fluidized FCC spent catalyst bed, injecting air in the wastewater in a countercurrent operating mode.
1.2.
Thesis structure
The sections presented throughout this PhD thesis are arranged according to the following structure:
- 3 - define the motivation, the main objectives and research strategy followed to execute the work performed during this PhD project.
Chapter 2 is dedicated to detail the wastewater contamination problems, focusing on the description of the origin and importance of each contaminant, the problems which it causes in the effluent quality and its impact on the charged costs. The sources of emission of each contaminant are identified. Chapter 3 explains the developed mass balance for polar oil and grease content prediction. Herein the methodology employed and the results obtained, which have validated the model and allowed for actions that created immediate benefits to the refinery, in terms of reducing the associated charged costs, are presented
Chapter 4 presents the on-site spent caustic nanofiltration pilot tests performed and the promising results obtained for contamination reduction at the source. Also an economic evaluation was performed indicating the feasibility of this solution to be scaled-up and developed as a large-scale spent caustic treatment option.
Chapter 5 describes the potential for using a residue like spent FCC catalysts as a way for wastewater treatment and correction of oil and grease concentration after primary treatment units like API/CPI and DAF, by using a fluidized bed of spent FCC catalyst, injecting air, in a countercurrent mode, into the effluent to be treated.
- 4 -
1.3.
Crude oil refining process
Crude oil is a complex mixture that comprises hydrocarbons from methane to asphalt. The different types of hydrocarbons are normally classified into paraffins, naphthenes and aromatics. Crude oil is also composed of variable quantities of sulfur compounds, nitrogen, oxygen and heavy metals such as nickel, iron or vanadium, among others. Crude is extracted in oil fields in different locations around the globe, and is shipped to refineries where is separated and converted into fuels daily used, like gasoline, diesel, kerosene, butane and propane. Other refined streams are the base for the development of chemical products synthetized in petrochemical industries [2].
In Galp Energia, Sines Refinery the crude oil is received by ships and kept in 100.000 m3 tanks, prior to its refining in the process units. After decantation and
- 5 -
Figure 1. 1 – Crude desalination unit scheme [4].
Due to the intimate contact between wash water and crude oil, the desalter water effluent can carry free oil, suspended solids, phenolic compounds, sulfides and ammonia [3, 4]. After salt removal, oil is fed to atmospheric distillation unit to be fractionated in light hydrocarbons (C1 – C4),
naphtha/gasoline, kerosene, diesel and atmospheric residue. Splitted hydrocarbon fractions are drawn from the column as side cuts with fractions from other products entrained. In order to separate and adjust the properties of each product, they are routed to side strippers where steam is injected, carrying the lighter fractions back to the distillation column [5].
Stripping steam is condensed and separated from the lighter hydrocarbons in an overhead drum. The liquefaction occurs in the presence of sulfides and ammonia, formed by hydrogenation of sulfur and nitrogen present on crude oil, which are solubilized by the water. This effluent is normally designated as sour water.
- 6 - content, improving gasoline octane number and upgrading of heavier hydrocarbon fractions into more valuable lighter fractions employing different cracking processes. Gas from the top of the CDU is separated in C1-C2, which are incorporated in the refinery fuel gas network and burned in the refinery furnaces; and propane and butane, which are used as Liquefied Petroleum Gas (LPG). Naphta cut is used as feedstock for petrochemical industry in order to obtain olefins and aromatic compounds, or for gasoline production in naphta cracking units or catalytic reformers. Kerosene can be used as a diesel blending component, but its mainly used as aviation fuel.
- 7 - transformation in molecular sulfur: Claus process units. This reaction avoids SOX emissions to the atmosphere.
Atmospheric residue, collected in the bottoms of the CDU, contains significant quantities of valuable hydrocarbons, which are not recovered at operating temperatures employed in this unit, since a higher temperature severity will lead to cracking reactions, increase of operating pressure and products degradation. In order to reduce residue production and improve distillates yields, CDU bottoms is further processed in vacuum distillation units, thermal or catalytic conversion units. Conversion units like Visbreaker, Fluid Catalytic Cracker (FCC), Hydrocracker or Coker, are fed with heavier products from atmospheric and vacuum distillation units. Heavier hydrocarbons with longer carbon streams and reduced commercial value are cracked into smaller chain hydrocarbons like gas, naphtha, gasoline, diesel and kerosene. The bottoms production normally comprises the higher fraction of fuel oil, used as ship or furnace fuel. In conversion units water and steam are used to improve separation between different fractions, to improve flow of heavier products and as cooling media. Due to the intimate contact between water and hydrocarbons, wastewater with a high content of sulfides, ammonia, phenolic compounds is generated and also carries over some oil [4].
1.4.
Sines Refinery wastewater circuit
In the biggest and most complex Portuguese refinery, there are different wastewater circuits accordingly to the type of effluent generated: storm waters, saline effluent, oily wastewater, accidentally contaminated wastewater, chemical effluent and sanitary.
- 8 - drainage network and routed to a 31000 m3 clean water basin (BAL). Further to
decantation this water can be discharged to a riverside, after laboratory analyzes attesting that the water quality corresponds to the environmental legislation and a previous communication to the Environmental Portuguese Agency (APA). If the analytical values show eventual traces of contamination, this stream is routed to a wastewater treatment plant (WWTP) external to the refinery, for further treatment. Rain water is also used as a make-up stream of the Fire water basin, and the possibility of upgrading this water as cooling water towers make-up is being studied.
Saline effluent is generated in the purges of cooling water towers, to maintain cooling water analytical parameters within the required operation range, and after the regeneration of water demineralization ion exchange columns. These streams are collected in a saline effluent basin and analyzed on a regular basis in order to guarantee that the quality of the water prior to discharge directly into the sea respects the environmental legislation norms. In case of an eventual contamination, effluent sags by overflow to accidentally contaminated wastewater circuit, in order to avoid contamination of the water receiving media.
- 9 - effluent is generated in the storage area. Crude oil received in the refinery tanks after decantation contains a percentage of bottom water and sediments. Distillate products carry over some process water. The bottoms of the tanks are drained in continuously to reduce the inert volume of the tanks and in order to guarantee the specifications of the feedstock’s and products. Bottom sediments and water are routed to primary gravity separators, normally designated as API (American Petroleum Institute) and CPI (Coalescence Plate Interceptor), which are designed to recover non-emulsified oil droplets greater than 150 µm, by physical separation. Recovered oil is sent to a slop tank, while water with emulsified oil and smaller oil droplets is pumped to an equalization basin, where accidentally contaminated waters are also received. Oily wastewaters resulting from water utilization in refining units is normally referred to sour waters or process waters. Sour waters are treated in sour water stripping units (SWS), where stripping steam is injected in a countercurrent operation mode with sour water to extract soluble ammonia, sulfide, and volatile compounds. Sour gas resulting from sour water stripping is sent to Claus units, while stripped wastewater and process waters are pumped to API/CPI equipment’s and then to the wastewater equalization basin.
- 10 - physical and chemical properties, wastewater is discharged to an external WWTP for improvement and rectification before being sent to the sea.
Sanitary wastewater from domestic utilization and chemical effluents from the laboratory are collected in distinct circuits and pumped directly to an aerated lagoon.
1.5.
Wastewater charges
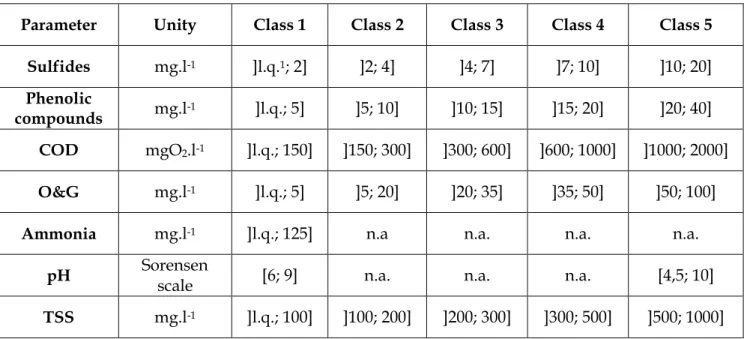
After primary and secondary treatment, wastewater is discharged to an external WWTP, for final treatment of the stream before discharging it to a water receiving medium. The discharge of the refinery effluent to this external WWTP is subjected to rules defined in RARISA that among different considerations indicates the tariffs to be applied based on the discharged wastewater quantity and quality. The wastewater analytical composition is determined twice per week with composed samples collected with an automatic sampler located between the refinery and the treatment plant. The parameters analyzed are sulfides, phenolic compounds, Chemical Oxygen Demand (COD), Oil and Grease (O&G), ammonia, Total Suspended Solids (TSS) and pH. Based on the results obtained, the total amount of the effluent prior to that sample is classified according to the matrix presented in Table 1. 1. The wastewater classification is defined by the parameter that presents the highest class in the analyses of the composed sample, e.g. if all the parameters have analytical values that define them as class 1, but phenolic compounds indicate a class 3, the effluent is defined as class 3 for charging.
- 11 -
Table 1. 1 – Matrix for classification and charge of the wastewater sent to external WWTP
Parameter Unity Class 1 Class 2 Class 3 Class 4 Class 5
Sulfides mg.l-1 ]l.q.1; 2] ]2; 4] ]4; 7] ]7; 10] ]10; 20]
Phenolic
compounds mg.l-1 ]l.q.; 5] ]5; 10] ]10; 15] ]15; 20] ]20; 40]
COD mgO2.l-1 ]l.q.; 150] ]150; 300] ]300; 600] ]600; 1000] ]1000; 2000]
O&G mg.l-1 ]l.q.; 5] ]5; 20] ]20; 35] ]35; 50] ]50; 100]
Ammonia mg.l-1 ]l.q.; 125] n.a n.a. n.a. n.a.
pH Sorensen
scale [6; 9] n.a. n.a. n.a. [4,5; 10]
TSS mg.l-1 ]l.q.; 100] ]100; 200] ]200; 300] ]300; 500] ]500; 1000]
1 l.q.: Quantification Limit
Since 2009 until 2013, as shown on Figure 1. 2, there was a tendency of aggravation of wastewater charged cost. Since then, and due to the work performed throughout this PhD project that will be described in the following sections, there was a reduction in the charged costs, back to the same values seen in 2009.
- 12 -
Figure 1. 2 – Wastewater treatment costs charged by external WWTP.
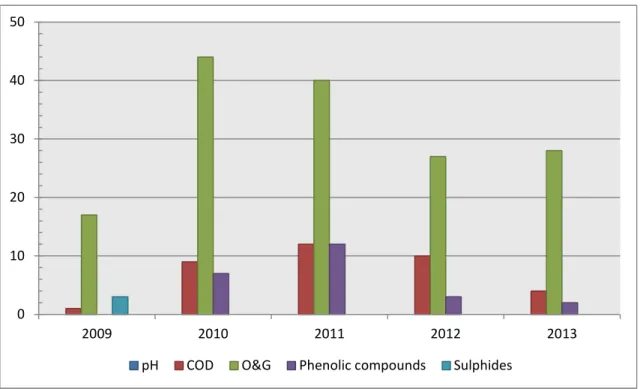
Figure 1. 3 – Number of occurrences of class 5 in the wastewater by parameter.
- € 1.000.000 € 2.000.000 € 3.000.000 € 4.000.000 € 5.000.000 € 6.000.000 €
2009 2010 2011 2012 2013 2014 2015
Jan Feb Mar Apr May Jun Jul Aug Sep Oct Nov Dec
0 10 20 30 40 50
2009 2010 2011 2012 2013
- 13 -
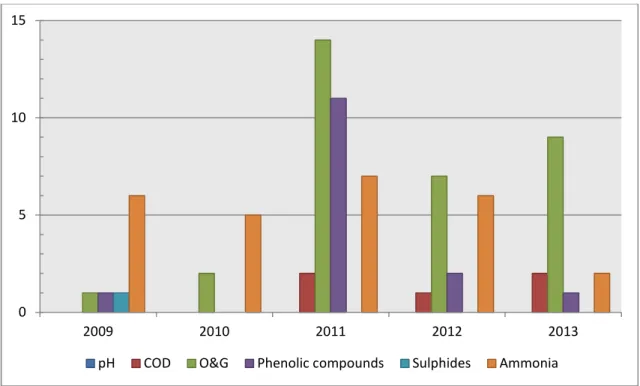
Figure 1. 4 – Number of occurrences of penalizations in the wastewater by parameter.
0 5 10 15
2009 2010 2011 2012 2013
- 15 -
2.
Contaminants identification
The wastewater from the largest Portuguese oil refinery is most significantly affected by the high concentrations of oil and grease and ammonia, due to their strongest impacts on the costs charged by the external WWTP.
2.1.
Oil and Grease
2.1.1. Introduction
- 16 - The standard methods used for oil and grease determination in waters, do not allow for the quantification of a particular substance. Instead, groups of compounds with similar chemical characteristics, that are extracted from the water sample by a certain organic solvent, are measured [8]. When hydrocarbons are extracted into the organic solvent, the analytical result can be affected by the presence of sulfur and/or nitrogen compounds, organic dyes, vegetable oil, animal fat, waxes and other substances with similar properties [8, 11]. O&G can be polar or non-polar substances. The polar fraction accounts for heterocyclic, aromatic and phenolic substances that are present in crude oil composition, and for aromatic compounds, unsaturated substances and elements that have polar arrangements by the presence of distinct atoms such as chlorine, oxygen, nitrogen or sulfur [11]. Naphthenic acids are important polar substances. Polar oil and grease can be removed from the organic extract by absorption into silica gel, which allows for the determination of their fraction for the total oil and grease. Non-polar oil and grease fraction, or hydrocarbons content, measures the presence of simple and ramified chain hydrocarbons [8, 11]. The non-polar substances are insoluble in water and can be removed through the utilization of chemical and physical separation, such as gravity decantation, centrifugation, coagulation and/or flotation. On contrary, the polar compounds are soluble in aqueous media, and their presence in wastewater will lead to high values of oil and grease, (even after chemical and/or physical separation treatment), that may lead to an increase in water toxicity levels, with devastating impacts for the water environment and its users [12-14].
2.1.2. Materials and methods
- 17 - liter glass bottles in different refinery location sites during 24 months, and readily analyzed after sampling. The historic records before that period were also used for framing and contamination evolution comparison.
Figure 2. 1 – Schematic representation of wastewater circuit in the largest Portuguese oil refinery, with identification of sample collection points for O&G analysis.
- 18 - determination of total O&G concentration, and is the most suitable for application in water samples that may contain volatile hydrocarbons and oil content below 10 ppm. The standard method 5520 F determines the O&G non-polar fraction, i.e. the presence of hydrocarbons that can be recovered by physical and/or chemical treatment. The remaining quantity which is not removed by primary or secondary treatments, accounts for the soluble oil content [8, 11].
2.1.3. Emission source identification
- 19 -
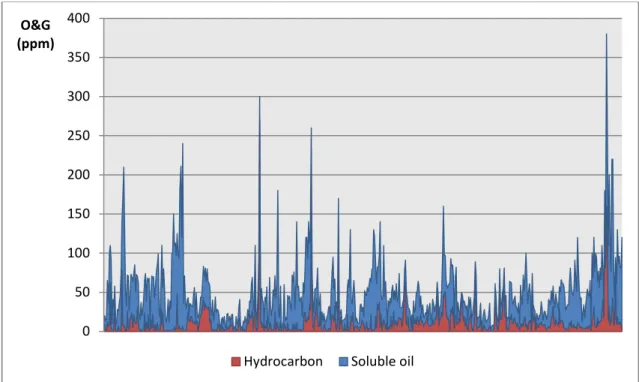
Figure 2. 2 – Hydrocarbon and soluble oil concentration in the discharge point for the external WWTP between 2010 and 2012.
The analysis of the data indicated that the polar fraction of oil and grease has accounted for more than 73% of the system contamination with oil. Also, it was identified that the appearance of higher concentrations of hydrocarbons was due to upsets in the upstream treatment equipment’s, e.g. a mechanical failure in the dissolved air flotation unit. Based on these considerations, the analytical work regarding the samples taken from the upstream points was focused in identification of contamination by polar substances. The results obtained are presented on Figure 2. 3 and show that the major contribution for soluble oil concentration in wastewater is due to the emission of highly contaminated spent caustic, which accounts for more than 92 wt%. The desalter effluent accounts for more than 6 wt%, and the remaining points have negligible impacts. Spent caustic is a by-product resulting from the kerosene caustic washing for mercaptan extraction and oxidation [1, 3, 6]. The most common
0 50 100 150 200 250 300 350 400
O&G (ppm)
- 20 - process, which is also applied in the Sines refinery is the Merox process from UOP.
Figure 2. 3 – Average polar O&G mass flow rate contribution of different emission points for O&G wastewater contamination at the discharge point for external WWTP.
2.1.4. Kerosene caustic washing unit
- 21 - LPG, naphtha, gasoline or kerosene. The kerosene cut is one of the most sensitive operations, since in this hydrocarbon fraction most of the acidic compounds, namely naphthenic acids, concentrates, etc. are present [18]. In caustic washing unit, kerosene cut from CDU is sent to a pre-wash drum for extraction of acidic compounds. In the downstream sections, mercaptans are removed and the caustic used is firstly heated in order to promote the oxidation of sulfur compounds into sulfides [17]. Caustic used in the pre-wash section is continuously drawn off from the unit and after contact with kerosene is saturated in acidic compounds and is designated as naphthenic spent caustic. This caustic is very hazardous for the environment due to the presence of sodium hydroxide based compounds that make this stream extremely alkaline and corrosive [17], as well as toxic due to the presence of dissolved organic compounds such as mercaptans, sulfides, cresylic acids and naphthenic acids [19]. The typical composition of spent caustic solution is presented on Table 2. 1.
Table 2. 1 – Typical composition of a naphthenic spent caustic from a kerosene caustic washing unit [18, 21]
Parameter Range Unity
NaOH 1-4 %(m/m)
Sulfides (S-) 0-0.1 %(m/m)
Mercaptans (S+) 0-0.5 %(m/m)
Naphthenic acids 2-15 %(m/m)
Cresylic acids 0-3 %(m/m)
pH 12-14 Sorensen scale
- 22 - content will still be extremely high, even after primary and secondary chemical/physical separations. Besides the environmental problems, the fact that spent caustic has no economic value, the difficulties in its neutralization and the higher associated treatment costs, imposes a great impact on the financial refinery margins [16, 20].
2.1.5. Mitigation
- 23 -
2.2.
Ammonia
2.2.1. Introduction
The formation of ammonia in crude oil refining results from the hydrogenation of nitrogen compounds present in crude oil chemical formulation. Due to the affinity of these substances to water, ammonia is normally solubilized by aqueous stream, when it is in an intimate contact with hydrocarbon streams. The same mass transport phenomenon occurs with sulfides, formed by hydrogenation of sulfur compounds. The presence of ammonia and sulfides in aqueous solutions results in sour water, which dependently on feedstock quality and refining process units can have more than 20000 ppm of ammonia [1]. Sour waters are normally routed to treatment in SWS with injection of air or steam into the column. An alternative configuration is the vaporization of the liquid in the bottom of the column in a reboiler, which is schematically represented in Figure 2. 4.
- 24 - In SWS, contaminants are transported from liquid media into gas, thus originating a sour gas, to which 80 to 99% of ammonia is transferred. Sour gas is routed to Claus reactors, incinerators or flaring, to oxidize ammonia and sulfides. Stripped water with ammonia traces can be reused in refining units or disposed to an wastewater treatment plant [1, 3].
Wastewater treatment plants normally have equipment to reduce the ammonia concentration in the wastewater. The most common technologies are based on biological denitrification, chemical precipitation or electrochemical conversion. More recent technologies apply microwaves [22] or ion exchange [23]. The presence of significant amounts of ammonia can affect biological treatment systems, due to high toxicity and consumption of available oxygen, and may represent a significant fraction of COD [24]. Ammonia, due to its noxious effects in the environment is one of the target pollutants for European Union, within the water conservation policy 2000/60/CE. The Portuguese legislation defines a maximum discharge value of 10 ppm to water bodies [10], and the rules for wastewater discharge from the refinery to the external WWTP recommends a maximum value of 125 ppm. Above this value a penalization situation occurs involving increased costs charged to the refinery.
2.2.2. Materials and methods
- 25 -
Figure 2. 5 – Schematic representation of wastewater circuit in the largest Portuguese oil refinery, with identification of sample collection points for ammonia analysis.
Ammonia quantification was done in laboratory using an existing standard method SMEWW 4500-NH3 F. This method is based on the formation of a blue
- 26 -
2.2.3. Emission source identification
The historic data from wastewater quality discharged to the external WWTP between 2009 and 2013, indicates an average ammonia concentration of 91 ppm. Although this average value is lower than the maximum limit for a penalization, accordingly to the RARISA matrix, shown on Table 1. 1., along these 5 years this limit has been violated in 20% of the analyses performed for wastewater classification and charging. The analytical data obtained with samples combined with the average mass flows in each point, have indicated ammonia emission distribution between the analyzed point sources presented in Figure 2. 6.
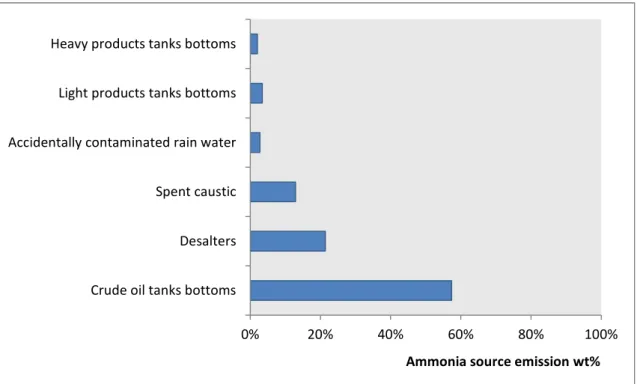
Figure 2. 6 – Average mass contribution of different emission points for ammonia wastewater contamination at the discharge point for the external WWTP.
The data indicates as major contributions the drainage from crude oil tanks bottoms – 57 wt% - desalter effluent – 21wt% - and spent caustic -13 wt%.
0% 20% 40% 60% 80% 100%
Crude oil tanks bottoms Desalters Spent caustic Accidentally contaminated rain water Light products tanks bottoms Heavy products tanks bottoms
- 27 - In the Sines refinery there are 17 crude oil tanks with a nominal capacity of 100000 m3 initially designed to store the feedstock of the refining process.
However, due to scheduling, logistics and inventory reasons, 4 of the tanks are used to store diesel and one of these tanks serves as slop oil tank. The crude oil received in a refinery contains a certain amount of solids and water, which are extracted from the wells together with the crude. Since water and sediments have a higher densities when compared with hydrocarbons, they tend to settle and, thus, can be periodically drained through the bottoms of the tanks [3]. The accumulation of water in diesel tanks is minor and is only due to carryover of some process water. The main accumulation of water occurs in the slop oil tank. Slop oil is mainly produced at start-up and shutdown of the refining units and in the wastewater primary treatment by recovering the carryover oil in API/CPI gravity separators and DAF unit. The scrapping of oils from the surface of water in these separators results in significant amount of water that is sent to the slop oil tank.
- 28 -
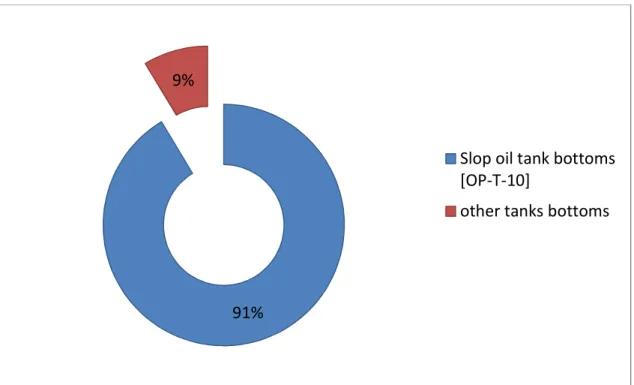
Figure 2. 7 – Average mass contribution of slop oil, diesel and crude oil tanks for ammonia wastewater contamination at the oil separator for crude oil tank area.
Based on these results, a mass balance was developed for wastewater contamination with ammonia, based on the emissions of desalter, slop oil tank and spent caustic streams. Daily samples were collected in these 3 points assuming that the analytical data obtained were valid during the entire day. The remaining emission points were assumed to have a negligible effect on the ammonia concentration. Mass balance for determination of ammonia concentration in ppm (CNH3) at the outlet of the wastewater basins (Vbasin)
shown on Figure 2. 5, was based on the equation (2. 1), which was used with analytical values of ammonia (Ci) in ppm and estimated flows (Qi) in m3.h-1 for
the different emission points for each basin.
= ∑ × ∑− × (2. 1)
91% 9%
Slop oil tank bottoms [OP-T-10]
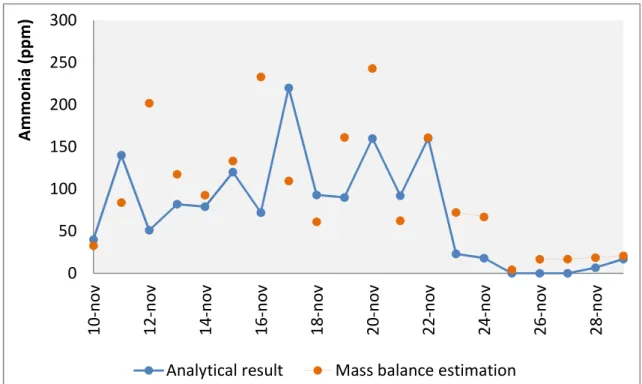
- 29 - In Figure 2. 8, the mass balance estimation to ammonia is compared with the analysis at the discharge point for the external WWTP. As can be seen, the estimations for ammonia follow reasonably well the tendency of the analytical results obtained during the observed period, which validates the initial assumptions. The observed deviations in November 12th and 16th are possibly
due to the fact that the ideality assumptions of the system of perfectly mixing and non-preferred paths are not always verified and the system is dynamic, since the high ammonia value expected for the November 16th was only
observed in the following day. Major contributions for the ammonia mass balance are indicated in Figure 2. 9, from which it can be seen that the slop oil tank has the most significant impact for the final result.
Figure 2. 8 – Ammonia mass balance estimation compared with analytical result at the discharge point for external WWTP during November 2011.
0 50 100 150 200 250 300 1 0 -n o v 1 2 -n o v 1 4 -n o v 1 6 -n o v 1 8 -n o v 2 0 -n o v 2 2 -n o v 2 4 -n o v 2 6 -n o v 2 8 -n o v A m m o n ia ( p p m )
- 30 -
Figure 2. 9 – Mass contributions of desalter effluent, slop oil tank bottoms and other emission points for the estimated ammonia value at the discharge point for external WWTP
in November 2011.
2.2.4. Slop oil tank
A slop oil tank is integrated in a system designed for recovering the crude derivate products, which are generated in the refining process, but don’t fulfill the product specifications and cannot be used or distributed without previous reprocessing or upgrading. Slop oil is generated in oil that is carried with water in tank drainage procedures, hydrocarbons that are drained from equipment’s that are going to be maintained, oil resulting from equipment cleaning, off spec products from units startup and shutdown procedures, and hydrocarbons recovered in knockout drums in flare systems [1, 3, 6].
Flare system is composed by a knockout drum for recovering of liquid hydrocarbons and for an incineration torch. Flare acts as safety system, which is used for environmental control of hazardous products discharge in emergency situations or operational problems in refining units [25]. A schematic representation is shown on Figure 2. 10.
0% 25% 50% 75% 100%
10-nov 12-nov 14-nov 16-nov 18-nov 20-nov 22-nov 24-nov 26-nov 28-nov
w
t%
- 31 -
Figure 2. 10 – Simplified scheme of a flare system [25].
- 32 -
Figure 2. 11 – Comparison between slop oil flow estimation and tank inventory variations in December 2011.
Figure 2. 12 – Volumetric contributions to slop oil flow estimations of different sources upstream of slop oil tank, with indication of flare knockout drums (FL-V1 and FL-V5) and
primary separation wastewater equipment (API, CPI and DAF) in December 2011.
0 10 20 30 40
Tank level variation (m3/h) Estimated flow (m3/h)
0% 25% 50% 75% 100%
- 33 - It becomes clear from Figure 2. 12 that the main contributors to slop oil production are the primary separators like API, CPI and DAF, in the wastewater circuit, which recover the oil carryover from tanks and equipment drainages. Still in primary separators there is no generation of ammonia, and so the possible emissions points are most likely related to knockout drums from flare system. Samples were collected in knockout drum FL-V5, but due to safety reasons, it was not possible to sample the knockout drum FL-V1. The results obtained are presented in Table 2. 2.
Table 2. 2 – Ammonia analytical results in knockout drum FL-V5 and slop oil tank bottoms in December 2011
NH3 (ppm) 7 -D e c 8 -D e c 9 -D e c 1 0 -D e c 1 1 -D e c 1 2 -D e c 1 3 -D e c 1 4 -D e c 1 5 -D e c 1 6 -D e c
FL-V5 701 701 670 510 630 590 760 720 760 970
Slop oil
tank bot. 1700 1700 3100 1500 3200 3400
- 34 - to precipitation of ammonia salts. Such precipitation of ammonia salts could have been provoked by the absence of insulation in a section of the line, which causes a sharp variation of the gas temperature. Also the reduced and occasional sour gas flow in that line, since normally it is routed to the Claus reactors for sulfur recovery, has led to that situation [26].
2.2.5. Mitigation
In face of the results, an action was immediately triggered to divert the sour gas path from the normal flare gas line and clear the obstruction in the sour gas flare line, by passing steam to clear the line. The line was readily insulated during August 2012, and in Figure 2. 13, it is possible to observe the evolution in wastewater ammonia content prior to the described actions in August 2012, which was correlated with the routing of sour gas to flare, and since this period, when sour gas is sent to sour gas flare circuit.
Figure 2. 13 – Correlation between sour gas valve opening to flare circuit and ammonia content in refinery wastewater at the discharge point for the external WWTP.
0 40 80 120 160 200 0% 20% 40% 60% 80% 100% A m m o n ia ( p p m ) v o l%
- 35 - The impact of modifications performed during the summer of 2012 were immediately observed in the reduction of the average ammonia content in the wastewater and, consequently, in the decreased number of the occurrence of penalizations, resulting from a discharge of more than 125 ppm of ammonia. These observations are presented in Figure 2. 14.
Figure 2. 14 – Ammonia average concentration in discharge point to external WWTP and number of penalizations occurrences (Ammonia > 125 ppm).
The observed results in Figure 2. 14 show that the developed worked during this PhD has resulted in great economic savings just after 2012, since in the following 3 years (2013 to 2015) the sum of penalization occurrences was smaller than the total number of situations verified yearly between 2009 and 2012. The penalizations that have occurred since 2012 are due to emergency shutdowns of the refinery, which causes the absence of steam to adequately treat the sour waters sent to SWS. The routing of the sour gas to a dedicated flaring system allows to adequate treatment and avoids wastewater contamination with ammonia.
0 2 4 6 8 10
0 30 60 90 120 150
2009 2010 2011 2012 2013 2014 2015
ppm
- 36 -
- 37 -
3.
Prediction of polar oil and grease
contamination
levels
in
refinery
wastewater
through
multivariate
statistical modeling
13.1.
Introduction
The goal of the works described in this chapter was to build up and implement a mass balance to the largest Portuguese refinery wastewater circuit. In order to fulfill this goal, a PLS model was developed to predict the polar O&G concentration in the effluent of the kerosene caustic washing unit, due to its major impact to this pollutant concentration in the system. The results of the PLS model are used as inputs to the mass balance.
1 This chapter was partially published as a scientific article with the reference: Santos, B.,
- 38 -
3.1.1. Spent caustic impact
The production, management and treating of spent caustics are a subject of growing interest due to the hazard and toxic nature of this byproduct. The level of spent caustic contamination is related with the chemical composition of the treated hydrocarbon in caustic washing units, and with the process operating conditions. As described in previous sections, the discharge of spent caustic directly to wastewater circuit contributes to increase the pollution levels. In the particular case of the refinery, this augmentation is observed in COD and polar O&G with significant impact in classification and costs of the discharged wastewater to external WWTP. The market presents several solutions to mitigate the noxious effects of spent caustics. However its application depends on the contamination degree of caustic, the refinery dimension and configuration, and the maximum accepted toxicity for existing biological treatment solutions downstream [21]. Therefore is of great interest the development of contamination models that can predict the impact of spent caustic discharge and establish a relation with operating conditions and properties of the feedstock. Still, and despite the relevance of this topic, I was neither able to find in the open literature correlations or models for prediction of polar O&G pollution, nor for any other of the analytical parameter considered in this thesis. The literature only provides some anticipated values or range of values [1, 3, 4, 6, 21].
3.1.2. Multivariate statistical methods
The description of any dynamic system can be done by using different type of models, such as mechanical, black box, qualitative and statistical models.
- 39 - mechanical models to industrial systems with wide and constant variations in operating conditions is of difficult implementation [28].
Black box models describe simply the functional relations between inputs and outputs. Parameters used by this type of models do not have any physical or chemical significance, like mass transfer coefficients or reaction taxes [29].
The application of qualitative methods is preferred when the nature of the process is more embracing than the simple mathematical description, e.g. the processes which physical limits present discontinuity points. In these cases “If-Then-Else” rules are introduced [29].
The need for statistical models results from the uncertainties and variability of certain processes, like industrial processes. This type of models allow to overcome the limitations of mechanical models using process data bases in order to develop a correlation between the different inputs to obtain a prediction of the output [27, 28]. Among the different methodologies to develop statistical models, PLS is one of the most popular ones. This mathematical tool can be used to identify and obtain information from the most significant process variables and their relation with the behavior of a certain output [30]. PLS as the advantage that can be used with extended process database that normally have some co-linearity between the different variables, missing values, noise and variables of different magnitude [31, 32].
3.1.3. Projection to Latent Structures (PLS)
- 40 - dimensions n x k. The same n events are collected for the j dependent variables, which are intended to be the output of the model, and organized into a matrix
Y with dimensions n x j. The PLS methodology decomposes matrixes X and Y
into a product of groups of orthogonal factors with a matrix of specific weightings [34]. Independent variables are presented accordingly with equation (3. 1), into a product of a weighting matrix T by a loadings matrix PT.
X = T. PT (3. 1)
The dependent variables matrix is similarly decomposed as shown on equation (3. 2).
Y = T.B.CT (3. 2)
Using PLS methodology the matrix T is built in order to allow for an adequate description of the input matrix X at the same time that allows for an adequate estimation of the output results matrix Y. With this arrangement, is possible the determination and interpretation of the used variables for modeling the desired predicted values.
3.2.
Materials and methods
3.2.1. Wastewater sampling and analysis
- 41 - unit is the main contamination source of the refinery wastewater. With the goal of developing a statistical model based on PLS for the kerosene caustic washing unit, 60 spent caustic samples were collected in the continuous effluent from this unit, during a representative period of 7 months. The distribution of sampling along the time allowed to have samples from diverse operating conditions and different feedstock properties. After development of the models, samples from the clarified effluent of dissolved air flotation unit were collected during 2 years in order to prove the adequacy of the predictive tools. Oil and grease concentration in wastewater and spent caustic samples was determined employing standard method SMEWW 5520 C. The quantification of polar and hydrocarbon fraction was made with the analysis SMEWW 5520 F [8, 11].
3.2.2. Process data
- 42 -
Table 3. 1 – Process data used as inputs for PLS model development for prediction of spent caustic contamination with polar oil and grease
Type Parameter
Used in PLS model
Symbol Source Unit Range Average Standard deviation
Input
Crude oil
density No ρC
Online
analyser kg.m
-3 [0.82; 0.88] 0.84 0.02
Kerosene
density No ρK
Online
analyzer kg.m
-3 [0.79; 0.81] 0.80 0.004
Crude oil naphthenic
acidity
Yes TANC
Linear
model mgKOH.g
-1 [0.06; 0.77] 0.39 0.24
Kerosene
sulfur content Yes %S
Linear
model wt% [0.04; 0.23] 0.12 0.05 Kerosene
mercaptan
content Yes RSH
Linear
model ppm [43; 399] 262 66
Kerosene naphthenic
acidity
Yes TANK
Linear
model mgKOH.g
-1 [0.02; 0.32] 0.20 0.12
Kerosene flow Yes QK
Online
analyzer m
3.h-1 [67; 134] 114 26
Output
Polar oil and grease in spent
caustic
--- PO&GSC
PLS
model ppm [32; 31254] 15874 10688
3.2.3. PLS modeling of the kerosene caustic washing unit
- 43 - of data to be evenly distributed and that the initial weighting is the same for different variables. The data matrix obtained after normalization was randomly split in 75%/25% matrixes. The greater matrix was used for training the PLS model. The remaining data was used as a validation set and to adjust the weight of each variable. Despite the random distribution, the training and validation set were verified in order to assure that the events used for validating PLS model were representative of the training set, i.e. to avoid an extrapolation in results prediction using validation data. The PLS model for kerosene caustic washing unit has followed a methodology previously employed in biological membrane bioreactors modeling [31], which was adapted in order to correspond to the requisites of this work.
Multivariate statistical models developed with PLS methodology use a combination of x independent variables that are weighted with a factors accordingly their relation with the desired output y, as described by equation (3. 3).
# = $. & + (. &)+ *. &++ ⋯ (3. 3)
In order to improve the predictive capacity of multivariate model and in order to explain possible additional relations, interaction and quadratic variations of the parameter listed in Table 3. 1 have been used. This approach results in a statistical model described by equation (3. 4), which can have complex interactions and non-linear terms.
# = $. & + (. &)+ *. &+ + ⋯ + . &)+ -. & . &
)+ .. & . &++ ⋯ (3. 4)
- 44 - of polar oil and grease concentration in spent caustic. In order to eliminate the unnecessary data, 3 different selection mathematical methodologies were used: ISE method based on iterative elimination by-step [36], elimination step-by-step [37], and Martens uncertainty test [35], using the jackknife methodology [38]. Application of these methods allows for the elimination of the unnecessary variables to output estimative, which as the advantage to have a better prediction with less parameters. Each methodology has resulted in a model with a different number of parameters. Multivariate equations were compared based on slope and correlation coefficients (/)) of the tendency lines obtained in parity graphs, that plots the predicted value and the analytical result, for the training and validation sets. For the evaluation of the predictive capacity of each obtained model it was also used the Root Mean Square Error of Prediction (RMSEP) which indicates the error of the prediction by the validation set. The selection of the optimum number of latent variables in PLS regression was based in the lower value of the RMSECV: Root Mean Square Error of Cross Validation. RMSECV indicates the error of the training set by cross validation calculation as indicated in equation (3. 5) where # is the experimental value for the statistical event i, #10 is the estimated value by the PLS model for the same event i, using a data set of N-i events, where N is the total number of observations used for PLS model development.
/234 = 5∑ #1 − #"0 ) (3. 5)
In this work there were 60 observations. PLS models were developed in Matlab
- 45 -
3.3.
Results and discussion
3.3.1. Modeling of polar oil and grease content in the spent caustic effluent
The 60 observations gathered for the variables indicated in Table 3. 1, were used for the development of a multivariate statistical model for polar oil and grease prediction in spent caustic effluent from a kerosene caustic washing unit. In order to allow for a simple interpretation of the relation between latent variables and the estimate contamination of wastewater by soluble oil, it has been developed a model based only on linear combinations between independent variables. The evaluation terms for the best model obtained accordingly with this principle, are presented on Table 3. 2.
Table 3. 2 – PLS models, captured variance and correlation coefficients for validation and training sets
PLS model Captured variance (%)
RMSEP (ppm)
Validation set correlation coefficient
Training set correlation
coefficient
Only linear terms 76.5% 3014 0.94 0.76
Interaction and
quadratic terms 96.1% 2582 0.94 0.96
- 46 - method ISE, which regression coefficients are indicated in Figure 3. 1. The observation of the selected variables shows that none of the terms related with crude oil and kerosene density was selected to polar oil and grease prediction model. The lack of this parameters could be related with the small variation range of the product densities during gathering of experimental values, which have no impact on spent caustic quality.
Figure 3. 1 – Regression coefficients of model inputs for polar oil and grease contamination level in the effluent of the kerosene caustic washing unit.
Regression coefficients selected to PLS model indicate that a higher concentration of soluble oil in spent caustic occurs with the increase of kerosene flow to caustic washing unit, which could be related with the higher turbulence in prewash column and greater contact efficiency between kerosene and caustic. An intimate contact between hydrocarbons and aqueous phase promotes the extraction of pollutants from the product. Also, the data suggests that an increase of spent caustic contamination is associated with higher values
![Figure 1. 1 – Crude desalination unit scheme [4].](https://thumb-eu.123doks.com/thumbv2/123dok_br/16503440.734137/29.892.153.780.130.434/figure-crude-desalination-unit-scheme.webp)
![Table 2. 1 – Typical composition of a naphthenic spent caustic from a kerosene caustic washing unit [18, 21]](https://thumb-eu.123doks.com/thumbv2/123dok_br/16503440.734137/45.892.164.769.725.984/table-typical-composition-naphthenic-caustic-kerosene-caustic-washing.webp)