A Framework for Enterprise Context Analysis Based on
Semantic Principles
Miguel Ferro-Beca1, Joao Sarraipa1
, Carlos Agostinho1, Fernando Gigante2, Maria Jose-Nunez2, and Ricardo Jardim-Goncalves1
1 Centre of Technology and Systems, CTS, UNINOVA,
2829-516 Caparica, Portugal {mfb, jfss, ca, rg}@uninova.pt
2AIDIMA- Institute of Technology for Furniture and Related Industry, Benjamín Franklin, 13.
Parque Tecnológico 46980 Paterna, Valencia, Spain
{mjnunez, fgigante}@aidima.es
Abstract. Context analysis can be a daunting task given the vast amounts of information available and the work required to filter through all of it. Additionally, the process of performing context analysis on a specific company, although it may be done following a specific methodology, it is not a science which set in stone. Different approaches are possible, and the availability of new data sources, ranging from sensor data to web analytics data, can certainly enrich the process. However, there is a need for tools and methods, which can assist in tapping into these new data sources and extract relevant information that can assist enterprises in their context analysis process. The present paper proposes a framework that can assist in obtaining, filtering and processing relevant data from a variety of sources and in performing the necessary processing and reasoning to assist in performing a proper context analysis.
Keywords: Sensing Enterprise, Semantic, Linked Data, Blueprints
1.
Introduction
There has been recently much discussion around the explosive growth of data in the last few years. We are living in historic times, as the world is producing more data than ever before and that trend is only going to continue. The proliferation of electronic devices, from mobile phones, to tablets and PC´s, as well as, the increasing dissemination of sensors in a wide variety of scenarios are some of the reasons for this growth, which will not decelerate anytime soon. [1]
Although the proliferation of software analytics tools has been quite positive, the fact is that many, if not most of these tools focus mostly on data sources within the borders of the enterprise, such as its own databases, documents, etc.
However, there are a myriad of new data sources outside the walls of the enterprise, which must also be analyzed, as they can have an effect on the current or future affairs of an enterprise.
One such example is the proliferation of sensors and the growth of the Internet of Things (IoT). Although sensor data may in fact be already used by many businesses, in certain sectors it is not yet widely used. For instance, in the manufacturing sector, most sensor data goes mostly unused. For example, in the United States, only 35% of manufacturers are using the sensor data, which they collect. [2] The appearance of IoT-enabled devices will require enterprises to adapt themselves to this new data source and to learn how to extract tangible business value from it.
In addition to the above, there are additional sources of data and information that are just recently being explored. An example is the usage of Google Analytics data for economic indicator prediction. In [3], it details how the Bank of England has already been using Google Trends as a tool to obtain more current information than the official statistics. The results so far have been very interesting, as “the Bank believes that trends in searches for estate agents have been a better predictor of future house prices than even established surveys by property bodies such as the Royal Institute for Chartered Surveyors or the Home Builders Federation” [3]. Additionally, “Searches for Jobseeker’s Allowance, meanwhile, are at least as reliable as a way of gauging current unemployment rates as the actual number of claimants for the main jobless benefit” [3]. Such economic indicators could be of use to many enterprises in order to determine economic cycles or business trends in their specific sectors.
Another example of innovative utilization of the web for financial or economic analysis is the usage of Twitter posts as an aid in stock market prediction. A paper by Bollen, Mao and Zeng [4] reveals that an analysis of emotional words from Twitter posts can be used to predict the daily movements of the Dow Jones Industrial Average index with an amazing 87,6% percent accuracy. Based on this, Derwent Capital Markets decided to invest around $40 million USD on a investment fund whose strategy was based on the above strategy [5].
Other initiatives that make use of available web data are:
• The Billion Prices Project [6] at MIT collects prices from hundreds of stores around the world and uses that data to study pricing behaviour and inflation.
• The Global Pulse project from the United Nations aims to research “innovative
methods and frameworks for combining new types of digital data with traditional indicators to track global development in real-time” [7].
• Economists in the City of San Francisco [8] utilize a variety of alternative data sources in order to better gauge the economic health of the city. Some examples of the data collected include subway passenger traffic data, parking garage usage data, and prices for rental property, furniture, concert tickets and other services and goods, collected from real estate websites and classified advertising sites, such as Craigslist.com.
Interstate Highway 5 from California to Oregon, a major timber-trucking route, are a leading indicator of construction employment in California” [8].
The above are just a few examples of how data collected through the web or through alternative methods can be a helpful tool in assisting enterprises in making better business decisions. Most financial and economic data is reported at regular intervals (ie. Quarterly or monthly) and is usually lagging the events in the real world. One of the major advantages of some of the above alternative data sources is that they can be collected more frequently, on a daily basis or even in real-time, thus providing a much clearer picture of a company’s activity or the overall economic activity of a region. For example, if a rise in unemployment or an unexplained rise in prices can be detected early on, then economic agents (government, enterprises, investors, consumers) can react more quickly to counteract upcoming adverse economic cycles. Likewise, if businesses can also detect a fall in unemployment or a rise in road traffic, they can more quickly adapt to an upcoming booming economic cycle.
The next question that follows is whether businesses should strive to gather and make sense of all these new data sources. Just because they are available, it does not make them automatically relevant to all enterprises.
However, a study by McKinsey & Co [9] highlights five ways in which big data can help create value:
1. It can unlock significant value by making information transparent and usable at much higher frequency.
2. Second, as organizations create and store more transactional data in digital form, they can collect more accurate and detailed performance information on everything from product inventories to sick days, and therefore expose variability and boost performance.
3. Third, big data allows ever-narrower segmentation of customers and therefore much more precisely tailored products or services.
4. Fourth, sophisticated analytics can substantially improve decision-making. 5. Finally, big data can be used to improve the development of the next generation
of products and services. For instance, manufacturers are using data obtained from sensors embedded in products to create innovative after-sales service offerings such as proactive maintenance (preventive measures that take place before a failure occurs or is even noticed).
Given all the above examples, it is paramount that enterprises are equipped with the proper tools and skills in order to make the most of the data they collect and to use it effectively. However, in order for all this data to become useful, it is necessary to deal with several issues, namely:
• A wide variety of data formats, which requires tools that are able to process them;
• Vast amounts of new data sources have been made available through the use of APIs. However, given the specifics of each API, although they facilitate the sharing of data, they still require some work in order to extract data through them;
• Some data formats (i.e. XML, XBRL, RDF, JSON, etc.) are easily processable; however, other types of data, such as text from news sources require additional work to extract relevant information;
• Handling of possible new economic indicators – New data sources may provide new insights which may be currently ignored;
• Lack of proper visualization techniques - Visualization assists in understanding data in a different way.
The aggregation of disparate sources of heterogeneous data is already under way, as many researchers have been integrating Open Data [10] and Linked Data [11] and other data sources, with the aid of Semantic Web technologies. However, the aforementioned issues as well as others related to the validity of the data sources, are obstacles that ongoing research in this area is still facing.
Based on the above issues, there is a need to develop a new framework which can aggregate and process the aforementioned data sources, but having the flexibility to adapt itself to new data sources at they emerge. Such a framework should provide new forms of data analysis, which may be helpful in gathering new insights into companies and the context in which they operate.
This paper aims to propose a framework, which can assist in addressing most of the aforementioned issues. It first begins with a literature review of relevant topics, such as, company analysis and its relevant data sources. Afterwards, the paper addresses the context awareness development process and what is necessary to perform it. Once this conceptual foundation has been laid, it then proceeds to present the suggested framework, followed by a proposed architecture. Lastly, it provides a description on how part of the proposed framework have been validated within the context of the Furniture Living Lab (LL) of the IMAGINE project.
2.
Literature Review
2.1. Company Analysis
Enterprises cannot survive in isolation or detached from their environment. They exist and are integral part of specific geographic and business communities, and they are both change agents and are changed by many environmental factors that affect them. The factors that can affect the success of any enterprise are various, and they can range from physical location and geographical constraints, to the economic environment in which it operates, to business regulations, political events, among many other variables. Therefore, in order to successfully operate and deal with current and future challenges, it’s imperative that enterprises are able to have a good grasp on the many variables which affect their business environment, and must also be able to proactively prepare themselves for future challenges.
In the business realm, the study of the business environment in which an enterprise
operates is defined as “context analysis” [12], although other terminology is often used,
such as SWOT analysis, amongst others [13]. Some of the aspects, which are the subject of attention in context analysis, may include the following:
This may include the analysis of the political, economical, social, demographic and technological trends.
y Competitor Analysis – The objective of this type of analysis is to gather information on existing and possible competitors, and how their activities may affect an enterprise.
y Opportunity and Threat analysis – This dimension determines possible business opportunities or business threats. This analysis may build upon the trend and competitor analysis, or it may come from studying other types of data and information (i.e.: disruptive technologies)
y Organizational analysis – Lastly, the focus of context analysis is internal, as it determines whether an enterprise has the required resources (human, financial, technical, etc) in order to take advantage of the business opportunities, or to face the potential business threats identified above.
Business literature, namely, literature focused on strategic management, may provide various other possible methodologies for performing strategic context analysis (i.e.: Porter’s Five Forces Analysis, etc), however, whichever methodology may be used, it is some sort of variation with regards to the actors and/or environmental factors analyzed.
Traditional context analysis is usually performed by internal employees (i.e.: business analysts) of an enterprise, usually aided by external business consultants, who then rely on the research departments of their consultancy firms for access to relevant business data related to the economic environment, competitors, etc. Apart from being expensive and time consuming, traditional methods often relied on data which was limited in its availability and not very frequently updated.
The advent of Internet, Social Media and Big Data brought with it a new whole variety of data sources, which can possibly enable a more in-depth and accurate context-analysis for any enterprise. Some of the possibilities include, but are not limited to the following:
y Analysis of Social Media for customer sentiment and online tracking of reputation for an enterprise and its competitors
y Analysis of Search analytics for business, economic and social trends
y Access to wide variety of open data sources, statistical data, etc
y Ability to use web crawlers to extract more specific information and data from other websites
y Access to real-time data from sensor networks, IoT data, etc.
While the new data sources provided by the new digital age may not replace proper context analysis and the work of business analysts, it can however, facilitate their job and provide further insights which otherwise would not be available, if only traditional data sources were to be utilized.
It is therefore one of the main objectives of the present paper to provide a framework and a methodology on how to integrate these additional sources of data and information.
2.2. Sensing Enterprise & Context Awareness
With the advent of the IoT, the FInES community developed the sensing enterprise
multi-dimensional information captured through physical and virtual objects and providing added value information to enhance its global context awareness” [14].
The concept refers to an enterprise which can make use of both physical and virtual sensors in order to collect, gather and process information from multiple sources, and then use this information to enhance an enterprise’s context awareness, which will ultimately lead to better and more pro-active decision making, by allowing it to anticipate certain events and to react in a more timely way when certain events take place.
As stated in [15], “the sensing enterprise concept leverages the power of sensor networks and decentralised intelligence to perform analysis and decision making both in synchronised real and virtual worlds”. The usage of sensor networks and decentralised decision making systems creates a change in the boundaries of the enterprise, in terms of where an enterprise gathers and collects data for its decision-making processes.
In order to establish the sensing enterprise vision, one of the first activities, which must be performed, is the proper identification of potential data sources, which are of relevance, whether they are physical or virtual in nature.
The foremost type of data in the sensing enterprise, as the concept implies, comes from sensors. Perera et al. in [16] define the following three major types of sensors:
1. Physical sensors – These sensors are tangible and generate data by themselves. They are utilized to gather data from the physical world, such as temperature, wind, humidity, touch, microphones, etc.
2. Virtual sensors – Unlike physical sensors, they do not generate data by themselves, but they retrieve data from other sources and publish it as sensor data, thus providing information, which cannot be measured physically. Examples include calendar data, contact details, maps, and social networking data, amongst many others.
3. Logical sensors (software sensors) – These sensors combine data from physical and virtual sensors in order to produce meaningful information. They are used to collect information, which may require advanced processing and fusion of data. An example of a logical sensor could be a web service dedicated to provide weather information. Such a web service could include current weather data from physical sensors, as well as, data from virtual sensors, such as maps, historic data, etc.
Within the realm of the sensing enterprise, all of the above sensor types may be used, according to the specific needs of the enterprise in question. Some may rely more on physical sensors, whereas certain business activity sectors may rely more on virtual and logical sensors. However, appropriate methodologies must be utilized in order to deal with each type of sensors.
As stated earlier, the “sensing enterprise” concept is closely related to context
-awareness, as one of the goals of collecting and processing sensor data is to enable an enterprise to have a much more accurate and well-defined picture of the context in which it operates.
The concept of context-awareness has usually revolved around the mobile and ubiquitous computing domains.
applications, namely with the goal of facilitating the implementation of the sensing enterprise concept.
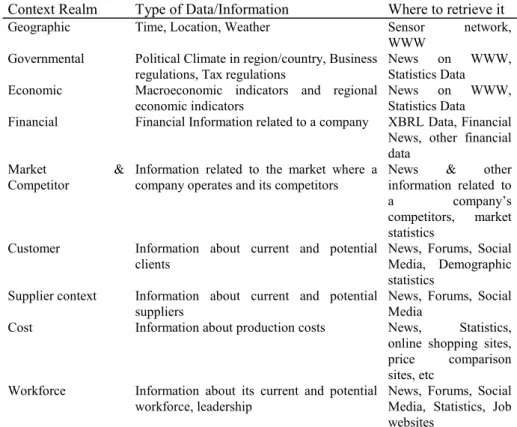
Since context relates to the circumstances that form the setting for an event, statement, or idea, and in terms of which it can be fully understood [17], it is therefore appropriate to identify what are the relevant context relevant realms, which may influence the activities of a sensing enterprise. Consequently, its related information that is able of defining the mentioned circumstances that form an event or idea must be gathered. Table 1, suggests some of the most relevant realms for which data and information should be collected:
Table 1. Sensing Enterprise Context Realms
Context Realm Type of Data/Information Where to retrieve it
Geographic Time, Location, Weather Sensor network,
WWW Governmental Political Climate in region/country, Business
regulations, Tax regulations
News on WWW, Statistics Data
Economic Macroeconomic indicators and regional economic indicators
News on WWW, Statistics Data
Financial Financial Information related to a company XBRL Data, Financial News, other financial data
Market & Competitor
Information related to the market where a company operates and its competitors
News & other information related to
a company’s competitors, market statistics
Customer Information about current and potential clients
News, Forums, Social Media, Demographic statistics
Supplier context Information about current and potential suppliers
News, Forums, Social Media
Cost Information about production costs News, Statistics,
online shopping sites, price comparison sites, etc
Workforce Information about its current and potential workforce, leadership
News, Forums, Social Media, Statistics, Job websites
The above are some examples of possible data which could be collected for analysis and processing, as they can provide a much richer perspective on the business environment in which a sensing enterprise is operating.
Based on the context aspects identified above, it is possible to identify common types of data, which must be properly dealt with for processing and information extraction. The common data types are as follows:
• Sensor data - Data may come directly from sensors or it can come from Middleware and APIs, Web Services, etc.
• News sources - News sites can provide information in Free text, RSS feeds, Linked Data
• Social Media - APIs, Free Text and other tools • Web sites, Online Forums - Free Text, APIs
• Legacy systems, other systems - A company may also decide to utilize some sort of legacy system or to connect to other less common data sources, for which custom adapters may be required.
• Web Crawlers – In the cases where data or information is not available through an API or other easily accessible form, web crawlers may be utilized to extract relevant data and information from public websites.
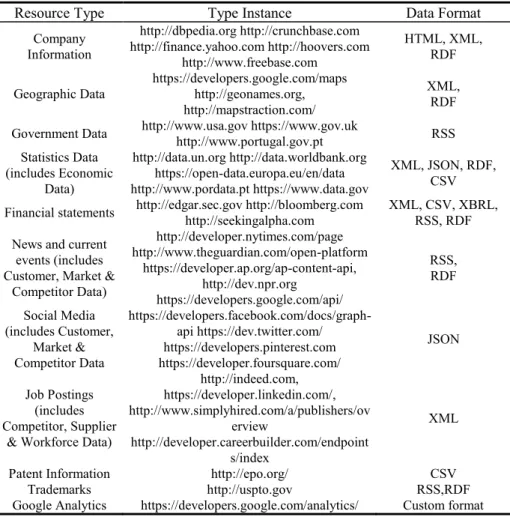
The following tables provide some examples of possible data sources, which can be used in the process of acquiring data and information towards context-awareness development in the sensing enterprise:
Table 2. Sources of Data and Information for the Sensing Enterprise
Resource Type Type Instance Data Format
Company Information http://dbpedia.org http://crunchbase.com http://finance.yahoo.com http://hoovers.com http://www.freebase.com HTML, XML, RDF Geographic Data https://developers.google.com/maps http://geonames.org, http://mapstraction.com/ XML, RDF
Government Data http://www.usa.gov https://www.gov.uk
http://www.portugal.gov.pt RSS Statistics Data (includes Economic Data) http://data.un.org http://data.worldbank.org https://open-data.europa.eu/en/data http://www.pordata.pt https://www.data.gov
XML, JSON, RDF, CSV
Financial statements http://edgar.sec.gov http://bloomberg.com http://seekingalpha.com
XML, CSV, XBRL, RSS, RDF
News and current events (includes Customer, Market &
Competitor Data) http://developer.nytimes.com/page http://www.theguardian.com/open-platform https://developer.ap.org/ap-content-api, http://dev.npr.org https://developers.google.com/api/ RSS, RDF Social Media (includes Customer, Market & Competitor Data https://developers.facebook.com/docs/graph-api https://dev.twitter.com/ https://developers.pinterest.com https://developer.foursquare.com/ JSON Job Postings (includes Competitor, Supplier
& Workforce Data)
http://indeed.com, https://developer.linkedin.com/, http://www.simplyhired.com/a/publishers/ov erview http://developer.careerbuilder.com/endpoint s/index XML
Patent Information http://epo.org/ CSV
Trademarks http://uspto.gov RSS,RDF
The above table is by no means exhaustive, however, it serves to illustrate that there are many other alternative sources of data and information, which can be explored and utilized to expand the context-awareness capabilities of the sensing enterprise.
In terms of data integration, there are already several web-based tools and platforms which provide integration of different data sources and APIs. Such examples include Yahoo Pipes, tray.io, ifttt.com, Zapier. However, much of the focus of these tools is on integration and automation, not necessarily on extracting potential information or knowledge from the data.
Regardless of the data source, the transformation of data and/or information into actionable knowledge, which will then be applied into proper decision-making, requires proper methodologies and tools, as described in the following sections.
3.
Context-Awareness Development Approach
3.1. Knowledge and Context representation integration
In order to fulfil the sensing enterprise paradigm, collected data must undergo further processing in order to become useful in the decision-making process of an enterprise. The key towards reaching the full potential provided by data depends on a system’s intelligence and interoperability levels as represented in Figure 1. This means that how much a system is able of handling the information collected to autonomously react or make decisions represents a higher level of sensing enterprise readiness, which directly depends on its interoperability and intelligence capability.
Fig. 1. Semantic Web Layers [12]
It is therefore understandable that increased levels of autonomy for decision making systems will require an increased level of context awareness, with the goal of achieving the “Understandability” of the presented KRRM. Since data is the building block for the acquisition of Information, Knowledge and, eventually, Wisdom, to then enable the building of the various knowledge representation elements and assets, all the data management dimensions must be addressed. The various levels of the KRRM help on the definition of such data management dimensions:
• Data – Data is the building block of information and it can be represented by symbols, numbers or characters.
• Information – Information is data with semantic label, with intention to be useful in certain conditions.
• Knowledge – Knowledge is information in the context in which it originated. It requires that the semantic labels that transform data into information is described meaningfully, in the context that they originated in the system of origination [18]. • Awareness – Awareness is knowledge in a time-sensitive context. This
requirement leaves the realm of static knowledge and enters the levels of dynamic knowledge. The information-in-context of the knowledge requirement level now must be able to be represented in a time-sensitive way, as the context may change dynamically with the life of the system [18].
• Understanding – Understanding is awareness with intentionality, “which relies on not only having a method for representing knowledge in a time sensitive context, but also anticipating the intentionality of the originating system, such that the dynamic worldview can be anticipated” [18].
• Wisdom – Wisdom is the understanding with reflection, which sometimes could put in probe previously acquired knowledge. It seeks to build upon all the previous levels of knowledge representation, checking its validity by (philosophical) learning to assist in making informed decisions.
context-awareness features. The following KRRM levels represent the situations to which systems are able to operate automatically handling some dynamic situations, representing that they have reached the awareness capability of intelligence thus operating at the Dynamic Interoperability levels. The goal of the sensing enterprise paradigm is that enterprises are able to operate at these levels namely at the first stage of “Understandability”, whereby automated systems make most of the decisions based on proper methodologies and data processing techniques and only communicating such decisions to humans if asked.
Hence, accordingly to this, Kahn et al. in [19] proposed the most relevant contextual data quality dimensions:
• Value-added – This dimension refers to the benefits and advantages provided by the data.
• Relevancy – The data, and subsequent information and knowledge extracted from it, must be appropriate for the context in which it is used. The relevancy of certain types of data will vary according to the context and application.
• Timeliness – The development of context awareness capabilities within an enterprise relies heavily on the timeliness of data. Certain context-aware applications may require real-time data or close, in order to be of benefit to the enterprise.
• Quantity – Data must be available in the appropriate quantity and volume in order to be beneficial in a context-awareness application. In a way, this dimension is related to timeliness as real-time data, is not only timely, but data, which is available in quantity and volume.
• Completeness – As stated in [19], this dimension refers to the extent to which data “are of sufficient depth, breadth, and scope for the task at hand”. Although related to the other dimensions, it differs in that data may be relevant and timely, but can still be incomplete.
The progression from data to knowledge and context-awareness must take into account the lifecycle management of each dimension. Likewise, [17] has also proposed an information management methodology consisting of 5 steps:
1. Identification of information needs, 2. Information acquisition,
3. Information organization and storage, 4. Information distribution and
5. Information use.
With regards to knowledge management, many possible approaches exist. However, the approach presented also in [17] synthesizes other approaches into the following steps:
1. Identification of knowledge needs 2. Discovery of existing knowledge 3. Acquisition of knowledge 4. Creation of new knowledge
5. Storage and organization of knowledge 6. Sharing of knowledge
Lastly, [13] presents the following four steps in the context life cycle:
1. Context Acquisition - Context data acquired from physical or virtual sources 2. Context Modelling – Translating context data into meaningful information
(context information)
3. Context Reasoning – Context data is processed to derive high-level context information
4. Context Dissemination - Sharing of context information
3.2. Approach for enterprise context awareness achievement
Analysing the above methodologies for information and knowledge management, as well as, the context life cycle, there is a pattern in the steps around the lifecycle and management of any of dimensions described above, in terms of acquisition, organization and/or reasoning and application. Based on the above information, Figure 2 proposes an approach for an integrated approach to data, information and knowledge management, taking into account the added dimension of context-awareness in the sensing enterprise.
The proposed approach rests on the assumption that data can be acquired from either physical (IoT) or virtual sensors (existing databases, spreadsheets), while information may be acquired directly from information sources (i.e.: documents, linked data, etc) or from data sources after data reasoning. The knowledge may be acquired through reasoning of existing information or created by users. Context-awareness can be achieved by reasoning over related information. In this approach, both context-awareness and knowledge are assumed to be dependent upon each other. Knowledge acquired can change given the context, and is thus context-dependent. On the other hand, proper evaluation of a given context is dependent upon existing knowledge. To further illustrate this point, we can utilize the example of ‘football’ as a concept. In the
United States, ‘football’ is understood as the sport to which the rest of the world calls
‘American Football’, whereas ‘soccer’ is in the US what ‘football’ is for the rest of the world. A multitude of examples could be identified, where the same information can be used to achieve different sets of knowledge bases, based on different contexts, as data, and subsequently, information can have multiple uses.
The other side of the inter-relationship between context-awareness and knowledge can also be illustrated by the fact that knowledge can assist in correctly identifying a given context. Knowledge will enable a system to interpret sensor information from various sources, and make the connection between them in order to correctly identify the current context.
Fig.2. Conceptual View of Approach to Context-Awareness Development
The process of data reasoning revolves around the use of data mining principles (2), which can enable the extraction of relevant information from the data collected. Additionally, a sensing enterprise system can receive information directly from other information sources (3), such as existing documents, news sources. Such information acquisition can be either automatic or made with user assistance. However, one of the issues in the information acquisition process is related to Semantic Interoperability, as the concepts of information being acquired must be properly related. The process of obtaining context-awareness (6) and knowledge (4) from existing information follows a similar approach. Knowledge inference implies making connections between various information facts, whereas context-awareness inference implies performing the same connections but only with related information. However, whereas context-awareness is only inferred from existing information sources, knowledge can be created directly by end-users and must also be properly stored for future use and sharing amongst other users.
As previously described, there is a sort of symbiotic relationship between knowledge and context-awareness (7), as they are both dependent upon each other. Knowledge assists in proper evaluation of a specific context and context-awareness is relevant to ensure that relevant knowledge is acquired. However, proper knowledge reasoning also rests on correct identification of the context in which an enterprise is operating.
4.
Semantic Framework & Methodology for Enterprise Context
Analysis
4.1. Framework Overview
The previous sub-sections have touched on the many aspects of the sensing enterprise and the context-awareness, but it is now necessary to create a coherent methodology and framework which can put into practice the most relevant of the aforementioned principles and address the challenges which were previously described.
The present research work intends to contribute towards the improvement of data integration of heterogeneous sources of data to be used in context analysis and the implementation of the sensing enterprise by proposing a framework and methodology titled SEFRAMECA - Semantic Framework & Methodology for Enterprise Context Analysis
The solution proposed aims to tackle the most common issues facing data integration and analysis by providing a methodology and a framework which offers flexibility and openness, to deal with current and future data formats.
In order to achieve its goals, the SEFRAMECA will offer the following: • Integration of tools for data extraction from different data formats
• Methodology for data integration and modelling of data from distinct sources • A custom platform for data analysis based on existing open-source data analysis
tools.
The proposed framework provides the necessary tools to assist in data engineering tasks, namely, the data extraction of select data formats, as well as a methodology to assist in the subsequent integration and proper data modelling. The data extraction components shall be based upon existing open-source software tools, as the focus of the framework is beyond data engineering.
In light of this, the suggested framework & methodology shall be divided into two main areas:
• Data engineering – The focus is on all the methods and tools necessary to acquire relevant data and transform it into a format which makes it ready for analysis. • Data analysis – The focus is upon utilizing and combining existing data and
information sources in order to gather relevant conclusions, which can assist in decision-making within the enterprise.
The reason for this separation has to do with the need to separate functionalities and tools from different users. The Data Engineer is focused on the process of searching data sources, extracting data and transforming it into a usable format and has, therefore, a more technical orientation. The Data Analyst (or Data Scientist) is more concerned with applying data analysis techniques in order to gather insights from the data, which can assist in decision-making.
and the semantic mismatching issues which arise when performing data integration from heterogeneous data sources.
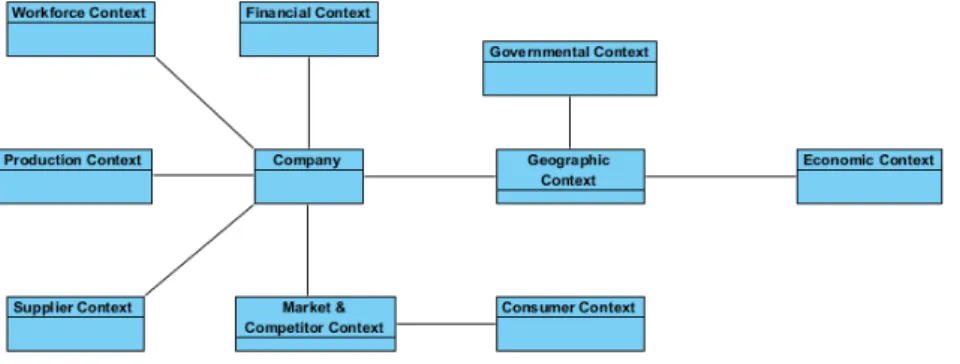
Fig. 3. Enterprise Context-Awareness Blueprints
Lastly, although a plethora of data analysis tools exist in the market today, their focus tends to be generic in nature. The proposed framework intends to provide a customized data analysis tool focused on the enterprise and its issues.
4.2. Data Engineering Methodology – Blueprint Definition
In order to perform proper data analysis, the first step is to obviously gather relevant data. But, before the data gather processing can begin, which data is relevant must first be defined. Therefore, the first step in the methodology is related to the definition of Data blueprints.
Based on the most common context areas of relevance to the enterprise and on the concept of blueprints, the Data Engineering Process must begin by the development of specific data blueprints, which will serve as a common semantics framework upon which all relevant data can be mapped to.
Figure 3 provides a general overview of the set of blueprints that should be implemented.
The enterprise context-awareness blueprints may be described as follows:
• Company Blueprint– Serves as the central point of reference to all other blueprints, as it is used to store relevant information about the company, such as name, contact information, description, activity sector, and key personnel, among others.
• Geographic Context Blueprint – The geographic context blueprint is utilized to store data related to location-dependent data, such as local time, current weather, and data related to the physical location of a company and its surrounding environment. This location dependent data is very relevant in that, and it is utilized to gather other relevant data related to the geographic environment where a company operates.
include information regarding the current political events, data on current tax rates, and regulations amongst other.
• Economic Context Blueprint – Since enterprises operate in the context of a local economy, this blueprint will store relevant economic data related to the country(ies) and region(s) where it operates. Relevant data could be GDP, interest rates, economic forecasts, relevant economics statistic data, relevant economics news, etc.
• Financial Context Blueprint – This blueprint will store financial data related to a company and its competitors, such as current stock price, historical stock prices, financial reports, and related news.
• Market & Competitor Context Blueprint – This specific blueprint will store data related to the specific competitors of a company, as well as, relevant data specific to the sector(s) in which it operates, such as market size, company’s market share, expected growth rates, sector news, prices on competitor’s products/services, etc.
• Customer Context Blueprint – The blueprint will be utilized to store data related to existing and potential customers of the company. It can include demographic data, as well as, sentiment analysis data based on public perception of the company, amongst others.
• Supplier Context Blueprint – Just as important as being aware of your customers, it is imperative that a company remains informed about the status of its suppliers. Therefore, this blueprint will store related its suppliers, such as news and statistics data related to the regions where the suppliers operate.
• Production Context Blueprint – The blueprint will serve to aggregate data related to the production issues of a company, such as, raw material cost data, transportation cost data, news related to production equipment and technologies, etc.
• Workforce Context Blueprint – Lastly, but equally important, the workforce context blueprint will serve to gather data related to workforce data, such as employment-related statistics, as well as, workforce related data on a company gathered from publicly available websites (ie: LinkedIn, Glassdoor, etc.)
The above list of blueprints is meant to provide a common foundation, as with the ever expanding number of data sources, there is also room for further blueprints which may provide different insights into enterprise operations.
The actual definition of the blueprint terms will also depend upon the specific needs of each enterprise. For instance, a company, which is not listed on the stock market, may have less of a need to store and analyze financial data. The beauty of the blueprint concept is that it can serve as a guideline for data integration and provides the flexibility necessary to adapt itself to a wide variety of scenarios.
data modelling of a blueprint using common data modelling tools or even custom tools provided by many database software providers.
4.3. Data Engineering Methodology – Reference Data & Data Dictionaries
Before data to be analyzed can be imported, as previously mentioned, relevant Enterprise blueprints must be defined according to the specific needs of the Enterprise.
However, the blueprints by themselves are just empty data structures, which must then be appropriately populated with relevant data.
In order to assist in the data import process, the methodology makes use of reference data and data dictionaries.
One of the basic tenets of the Semantic Web and, subsequently of Linked Data, is to link data sources to other data sources in order to provide context. By using reference data, this principle is achieved in two ways:
1. In using reference data and reference data sources, one is not “re-inventing the
wheel” by collecting and cleaning data that has already undergone that process. One can simply build upon the work of others and use it as a basis to further advance it.
2. In using reference data sources, the data, which is to be collected and analysed, can in turn be linked to these reference data sources and become of benefit to others.
One such example is Wikidata (formerly Freebase) [22], a collaborative database project which collects structured data and makes it available for use in other data projects. Wikidata contains data regarding a wide range of topics and, in the particular case of Enterprise applications it contains relevant data that can be utilized. For example, a list of company names can be used to identify suppliers and/or competitors of a company. Geographic locations, names of relevant business people, and other related business concepts are just a few of many other examples where a data reference source, such as Wikidata, may be utilized.
However, in some instances, an enterprise may require a more specific set of reference data. For example, many sectors have their specific terminology and jargon, which may not be relevant in other areas of economic activity. For instance, a financial institution may be particularly interested in tracking interest rates and currency rates, whereas an electronics manufacturer may be more interested in following the prices of raw materials. In this particular instance, the development of data dictionaries, or reference ontologies, can be very helpful, as they can provide a set of reference terms upon which the data to be imported and analyzed can be mapped and linked in a proper manner.
The usage of reference data sources in the methodology and framework will be accomplished through the use of Semantic Web technologies and principles. With regards to the implementation of data dictionaries, it can be achieved using an ontology editor (i.e. Protégé) to build a reference ontology, or using another appropriate data modelling tool to implement the data dictionary if they are to be used in the context of a RDBMS.
4.4. Data Engineering Methodology – Data Import Process
The data import process into the framework must take into account several aspects: 1. Data mapping – Concepts related to the data being imported should be properly
mapped into the proper blueprints. These mappings should be stored for future reference.
2. Data cleaning – Upon importing in into a system, data must be free from errors and duplicates as much as possible. The process of eliminating wrong data and duplicate data is referred to as data cleaning or data cleansing.
3. Data source traceability – It is important that data imported into the platform is traced back to its source. This will facilitate future data import from the same data source to the platform, as the data mapping relationships can be utilized to perform future data imports from the same data source.
4. Semantics information – Data being imported into the platform should have semantic tags, which can assist in the data analysis process.
5. Data transformation rules – With certain types of data, such as numeric data, it may be helpful to allow for data transformation rules. For example, the transformation of data that is in different units (i.e. metric to imperial) may be helpful when aggregating data from various sources, as it will simplify analysis and comparison. Also, data transformation rules may be used to map concept relationships.
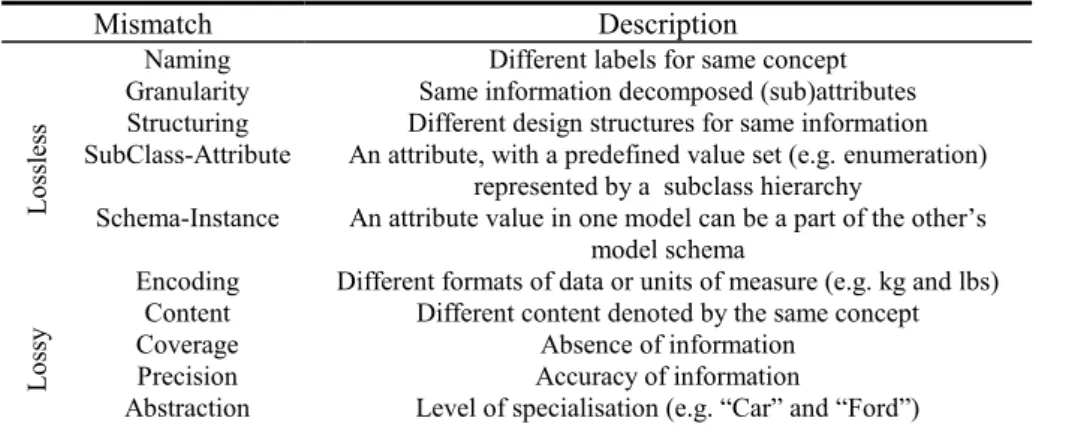
With regards to semantics and data transformation, in [23], the authors propose an approach to dealing with Semantic Mismatches, which are “inconsistencies of information that result from “imperfect” mappings” of data [23]. These mismatches can be grouped into the following [23]:
• Lossless, meaning “the relating element can fully capture the semantics of the
related element”.
• In lossy mismatches, “a semantic preserving mapping to the reference model
cannot be built”.
Table 3 shows the various types of Semantic Mismatches.
Table 3. Semantic Mismatches [23]
Mismatch Description
Lo
ssless
Naming Different labels for same concept Granularity Same information decomposed (sub)attributes Structuring Different design structures for same information SubClass-Attribute An attribute, with a predefined value set (e.g. enumeration)
represented by a subclass hierarchy
Schema-Instance An attribute value in one model can be a part of the other’s model schema
Encoding Different formats of data or units of measure (e.g. kg and lbs)
Lo
ssy
Content Different content denoted by the same concept
Coverage Absence of information
Precision Accuracy of information
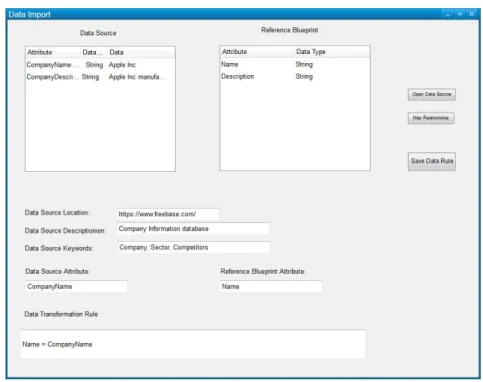
The proposed framework will provide a data import/data mapping, which can address lossless semantic mismatches. A screenshot of a Naming Semantic Mismatch example is shown in Figure 4 below.
In this example, the data source and the reference blueprint use different names for the same concepts. In addition to this, the data source location, description and keywords are also saved, to ensure that future data imports from the same source will be optimized. By saving the mappings of the concepts, the task will not have to be repeated in the future.
The data transformation/data mapping tool can also be utilized to perform more complex data transformation which may involve numerical formulas or the aggregation of various semantic concepts, such as ‘Full Name = First name + Last Name’.
Fig. 4. Naming Semantic Mismatch Example
4.5. Data Analysis
Once all relevant data is imported into the platform, it is necessary to identify which tools are necessary to properly analyze and/or visualize the data.
Given the variety of possible data types, formats and structures, it is therefore necessary to ensure that the framework and methodology provide the adequate tools and means to deal with heterogeneous types of data and data sources.
• Company data - Most relevant company data will revolve around structured data attributes (e.g. name, address, sector of activity, annual sales, etc.) as well as unstructured data. However, since most of this data will be utilized as reference, there is no need for analysis tools on this data.
• Geographic data - The Geographic Data serves to visualize relevant information related to the geographical location of a company and its surrounding environment. It serves therefore mostly as a visualization tool, upon which other relevant data can be layered upon it (e.g.: statistics data related to a specific location, route planning, nearby competitors, etc.). Geographic data will be accessed through a specific API (e.g. Google Maps), which will then provide the required maps for visualization.
• Governmental data - Governmental Data will provide information regarding current activities and events related to the political and regulatory environment in which a company operates. This information could include news and updates regarding governmental affairs, regulations, tax codes, amongst many others. Given that most of this data will be text-based, it is therefore imperative that the framework provide some sort of text analytics capability in order to filter and highlight relevant information.
• Statistics data - The proper usage of existing Statistics Data sources will imply the use of proper tools in order to perform adequate statistical analysis. Although some statistics data may be useful and relevant by itself, one advantage of the proposed framework is to provide a way to correlate statistical data with other types of data in order to obtain further insights.
• Sensor data - Many types of sensor data may analysed as Time-series graphs which are important to follow (i.e. production levels, etc.), however, other types of sensor data may require their integration with other data sources. For example, traffic sensor data may only be relevant if obviously integrated with geographic data. The methodology and the framework shall offer the possibility to integrate sensor data with other data sources as necessary.
• Financial data - Financial Statements alone can be the subject of a wide variety of analysis. However, the lack of proper financial analysis tools prevents the wider dissemination of standard reporting formats, such as XBRL. The framework shall provide at a minimum a way to visualize financial statement data and provide the tools to perform basic financial analysis when such data is available.
Given the SEFRAMECA framework & methodology and the above data types with related functional requirements, it was defined an architecture for its implementation.
4.6. Proposed Framework Architecture
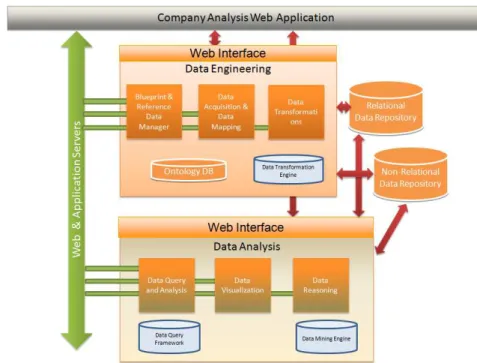
The SEFRAMECA architecture is composed of several data tools and data repositories which, when combined together, provide a sophisticated means for data engineering and data analysis. The proposed conceptual architecture is shown in Figure 5.
The Data Engineering interface is composed of three main components:
1. Blueprint & Reference Data Manager – This component will be responsible for handling the development and management of the reference blueprints, as well as, any other reference data sources, such as data dictionaries, reference taxonomies and ontologies. This component can be implemented with an ontology editor, such as Protégé, or by defining a data structure in OrientDB, using its built-in editor, or a combination of both systems, according to the type of data structure to be defined.
2. Data Acquisition & Data Mapping – This component shall be custom-built, given the specificities that the framework shall implement; however, it will rely upon existing open source technologies, such as, Apache Tika for parsing of files in various formats. The data mapping functionalities shall be implemented via a web interface, and the appropriate mappings stored in an ontology or an OrientDB data structure, as appropriate.
3. Data Transformation – The data transformation component shall also be custom-built, however, it shall depend upon a data transformation engine built using Python and data manipulation libraries provided by the language.
The Data Analysis interface is also composed of three main components:
1. Data Query and Analysis – This component will allow the end-user to query and perform a manual analysis of the data. It shall consist of a user-interface, based on Apache MetaModel, a framework, which allows querying of heterogeneous data sources, including relational and non-relational databases.
2. Data Visualization – The Data Visualization component will permit the analysis of data from a graphical standpoint, as well as, the integration of geographical relevant data with relevant map data. D3.js, a Javascript-based framework, shall be used for data visualization, while Google Maps shall be used to integrate geo-referenced data.
3. Data Reasoning – Lastly, in the cases where advanced analytics capabilities are required, the Data Reasoning component shall provide those functionalities. It will be based on a data-mining engine from open-source tools, such as KNIME or WEKA.
The framework aims to provide innovative features, while trying to not replicate features, which are already available elsewhere. Additionally, although some of the capabilities may be widely available in many other tools (i.e. the existence of a wide variety of analytics tools with data mining capabilities).
Fig. 5. Proposed Framework Conceptual Architecture
5.
Framework Validation
5.1. IMAGINE Partner Search for Dynamic Manufacturing Networks
IMAGINE is an EU-funded R&D project, which seeks to address the need of modern manufacturing enterprises for a novel end-to-end management of Dynamic Manufacturing Networks. With this objective in mind, the project consortium has been
working on the development of “a multi-party collaboration platform for innovative,
responsive manufacturing that encompasses globally distributed partners, suppliers & production facilities (SMEs and/or OEMs) that jointly conduct multi-party manufacturing”, as well as, on a “a novel comprehensive methodology for the management of dynamic manufacturing networks that provides consolidated and coordinated view of information from various manufacturing sources and systems” [24].
quality certifications, production cost, estimated delivery time, amongst other factors. It also assists in finding a set of potential suppliers following a three-step process: (1) first, it begins by creating a Long List of potential suppliers based on criteria such as number of employees, turnover, location, company category and production category; (2) after this initial filtering process is performed, an additional filtering process takes place, as potential suppliers are sorted based on the dynamic criteria such as capacity rate, duration, fixed cost and variable cost, thus creating a Short List of potential suppliers for the manufacturing network.; (3) finally, the platform provides simulation capabilities, through the “DMN Evaluation” component, which simulates possible manufacturing network configurations based on the suppliers choice defined in the Short List.
The envisioned capabilities provided by the “Partner Search” component are a major leap forward in facilitating the supplier search process, as the component not only assists in filtering irrelevant suppliers, but it also provides search and simulation capabilities which were previously unavailable which give added assurance in the final selection of potential suppliers.
In addition to its innovative “Partner Search”, once a DMN is deployed, the IMAGINE platform also provides a comprehensive Network Monitoring & Governance tools, through the inclusion KPI Dashboards which provides up-to-date information to the DMN Manager on the status of all the network partners. If production issues arise with a partner, the IMAGINE platform automatically raises an alert and prompts the DMN Manager with possible alternatives to deal with the issue. By actively monitoring the production activities of all the partners in the network, the IMAGINE platform attempts to minimize potential DMN disruptions and delays, which can cause additional production costs and diminished profits for all the partners involved in the DMN.
5.2. Suggested Improvements to the IMAGINE Platform
The aforementioned capabilities provided by the IMAGINE platform assist in solving some of the current challenges in both supplier search and in the monitoring of DMN execution. The search capabilities of the IMAGINE platform greatly reduce the time required to find a set of suitable suppliers according to the needs and criteria of the manufacturer. Additionally, by proactively monitoring the production activities of each partner involved in the DMN, the IMAGINE platform reduces the risks related to production problems and delays. However, some challenges still remain namely those related to the trustworthiness and reliability of potential suppliers, as most supplier search sites do not provide any sort of information, which can help assess whether any particular supplier will deliver its services or products on time and as specified. There is therefore the need for additional mechanisms, which can fulfil this gap in supplier evaluation, by providing additional information, and insights that can assist manufacturers in choosing the best possible suppliers. Additionally, the tools provided do not provide any capabilities to monitor external issues which may arise that could negatively impact a DMN partner. For instance, an adverse weather event or a shortage in raw materials can disrupt the production activities of a DMN partner, however, the IMAGINE platform does not include the capabilities to monitor these types of events.
production problems with any particular supplier arise, the monitoring components of the IMAGINE platform quickly warn the manufacturer and suggest possible alternatives to the issue at hand. However, well-performing companies who produce and deliver their products on time and according to specified requirements may gain from publicly sharing some of their production data. In particular, new suppliers in a particular market may wish to have greater transparency about their production capabilities in order to provide assurance to potential customers.
Therefore, an improvement to the “Partner Search” component of the IMAGINE
platform, as well as, applicable supplier search tools and sites should be the inclusion of relevant production data, obtained from production monitoring tools, which can help manufacturers and other interested parties in their supplier search process. The inclusion of such data would give an additional guarantee regarding potential suppliers that indeed their production capabilities are in line with the production requirements. Additionally, the inclusion of historical data could add further insights into the reliability of a potential supplier.
Another source of information could be in the form of user feedback, similar to what already takes place in many consumer websites and auction websites. After the successful deployment and execution of a manufacturing network, manufacturers involved in sub-contracting work to suppliers could use the search platform to leave feedback on their experience regarding the suppliers sourced in the manufacturing network. Although this sort of mechanism is not without its drawbacks, if properly supervised to ensure that only legitimate and honest feedback is provided, then it could help other potential users in their future decision-making process regarding their supplier choices.
In terms of Network Monitoring, the various network partners could implement the context-awareness capabilities provided by the SEFRAMECA framework. Each partner could utilize the methodology and tools provide by the framework implementation to monitor their operating environment, from weather at their operating facilities, to monitoring the prices of raw materials, the activities of their competitors, etc. By adding this additional layer of external monitoring, the IMAGINE platform can be enriched and provide even greater added value to its end-users.
5.3. Framework Validation within the Context of the Furniture Living Lab
The Furniture LL has been defined to demonstrate the interactions between the IMAGINE Platform and Legacy Systems through Web Services and Adapters developed ad-hoc. The objective is to pilot an end-to-end management of a DMN created on the basis of an arising business opportunity. This LL is focused on furniture manufacturing processes covering the cycle time from the detection of new business opportunities to the delivery of the produced goods.
conditions to be considered special and to be managed through a DMN in the IMAGINE platform: custom configuration, high volume and tight delivery terms. The objective is the use of the platform in conjunction with the ERP legacy system in order to deal with the special order.
As mentioned previously, the IMAGINE platform provides capabilities to search for new suppliers and simulate the current production processes inside the DMN. This simulation allows a better selection of production partners in order to build a more efficient production network. The platform also provides a system to communicate and exchange data inside the platform with punctual human interaction. The objective is to be able to connect the platform to any ERP system by using Adapters. This allows companies to react to production issues faster and more effectively.
On the other hand, the proposed LL introduces a new approach that it is not very extended in the furniture sector: the collaborative manufacturing approach. Although the proposed Furniture LL is defined initially for companies which are currently managing a small production network in some way, the availability of the IMAGINE platform and its functionality fosters the adoption of this production approach by companies which are not following this at this moment. This new approach is also being in more demand and it facilitates new business opportunity for many SMEs.
5.4. Enterprise Context Analysis Framework Integration in the context of the Furniture Living Lab
The Furniture LL has developed an adapter which facilitates the registration of Furniture Manufacturers in the IMAGINE platform. The adapter, through the use of Web Services, provides mechanisms for easy upload of Partner and Product information.
Given its modular nature, the enterprise context analysis framework (SEFRAMECA) and its supporting databases may be integrated within the existing Furniture LL adapter, as shown in Figure 6, thus providing additional functionalities to the adapter. The use of Portlets as an interface for the enterprise context analysis adapter does not disrupt in any way the other functionalities of the adapter, serving thus as a complement to them.
In order to ease the communication between the adapter and the legacy systems, a web services application has been also developed. This application offers a set of services according to the IMAGINE blueprints data model to retrieve specific information from the ERP of the companies. Currently, the application implements a set of web services to retrieve values from GdP (a specific ERP for the furniture industry supported by AIDIMA) and funStep (ISO 10303-236) [25]. To ease the integration, the architecture of the application offers an additional empty class which can be used to implement the specific queries to retrieve values from any other ERP database. This way, the ERP system and the updates in the implementation of the data retrieval are transparent to the Adapters and the IMAGINE platform.
material components utilized in furniture manufacturing. Additionally, a supplier could also use the framework to collect data related to the furniture offerings and prices practiced by its competitors. Given the dependence of the furniture sector upon other sectors, in particular the construction industry, the framework could assist furniture manufacturers in gathering data related to the construction sector. A slowdown in construction (as it unfortunately happened in many European countries), could signal a decrease in the demand for furniture. By remaining aware of its context and operating environment, a furniture manufacturer could then also prepare for decreased demand by reducing production, reducing its prices or by seeking new markets where to expand.
5.5. Current Results
At this time, selected components of the proposed framework have been implemented in the context of the IMAGINE project. First, the “Blueprint & Reference Data Manager” has been implemented using Protégé, an ontology editor, to develop and manage the reference blueprints. Hence, the “Data Acquisition & Data Mapping” component has been implemented. A data mapping portlet has been developed, handling RDF files. Still, the implementation has been successful and used within the final prototype of the IMAGINE platform.
Fig. 6. Proposed Integration of the Enterprise Context Analysis component in the Furniture Living Lab Adapter [23]
Some preliminary work has been performed on the “Data Transformation” component in terms of performing various data transformation scenarios using the Python language. The user interface for this component is now in finalisation to fully integrate the “Data Acquisition & Data Mapping” component.
6.
Conclusions and Future Work
data sources, which can provide helpful insights towards making more informed judgements about the context in which a company operates. There is a plethora of data sources available, however, there is a need to help make sense of that data. The proposed framework proposes an approach towards a move in that direction.
The proposed framework, like most existing data analytics tools, can be used in a wide variety of scenarios. However, one of its main advantages is the customization capabilities data it offers, through the use of data dictionaries and other reference sources of data. These customization capabilities help make the framework more effective and better able to respond to any particular business needs. Another advantage of the proposed framework is its comprehensive nature, in that it addresses all the phases of data analysis, from its acquisition, through its transformation and analysis. Most existing tools tend to focus mostly on either data acquisition/transformation or data analysis. Lastly, in utilizing the Python language to perform the data transformation, it allows a great level of flexibility in terms of adapting to heterogeneous data formats and data sources.
Although components of the proposed framework have already been implemented in the context of the IMAGINE Furniture LL, such as the “Blueprint & Reference Data Manager” and parts of the “Data Acquisition & Data Mapping” and the “Data Transformation” components. As future work, and also as part of the first author’s PhD thesis, further modules implementation of the proposed software architecture, as well as, its deployment is foreseen. Future improvements to the framework may include the addition of Machine Learning algorithms to assist in the analysis and recommendation process.
Acknowledgement. The authors wish to acknowledge the European Commission for their support in funding this work through Projects IMAGINE: Innovative End-to-end Management of Dynamic Manufacturing Networks (No. 285132), and FITMAN - Future Internet Technologies for MANufacturing industries (No. 604674).
References
1. Preimesberger, C.: Big Data Analytics and Storage: Going nowhere but up in 2014. eWeek (2014). [Online]. Available: http://www.eweek.com/enterprise-apps/big-data-analytics-and-storage-going-nowhere-but-up-in-2014.html (current April 2014)
2. Pwc: Data hunting and gaterhing. Pwc (2014). [Online]. Available : http://www.pwc.com/us/en/industrial-products/next-manufacturing/gathering-big-data.jhtml (current April 2015)
3. Pimlott, D., Bradshaw T.: Bank of England Googles to track latest trends. Financial Times (2011). [Online]. Available: http://www.ft.com/intl/cms/s/0/f9550984-952e-11e0-a648-00144feab49a.html?siteedition=uk#axzz2pzqcJJih (current March 2013).
4. Bollen, J., Mao, H., Zeng, X.J.: Twitter mood predicts the stock market. Journal of Computational Science, 2(1), March 2011, Pages 1-8. (2011)
5. Jordan, J.: Hedge Fund Will Track Twitter to Predict Stock Moves. Bloomberg News (2010). [Online]. Available: http://www.bloomberg.com/news/2010-12-22/hedge-fund-will-track-twitter-to-predict-stockmarket-movements.html. (current March 2013)
7. United Nations: United Nations Global Pulse Project. United Nations (2013). [Online]. Available: http://www.unglobalpulse.org/research. (current March 2013)
8. Tuna, C.: New Ways to Read the Economy. Wall Street Journal (2010). [Online].Available: http://online.wsj.com/news/articles/SB10001424052702303395904575158030776948628 (current March 2013)
9. McKinsey Global Institute: Big data: The next frontier for innovation, competition, and productivity. McKinsey & Co. (2014). [Online]. Available:
http://www.mckinsey.com/insights/business_technology/big_data_the_next_frontier_for_in novation. (current March 2014).
10. Bizer, C., Heath, T., Ayers, D., Raimond, Y.: Interlinking open data on the web. In: Demonstrations Track, 4th European Semantic Web Conference, Innsbruck, Austria. (2007) 11. Berners-Lee, T., Hendler J., Lassila O.: The Semantic Web. Scientific American (2001). 12. Sarraipa, J., Ferro-Beca, M., Lucena, C., Jardim-Goncalves, R.: Knowledge Management
support in Sensing Enterprises Establishment. In: INCOM2014, 19th World Congress The International Federation of Automatic Control, Cape Town, South Africa. (2014)
13. Overseas Development Institute: Context Assessment: SWOT Analysis. Overseas Development Institute (2013). [Online]. Available: http://www.odi.org.uk/publications/5876-swot-analysis-context-mapping (current March 2013)
14. Santucci, G., Martinez, C., Vlad-câlcic, D. : The Sensing Enterprise. (2012).
15. Lazaro, O., Moyano, A., Uriarte, M., Gonzalez, A., Meneu, T., Fernández-Llatas, C., Prieto, G.: Integrated and Personalised Risk Management in the Sensing Enterprise. In: N. Banaitiene (Ed.), Risk Management - Current Issues and Challenges. InTech. (2012)
16. Perera, C., Zaslavsky, A., Christen, P., Georgakopoulos, D.: Context Aware Computing for The Internet of Things: A Survey. Communications Surveys & Tutorials. IEEE. (2014) 17. Oxford Dictionaries: Context - definition. Oxford University Press (2014). [Online]
Available: http://www.oxforddictionaries.com/definition/english/context. (current June 2015)
18. Turnitsa, C., Tolk, A.: Knowledge representation and the dimensions of a multi-model relationship. In: Simulation Conference, WSC 2008, 1148–1156. (2008).
19. Kahn, B. K., Strong, D. M., Wang, R. Y.: Information quality benchmarks: product and service performance. Communincations ACM 45, 4, 184-192. (2002)
20. Bouthillier, F., Shearer, K.: Understanding knowledge management and information management: the need for an empirical perspective. Information Research, 8(1), paper no. 141. (2002)
21. OrientDB: Why OrientDB? OrientDB Technologies (2015). [Online] Available: http://orientdb.com/why-orientdb/ (current Apr 2015)
22. Wikidata: Homepage. Wikidata (2015). [Online] Available: http://www.wikidata.org/ (current Apr 2015)
23. Ferro-Beca, M., Sarraipa, J., Agostinho, C., Jardim-Gonçalves, R.: Tuple-Based Morphisms for E-Procurement Solutions. In: ASME 2011 International Design Engineering Technical Conferences and Computers and Information in Engineering Conference (IDETC/CIE2011), August 28–31, 2011, Washington, DC, USA. (2011).
24. IMAGINE Project: Document of Work. IMAGINE Project Consortium (2014).
![Fig. 1. Semantic Web Layers [12]](https://thumb-eu.123doks.com/thumbv2/123dok_br/16706312.744337/10.892.196.704.210.396/fig-semantic-web-layers.webp)
![Fig. 6. Proposed Integration of the Enterprise Context Analysis component in the Furniture Living Lab Adapter [23]](https://thumb-eu.123doks.com/thumbv2/123dok_br/16706312.744337/26.892.207.714.588.743/proposed-integration-enterprise-context-analysis-component-furniture-adapter.webp)
