COMPACT SMB
CHROMATOGRAPHY FOR
BINARY SEPARATION
RUI CL ´
AUDIO DOS REIS RODRIGUES
Faculdade de Ciˆencias e Tecnologia
Universidade Nova de Lisboa
A thesis submitted for the degree of
Doctor of Philosophy
N◦ de arquivo
Some men see things as they are and ask why, I dream things that never were and ask why not.
Acknowledgements
Finishing a PhD is truly a marathon event, and I would not have been able to complete this journey without the support and encouragement of a countless number of people over the past four years. I must first express my gratitude towards my advisor, Professor Jos´e Paulo Barbosa Mota. His leadership, support, friendship, attention to detail, hard work, scholarship and genius have set an example I hope to match some day.
I would like to acknowledge Funda¸c˜ao para a Ciˆencia e Tecnologia (FCT/MCTES) for the financial aid in the form of a PhD grant, and for my future pos-doctoral position.
I would like to thank Professor M´ario Eus´ebio for his friendship and precious help in the development of the data acquisition and control software.
A special thanks to my colleague Jo˜ao Ara´ujo for his friendship, help and fruitful discussions. To Tiago Canhoto, a very hard-working Mas-ter student with a great sense of humor.
I also thank some of my fellow PhD students: Jo˜ao Fernandes and M´arcio Temtem, for their effort to help whenever they could. Also to Ricardo Silva, a recent colleague but already a friend.
A special word to Isabel Esteves, not only a colleague but a friend, all your help and friendship is rare to found.
I acknowledge the endless help from Da Maria Jos´e Carapinha and
I thank my parents for instilling in me integrity and a willing to always pursue something more. Their endless support, care and friendship is something immeasurable. Because of them i am a better person.
Resumo
Esta tese consiste essencialmente em desenvolvimentos te´oricos e ex-perimentais na ´area dos processos cromatogr´aficos cont´ınuos usando unidades de pequena escala.
O Leito M´ovel Simulado (LMS) ´e a aplica¸c˜ao pr´atica do processo Leito M´ovel Verdadeiro (LMV). O LMS ´e um processo cont´ınuo de separa¸c˜ao cromatogr´afica multicoluna com in´umeras aplica¸c˜oes. Este foi desenvolvido originalmente como a implementa¸c˜ao pr´atica de um sistema de adsor¸c˜ao em contracorrente, mas sem os problemas asso-ciados ao movimento de um leito de part´ıculas (LMV). A opera¸c˜ao em contracorrente maximiza a for¸ca motriz para a transferˆencia de massa, o que aumenta a eficiˆencia com que o adsorvente ´e utilizado, permitindo um aumento consider´avel da productividade do sistema e a redu¸c˜ao do consumo de eluente.
Com a recente expira¸c˜ao do processo UOP, tem-se verificado um crescente interesse no processo LMS, levando ao aparecimento de consider´aveis desenvolvimentos no modo de opera¸c˜ao do processo. Estes novos modos de opera¸c˜ao assentam essencialmente na manip-ula¸c˜ao das vari´aveis de opera¸c˜ao durante o processo. De entre v´arios evidenciam-se a comuta¸c˜ao ass´ıncrona dos portos de entrada e sa´ıda (processoVaricol), a modela¸c˜ao peri´odica dos v´arios caudais (processo
PowerFeed) e a modela¸c˜ao da concentra¸c˜ao da alimenta¸c˜ao (processo
ModiCon). Como consequˆencia do aumento da eficiˆencia do processo, come¸cou-se a analisar a possibilidade de reduzir a escala do LMS e aplic´a-lo em separa¸c˜oes nas ´areas farmacˆeutica, biotecnol´ogica e qu´ımica fina. Actualmente, na ind´ustria farmacˆeutica o LMS ´e con-siderado uma unidade multifuncional que pode ser aplicada em difer-entes passos do ciclo de desenvolvimento de uma nova droga.
O emergir destas novas ´areas de aplica¸c˜ao do LMS impulsionou o de-senvolvimento de novos e mais eficazes esquemas que diferem substan-cialmente do processo convencional, levando a que a tendˆencia geral seja para unidades com poucas colunas, pois utilizam menos quan-tidade de adsorvente, s˜ao mais compactas e econ´omicas. Para al´em disso, a mudan¸ca entre separa¸c˜oes de diferentes misturas processa-se de forma mais simples e r´apida do que no caso de unidades com muitas colunas.
No entanto, esta melhoria no desempenho da separa¸c˜ao ´e normal-mente obtida `a custa de uma complexidade acrescida e de um au-mento da sensibilidade do sistema a incertezas processuais e variabili-dades operat´orias. Esta complexidade acrescida requer a utiliza¸c˜ao de equipamento altamente vers´atil, ferramentas eficientes de optimiza¸c˜ao e procedimentos robustos de controlo autom´atico.
e expedita do estado estacion´ario c´ıclico do LMS sem a necessidade da realiza¸c˜ao de experiˆencias na unidade multicoluna. Este sistema foi validado experimentalmente para uma separa¸c˜ao bin´aria de nu-cle´otidos em fase l´ıquida, tanto para opera¸c˜ao LMS cl´assica como para os diferentes modos de opera¸c˜ao Varicol e PowerFeed. Este provou ser um m´etodo simples, compacto e r´apido de reprodu¸c˜ao do comportamento peri´odico do LMS com um consumo m´ınimo de soluto e solvente. O m´etodo proposto demonstra assim que poder´a ser uma maneira simples e econ´omica de testar experimentalmente as condi¸c˜oes de opera¸c˜ao, de uma dada separa¸c˜ao, para um novo pro-cesso cromatogr´afico multicoluna.
Apesar da configura¸c˜ao LMS com quatro colunas ser a mais utilizada, existem esquemas alternativos que podem ser mais adequados para diversos casos particulares. Um LMS compacto com apenas duas col-unas ´e apresentado. O processo 2-colcol-unas desenvolvido utiliza duas bombas de entrada que fornecem as correntes de alimenta¸c˜ao e sol-vente ao sistema, duas bombas internas de recircula¸c˜ao para manip-ula¸c˜ao do caudal de efluente que ´e direccionado de uma coluna para a seguinte e dez v´alvulas de duas vias para comuta¸c˜ao dos portos. O sistema aplica simultaneamente tanto a manipula¸c˜ao ass´ıncrona dos portos como a modela¸c˜ao peri´odica dos caudais; o sistema 2-colunas proposto foi reproduzido experimentalmente e provou ser um processo mais eficaz que a simples cromatografiabatch ou que o processobatch
com reciclo.
potencialidades do LMS com a simplicidade da cromatografia batch. Adicionalmente, a problem´atica do desenvolvimento de uma unidade experimental para reproduzir estes sistemas compactos ´e abordada. H´a v´arios aspectos a considerar no projecto de um sistema como este. O equipamento que controla a comuta¸c˜ao dos portos (as v´alvulas) tem de ser vers´atil o suficiente para acomodar diversos tipos de con-figura¸c˜oes. Isto implica que o sistema tem de possibilitar a opera¸c˜ao sem algumas das zonas habituais do LMS. Por outro lado, dado que o sistema proposto se baseia numa manipula¸c˜ao dos caudais, para que este funcione na pr´atica, ´e necess´ario adoptar uma configura¸c˜ao de bombas que seja robusta.
Abstract
This thesis consists essentially of theoretical and experimental devel-opments in the field of continuous chromatography using small-scale units.
Continuous chromatographic separation processes based on the Sim-ulated Moving Bed (SMB) technology were first patented and applied in 1961 for a large number of separations in the petrochemical indus-try and later for sugar separation. However, in the last two decades, due to the patent expiration, the process has been gaining great in-terest in the separation/purification of products in fine chemical and pharmaceutical industries.
The conventional SMB comprises several identical columns which are serially connected in either a closed- or open-loop configuration. In order to simulate the movement of a solid bed in opposite direction to the fluid, the positions of the input and output streams are shifted downstream by one column, at fixed intervals, in the direction of fluid flow. With the development of new and efficient equipment and sta-tionary phases, several new schemes of operating that differ from the conventional one have emerged. These include new concepts such as Varicol, ModiCon and PowerFeed processes, which rely on the peri-odic modulation of certain process parameters during the switching interval to enhance the efficiency of the separation. These advances are pushing the trend for units with a small number of columns, since the overall setup is more economical.
operate because it is more demanding on hardware. This additional complexity requires highly versatile SMB equipment, advanced opti-mization tools and robust control procedures.
Experimental tools to experimentally reproduce the periodic state of multicolumn countercurrent chromatography with just one column are developed; they are economic and fast methods of experimentally exploring different column configurations and cyclic operation poli-cies, ideally suited for applied research studies but may also be useful in the early stages of development, optimization, and validation of a new chromatographic separation. The feasibility of the proposed single-column system is experimentally demonstrated for several dif-ferent column configurations, which include both synchronous and asynchronous port switchings and flow modulated schemes.
Following the potentialities of these new operating schemes, a novel SMB system for binary separation that employs only two-columns is developed. The designed two-column process uses both the port switching and the flow rates modulation procedure. The process is very versatile since the cycle itself is optimized and adapted to the difficulty of the separation and process specifications. Furthermore, a simplified extension of the two-column setup which relies on a mini-mum pump number configuration and on a uniform flowrate scheme is built-up; additionally a further development on these simplified setup is applied which effectively enhances the process with only the cost of a small increase on the setup equipment. Potentialities of this new unit are illustrated comparing it to setups using the same amount of stationary phase.
Moreover, in order to describe all the proposed units, a numerical method to directly compute the cyclic steady behavior of the process is developed and used as modeling procedure.
to contamination and/or extra volume issues relatively to large indus-trial setups. The developed system is experimentally applied for the separation of two nucleosides by reversed phase chromatography.
Resumo Alargado
A cromatografia ´e uma t´ecnica de separa¸c˜ao/an´alise muito eficiente. Foi inicialmente usada por qu´ımicos na extrac¸c˜ao/purifica¸c˜ao de mis-turas de tingimentos de origem vegetal, da´ı o seu nome: do grego
escrever cores.
De uma maneira simples, cromatografia ´e um m´etodo de separa¸c˜ao em que uma mistura de solutos ´e elu´ıda atrav´es de uma fase esta-cion´aria (coluna), sendo que cada composto interage com o s´olido. A afinidade que cada soluto tem com a fase estacion´aria ´e diferente, logo as esp´ecies ir˜ao ter diferentes velocidades de migra¸c˜ao, o que faz com que seja poss´ıvel recolher, `a sa´ıda da coluna, cada um em separado.
Numa tentativa de tornar o processo cont´ınuo e consequentemente mais eficiente, desenvolveu-se um processo designado Leito M´ovel Ver-dadeiro (LMV). A ideia ´e simples: em vez de se manter a fase s´olida im´ovel, esta passa a ter um movimento cont´ınuo, contr´ario ao escoa-mento do fluido e com uma velocidade interm´edia em rela¸c˜ao `a de
Sólido Eluente (QE)
Zona III Zona II
Zona I Zona IV
(QI)LMV (QII)LMV (QIII)LMV (QIV)LMV
(QS)
Eluente E
(QI−QIV)LMV
Extracto X
(QI−QII)LMV
Alimentação F
(QIII−QII)LMV
Refinado R
(QIII−QIV)LMV
B A A A
B B
A + B
Alimentação (F), t Extracto (X), t X, t+τ
F, t+τ
E, t+τ
Refinado (R), t Eluente (E), t
R, t+τ
Zona I
Zona II
Zona III
Zona IV
Comutação portos na direcção do caudal do fluido
QII
QIII
QIV
QI
Figura 2: Diagrama esquem´atico do Leito M´ovel Simulado. O movimento cont´ınuo do s´olido ´e simulado atrav´es da comuta¸c˜ao peri´odica das linhas de en-trada e sa´ıda na dire¸c˜ao dos escoamento do fluido. A alimenta¸c˜ao, Eluente, Extracto e Refinado s˜ao representados pelas letras F, E, X, R respectivamente;
Qj ´e o caudal de fluido na zona j (j =I,...,IV) e τ ´e o intervalo de comuta¸c˜ao.
migra¸c˜ao dos dois solutos a separar; o composto que interage mais fortemente com fase (extracto) vai ent˜ao ser arrastado pelo s´olido e o outro (refinado) continua a migrar com o fluido mas a uma velocidade mais baixa. ´E assim poss´ıvel recolher cada composto puro em cada um dos extremos da coluna, possibilitando uma cont´ınua adi¸c˜ao da mistura a separar.
Algumas tentativas de implementar na pr´atica o processo LMV (pro-cesso Hypersorption) foram desenvolvidas, no entanto, este revelou muitos problemas operacionais (atrito das part´ıculas do leito), sendo pouco vi´avel do ponto de vista econ´omico.
contra-corrente, mas sem os problemas associados ao movimento de um leito de part´ıculas. Trata-se essencialmente da discretiza¸c˜ao do LMV em v´arias colunas; quanto maior o n´umero de colunas mais o LMS se aproxima da eficiˆencia do LMV.
No in´ıcio dos anos sessenta a UOP (Universal Oil Products) desen-volveu e pantenteou o processo LMS para a separa¸c˜ao de hidrocar-bonetos na ind´ustria petroqu´ımica e posteriormente para a separa¸c˜ao de a¸c´ucares. O LMS ´e um processo que usa uma s´erie de colunas cromatogr´aficas conectadas circularmente, o movimento cont´ınuo do s´olido ´e simulado atrav´es da comuta¸c˜ao peri´odica dos portos de en-trada (alimenta¸c˜ao e eluente) e de sa´ıda (extracto e refinado) na di-rec¸c˜ao do escoamento do fluido. Esta opera¸c˜ao em contracorrente maximiza a for¸ca motriz para a transferˆencia de massa, o que vai au-mentar a eficiˆencia com que o adsorvente ´e utilizado, permitindo um aumento consider´avel da productividade do sistema e a redu¸c˜ao do consumo de eluente.
Desde o in´ıcio dos anos noventa, desenvolveu-se um crescente interesse `a volta do processo LMS, levando ao aparecimento de consider´aveis de-senvolvimentos no modo de opera¸c˜ao deste processo. Estes novos mo-dos de opera¸c˜ao assentam essencialmente na manipula¸c˜ao das vari´aveis de opera¸c˜ao durante o ciclo do processo. De entre v´arios, destacam-se a comuta¸c˜ao ass´ıncrona dos portos de entrada e sa´ıda (processo
VariCol), a modela¸c˜ao peri´odica dos v´arios caudais (processo Power-Feed) e a modela¸c˜ao da concentra¸c˜ao da alimenta¸c˜ao (processo Mod-iCon). Devido a estes desenvolvimentos, o processo tornou-se mais eficiente, levando `a possibilidade de usar cada vez menores unidades LMS, sendo a tendˆencia geral para unidades com poucas colunas, pois utilizam menos quantidade de fase estacion´aria, s˜ao mais compactas e econ´omicas.
F
E X
R
UV
X
R F
E
Coluna 1
Coluna 2
Bomba de recirculação #1
Bomba de recirculação #2
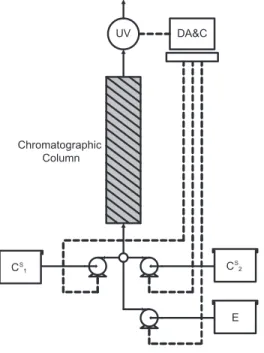
Figura 3: Diagrama esquem´atico da unidade LMS de apenas duas colunas.
requer a utiliza¸c˜ao de equipamento altamente vers´atil, ferramentas de optimiza¸c˜ao avan¸cadas, e procedimentos robustos de controlo au-tom´atico.
Com o objectivo de criar uma ferramenta pr´atica de desenvolvimento processual, um processo monocoluna que se baseia na reprodu¸c˜ao do estado estacion´ario c´ıclico do LMS foi desenvolvido. A principal fun¸c˜ao deste esquema n˜ao ´e a separa¸c˜ao de uma mistura mas sim a re-produ¸c˜ao r´apida e expedita do estado estacion´ario c´ıclico do LMS sem a necessidade da realiza¸c˜ao de experiˆencias na unidade multicoluna.
Apesar do LMS cl´assico necessitar de no m´ınimo quatro colunas, atrav´es da manipula¸c˜ao dos portos torna-se possivel operar com menos colunas. Um sistema LMS compacto com apenas duas colunas ´e ap-resentado.
A problem´atica do desenvolvimento de uma unidade experimental para reproduzir sistemas compactos ´e abordada. H´a v´arios aspec-tos a considerar no design de um sistema como este. Por um lado, o equipamento que controla a comuta¸c˜ao dos portos (as v´alvulas) tem de ser vers´atil o suficiente para acomodar os diversos tipos de con-figura¸c˜oes poss´ıveis. Por outro lado, devido `a modela¸c˜ao dos caudais, a configura¸c˜ao das bombas tem que ser suficientemente robusta. Na unidade desenvolvida optou-se por uma configura¸c˜ao de v´alvulas dis-tribu´ıdas, baseada em v´alvulas on-off, e por um conjunto de bombas de deslocamento positivo (duplo-pist˜ao). Uma fotografia da unidade experimental pode ser vista na Figura 4.
Um processo LMS que usa apenas 2-colunas para separa¸c˜ao bin´aria foi desenvolvido. Este utiliza duas bombas de entrada para fornecer
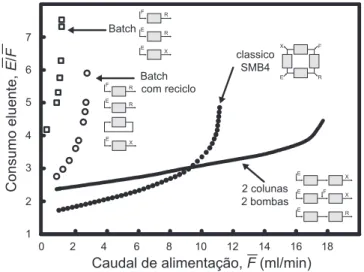
menta¸c˜ao e solvente ao sistema, duas bombas internas de recircula¸c˜ao para manipula¸c˜ao do caudal de efluente que ´e direccionado de uma coluna para a seguinte e dez v´alvulas de para manipula¸c˜ao dos por-tos (ver Figura 3). O sistema aplica simultˆaneamente a modela¸c˜ao peri´odica dos portos e dos caudais; o processo foi reproduzido exper-imentalmente e provou ser bastante eficiente quando comparado com cromatografia batch ou batch com reciclo. Este facto demonstra que o processo poder´a ser uma alternativa vi´avel ao n´ıvel de ind´ustrias de produtos de alto valor acrescentado, nomeadamente farmacˆeutica e biotecnol´ogica.
Apesar das potecialidades deste novo processo, este continua a apre-sentar alguma complexidade quando comparado com processos cro-matogr´aficos monocoluna. De forma a simplificar o processo, um novo ciclo foi desenvolvido. Este novo ciclo assenta num esquema de loop-aberto ao mesmo tempo que mantem os caudais o mais uni-forme possivel; assim, como n˜ao existe recolha parcial da corrente de produto, as duas bombas de recircula¸c˜ao podem ser retiradas do processo, fazendo com que se torne numa unidade mais econ´omica e simples de operar. O diagrama de um ciclo de opera¸c˜ao do processo est´a representado na Figura 5.
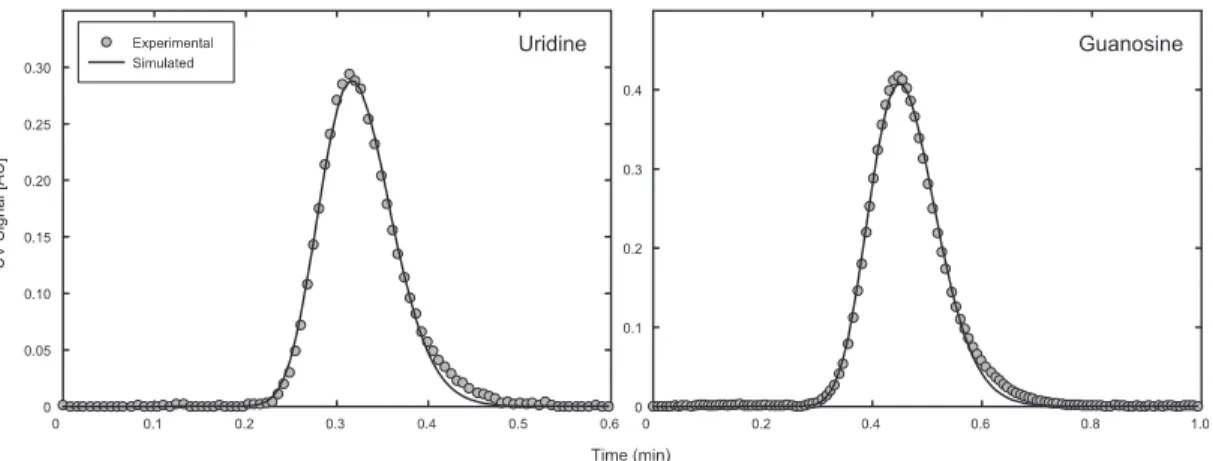
Este esquema foi testado experimentalmente para a separa¸c˜ao bin´aria dos nucleos´ıdios uridina e guanosina em cromatografia de fase reversa. A concordˆacia entre resultados experimentais e design te´orico foi to-tal. O processo demontra assim ser uma mais valia do ponto de vista operacional pois apresenta uma simplicidade idˆentica ao de um pro-cesso monocoluna mas aplica as caracter´ısticas de um propro-cesso cro-matogr´afico contracorrente, resultando num esquema simples mas de alta performance.
E
P
P E
τ1
τ2
τ3
E
P
P E
F E
P
intervalo comutação 1 , τ
Um ciclo completo ,Nτ
intervalo comutação 2 , τ
E F
P
Figura 5: Diagrama esquem´atico do ciclo completo do processo simplificado LMS de duas colunas. Cada intervalo de comuta¸c˜ao est´a dividido em 3 passos de dura¸c˜ao vari´avel que representam dois passos de elui¸c˜ao e um de alimenta¸c˜ao. No segundo intervalo de comuta¸c˜ao, o esquema repete-se mas com uma coluna de desfasamento (como no LMS cl´assico). De notar que P representa a sa´ıda de produto que pode representar tanto o extracto como o refinado.
unidade necessita de uma terceira bomba (para efectuar o reciclo), pelo que esta op¸c˜ao dever´a ser´a mais vi´avel no caso de separa¸c˜oes que apresentem baixa selectividade.
Finalmente, o problema de robustez da opera¸c˜ao LMS ´e abordado. Um procedimento geral para o design e optimiza¸c˜ao robusta na pre-sen¸ca de incerteza ou variabilidade nos caudais e nos parˆametros da isot´ermica ´e proposto. Estes tipos de incerteza s˜ao dos mais dif´ıceis de resolver do ponto de vista operacional e dos que ocorrem com mais frequˆencia `a escala industrial. A opera¸c˜ao robusta ´e particularmente relevante nestes novos processos, pois estes proporcionam melhorias no desempenho da unidade mas ´a custa do aumento da complexidade operacional, tornando-se num process mais sensivel a perturba¸c˜oes.
Batch
Batch
2 colunas 2 bombas
E X E F X E R R E R F E X E R R F E X Consumo eluente, E / F
Caudal de alimentação, F (ml/min)
0 2 4 6 8 10 12 14 16 18
1 2 3 4 5 6 7 X E F R classico SMB4 com reciclo
Figura 6: Curvas de opera¸c˜ao ´optima para o processo LMS com 2 colunas para a separa¸c˜ao bin´aria de dois nucleos´ıdeos. Compara¸c˜ao entre este e os processos batch, batch com reciclo e o LMS cl´assico de 4 colunas. Para todos os processos a quantidade de fase estacion´aria ´e mantida constante.
processo mant´em os n´ıveis m´ınimos de pureza.
Foram reproduzidas um conjunto de trˆes experiˆencias de optimiza¸c˜oes robustas para o processo descrito na Figura 5. Em duas delas foram infligidas perturba¸c˜oes, nos caudais e nos parˆametros da isot´ermica. No entanto, o processo conseguiu manter n´ıveis de pureza dentro de valores admissiveis.
Contents
Nomenclature xxxiv
1 Introduction 1
1.1 Relevance and Motivation . . . 1 1.2 Objectives and Thesis Structure . . . 2
2 Chromatographic Separation 5
2.1 History and development . . . 5 2.2 Elution batch Chromatography . . . 6 2.3 Theory of Linear Chromatography . . . 7 2.3.1 The Plate Theory . . . 10 2.3.2 The Stochastic Theory . . . 12 2.3.3 The Solid-Diffusion Model . . . 13 2.4 Batch Chromatography with Recycle Closed-loop . . . 16 2.5 Simulated Moving Bed Chromatography . . . 17 2.6 Unconventional Simulated Moving Bed . . . 22 2.6.1 The VARICOL process . . . 22 2.6.2 The PowerFeed process . . . 25 2.6.3 Other nonclassical modes to operate an SMB . . . 26 References . . . 40
3 Simulated Moving Bed Modeling 41
CONTENTS
References . . . 54
4 Single-column analog to SMB 55
4.1 Brief introduction . . . 55 4.2 Single-column Setup . . . 56 4.2.1 Model-based Startup Procedure . . . 61 4.2.2 Data Sampling and Filtering . . . 64 4.3 Experimental . . . 65 4.3.1 Online Monitoring . . . 67 4.3.2 Chromatographic Model . . . 69 4.3.3 Materials and System Characterization . . . 70 4.4 Results and Discussion . . . 73 4.5 Summary . . . 82 References . . . 86
5 Experimental Setup of a Compact and Flexible SMB Unit 87
5.1 Compact SMB unit design . . . 88 5.2 Instrumentation . . . 94 5.2.1 Pumps . . . 94 5.2.2 Columns . . . 98 5.2.3 Two-way valves and UV Detector . . . 99 5.2.4 Temperature Control . . . 103 5.2.5 Other equipment . . . 107 5.3 Data control and acquisition software . . . 108 References . . . 110
6 Two-Column Simulated Moving-Bed Processes for Binary
Sep-aration 111
CONTENTS
6.7 Discussion . . . 123 6.8 Summary . . . 131 References . . . 134
7 Two-Column SMB - making the process simpler and more
ef-ficient 135
7.1 Brief introduction . . . 135 7.2 Simplified two-column process . . . 136 7.2.1 Cycle design . . . 137 7.2.2 Process definition . . . 139 7.2.3 Experimental validation . . . 142 7.3 Enhancing the process . . . 145 7.3.1 Experimental validation . . . 145 7.4 Discussion . . . 146 7.5 Summary . . . 154 References . . . 155
8 Robust Design of an SMB process 156
8.1 Brief introduction . . . 156 8.2 Robust process design . . . 157 8.2.1 Worst-Case method . . . 159 8.3 Experimental validation . . . 160 8.4 Discussion . . . 165 8.5 Summary . . . 168 References . . . 170
9 Conclusions and Future Work 171
List of Figures
Figure 1 Diagrama esquem´atico do processo Leito M´ovel Verdadeiro. xiii Figure 2 Diagrama esquem´atico do Leito M´ovel Simulado. . . xiv Figure 3 Diagrama esquem´atico da unidade LMS de apenas duas
col-unas. . . xvi Figure 4 Fotografia da unidade experimental. . . xvii Figure 5 Diagrama esquem´atico do ciclo completo do processo
sim-plificado LMS de duas colunas. . . xix Figure 6 Curvas de opera¸c˜ao ´optima para o processo LMS com 2
col-unas para a separa¸c˜ao bin´aria de dois nucleos´ıdeos. Compara¸c˜ao entre este e os processos batch, batch com reciclo e o LMS cl´assico de 4 colunas. . . xx Figure 2.1 Elution Batch chromatography. . . 6 Figure 2.2 Example of a type I adsorption isotherm. . . 8 Figure 2.3 Flowchart of the several mathematical approaches to model
LIST OF FIGURES
Figure 2.13 Chronograms of port switch over a complete cycle for the SMB and the VARICOL processes. . . 25 Figure 2.14 Simplified scheme of the PowerFeed process. . . 26 Figure 2.15 Simplified scheme of the ModiCon process. . . 27 Figure 2.16 Schematic diagram of a two- and three-zone SMB process. . 28 Figure 2.17 Schematic of a single-column with recycle lag analogous to
an 4 zone SMB process. . . 30 Figure 2.18 JO Chromatographic Separation System. . . 31 Figure 2.19 A schematic diagram of the Multi-Column Solvent Gradient
Process. . . 32 Figure 3.1 Schematic flowchart of the different approaches to model an
SMB process. . . 41 Figure 3.2 Schematic representation of a generic node . . . 43 Figure 3.3 Regions of complete separation and regeneration for a linear
adsorption isotherm obtained from the triangle theory. . . 48 Figure 3.4 Behavior of the region of complete separation in the case
of a nonlinear adsorption isotherm obtained from the triangle theory with increasing feed concentration. . . 49 Figure 3.5 Block diagram of the node balance for the two ideal
single-column chromatographic models analogous to an SMB process. 50 Figure 3.6 Schematic of an operating cycle for a classical SMB with the
port configuration 1/1/1/1, and its single-column analogue with recycle lag or lead. . . 52 Figure 4.1 Schematic diagram showing the sequence of port switching
for two cycles of a four-column SMB and the analogous single-column process. . . 58 Figure 4.2 Schematic diagram of experimental setup. . . 59 Figure 4.3 CSS axial concentration profiles in liquid phase at the
be-ginning of each switching interval. . . 63 Figure 4.4 Schematic diagram of moving-polynomial fit to generate a
LIST OF FIGURES
Figure 4.5 Chemical structure of the nucleosides uridine and guanosine 66 Figure 4.6 UV spectra of uridine and guanosine. . . 67 Figure 4.7 Van Deemter plots . . . 70 Figure 4.8 Experimental chromatograms and fitted lines of a pulse of
uridine and guanosine. . . 71 Figure 4.9 Snapshot of the monitoring window of the process
automa-tion system. . . 72 Figure 4.10 Chronograms of port switching for the four asynchronous
configurations listed in Table 4.5. . . 76 Figure 4.11 Temporal profiles of outlet effluent composition for the six
optimized runs . . . 78 Figure 4.12 Pareto optimal solutions for the various SMB schemes
ana-lyzed . . . 80 Figure 5.1 Column setup disposition. . . 88 Figure 5.2 Schematic of the different node designs. . . 90 Figure 5.3 ISEP valve example [1]. . . 91 Figure 5.4 Diagram of process piping and instrumentation. . . 92 Figure 5.5 Various possible schematic diagrams of the two-column SMB
unit. . . 93 Figure 5.6 Picture of the built-up experimental unit. . . 94 Figure 5.7 Flowchart representing the different types of pumps. . . 95 Figure 5.8 Positive displacement pump operation principle. . . 96 Figure 5.9 Picture of the used HPLC pump. . . 97 Figure 5.10 Picture and schematic diagram of a chromatography columns. 98 Figure 5.11 Two-way valves schemes. . . 100 Figure 5.12 USB4000 spectrometer. . . 101 Figure 5.13 Wiring of the spectrometer, valve and pump system. . . 102 Figure 5.14 Temperature control scheme for the columns. . . 103 Figure 5.15 Air temperature control decision flowchart. . . 105 Figure 5.16 Electrical scheme of the air temperature control. . . 106 Figure 5.17 Snapshots of the monitoring window of the process
LIST OF FIGURES
Figure 5.18 Data control & acquisition software flowchart. . . 110 Figure 6.1 Flow diagram of the different types of port configuration. . 112 Figure 6.2 Schematic diagram and main governing equations of
single-column model. . . 115 Figure 6.3 Optimization procedure flowchart. . . 117 Figure 6.4 Solute concentration profiles at the outlet of column 1 for the
optimized scheme listed in Table6.2before dead-volume correction.121 Figure 6.5 Solute concentration profiles at the outlet of column 1 for
the chromatographic parameters given in Table 6.3 in run 1. . . 123 Figure 6.6 Solute concentration profiles at the outlet of column 1 for
the chromatographic parameters given in Table 6.3 for run 2. . . 124 Figure 6.7 Positioning of the inlet/outlet ports, internal concentration
profiles, and flow rates, over the first step of the cycle for the optimized scheme listed in Table 6.3. . . 125 Figure 6.8 Optimal operating curves of the two-columns SMB process. 126 Figure 6.9 Comparison of the two-column SMB process with
conven-tional single-column batch chromatography. . . 128 Figure 7.1 Flow diagram of the allowed port configuration for the
sim-plified two-column SMB unit. . . 137 Figure 7.2 Simplified two-column SMB process cycle. . . 140 Figure 7.3 Solute concentration profiles at the outlet of column 1 for
the chromatographic parameters given in Table 7.1. . . 143 Figure 7.4 Schematic diagram of the simplified two-column SMB
pro-cess with recycle step. . . 144 Figure 7.5 Solute concentration profiles at the outlet of column 1 for
the chromatographic parameters given in Table 7.2. . . 147 Figure 7.6 Axial concentration profiles at CSS and inlet/outlet lines
po-sitions over one switching interval for the simplified two-column scheme listed in Table 7.1. . . 148 Figure 7.7 Axial concentration profiles at CSS and inlet/outlet lines
LIST OF FIGURES
Figure 7.8 Optimal operating curves of the simplified two-column SMB process for our separation test case. Comparison between the constant and nonuniform eluent flowrate option. . . 151 Figure 7.9 Optimal operating curves of the simplified two-column SMB
process for our separation test case. Comparison between the simplified two-column, batch, batch with recycle and the classical 4-column SMB processes. . . 152 Figure 7.10 Optimal operating curves of the simplified two-column SMB
process with and without recycle step for our separation test case.153 Figure 8.1 Decision flowchart for the worst-case disturbances. . . 159 Figure 8.2 Solute concentration profiles at the outlet of column 1 for
the parameters given in Table 8.1 during the 9th process cycle. . 162 Figure 8.3 Solute concentration profiles at the outlet of column 1 for the
List of Tables
Table 4.1 Outline of the nonlinear optimization problem. . . 57 Table 4.2 Characteristics of the stationary phase SourceTM 30RPC. . . 66
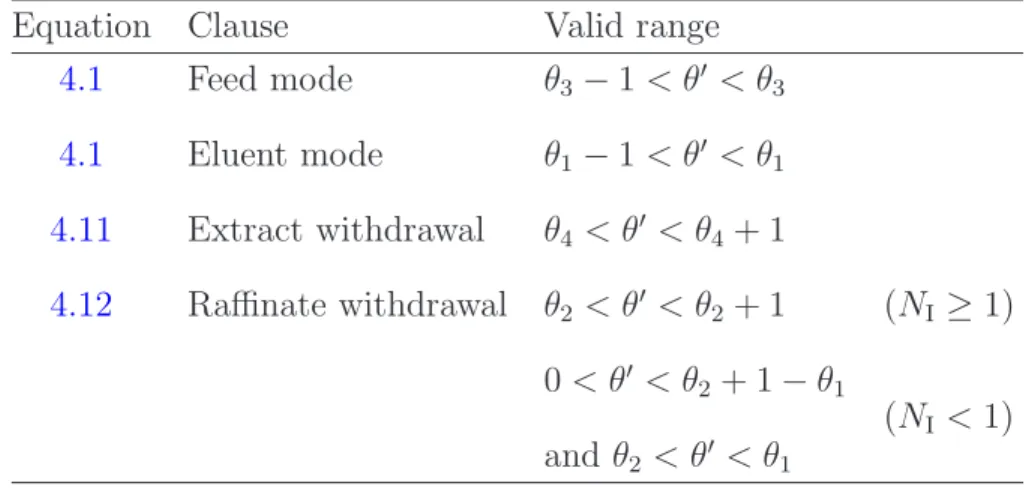
Table 4.3 Column characterization and adsorption parameters. . . 71 Table 4.4 Intervals during which the clauses in Eq. 4.1–4.12 are valid. 74 Table 4.5 Optimized operating parameters for the six processes which
have been reproduced experimentally . . . 75 Table 5.1 Technical data of the Knauer pump K-501. . . 96 Table 5.2 Chromatographic columns technical data sheet. . . 99 Table 5.3 UV detector USB4000/2000 specifications. . . 101 Table 5.4 Specifications of the equipment for the columns bed
temper-ature control. . . 104 Table 5.5 Air temperature control equipment specifications. . . 107 Table 5.6 Capillaries and fittings specifications. . . 108 Table 5.7 Hardware equipment specifications. . . 108 Table 6.1 Column dimensions and packing characterization based on
the analysis of blue-dextran chromatograms. . . 118 Table 6.2 Adsorption parameters for the serial arrangement of the two
columns. . . 120 Table 6.3 Readjusted values of chromatographic parameters and
corre-sponding optimal operating cycle. . . 122 Table 7.1 Adsorption parameters and cycle parameters for the
simpli-fied two-column process. . . 142 Table 7.2 Adsorption parameters and cycle parameters for the
LIST OF TABLES
Table 8.1 Adsorption parameters and cycle parameters for the robust solution of the simplified two-column process withδk =δj = 1%. 161
Table 8.2 Cycle parameters for the robust solution of the simplified two-column process with δk= 1% and δj = 0. . . 163
Nomenclature
Roman Symbols
ap surface of the adsorbent particles (cm2)
DL lumped axial dispersion coefficient (cm2/min)
h dimensionless plate height
k LDF mass transfer coefficient (min−1)
P e P´eclet number
q solute concentration in the adsorbed phase (g/l)
x dimensionless axial position, z/L
z axial position in column (cm)
A column cross-section area (cm2)
c solute concentration in the liquid phase (g/l)
cF Feed concentration (g/l)
E Eluent
F Feed
fobj Objective function
G guanosine
K Henry constant
NOMENCLATURE
m flowrate ratios
N number of columns
Np number of chromatographic plates
nQ number of piecewise constant subintervals of the SMB cycle
P Purity
Q flowrate (ml/min)
R Raffinate
t time coordinate (min)
U uridine
V column volume (cm3)
X Extract
Greek Symbols
υ interstitial velocity of the mobile phase (cm/min)
β phase ratio, (1−ǫ)/ǫ
δ relative deviation
ǫ interparticle porosity
ǫp particle porosity
λ wavelength (nm)
ρ density (g/cm3)
θ dimensionless time, t/τ
NOMENCLATURE
ǫ∗ overall porosity, ǫ∗ =ǫ+ǫ
p(1−ǫ)
Subscripts and superscripts
* value for equilibrium
exp experimental value
I, . . . ,IV SMB zones, I, . . . ,IV
i solute index
in column inlet
j column index
max maximum admissible value
min minimal admissible value
out column outlet
sim simulated value
Acronyms
CSS Cyclic Steady State
HETP height equivalent to a theoretical plate
MCSGP Multi-column Solvent Gradient Process
NLP Non-linear programm
NPLC Normal phase liquid chromatography
RPLC Reversed phase liquid chromatography
SEC Size exclusion chromatography
NOMENCLATURE
SMBR Simulated Moving Bed Reaction Process
SMB Simulated Moving Bed
1
Introduction
1.1
Relevance and Motivation
Chromatographic processes for separation at preparative and production scales have experienced a great deal of development over the last decades. An efficient way to implement countercurrent chromatography in a continuous mode was de-veloped in the early 1960s as a process called simulated moving bed (SMB). It consists of an extremely ingenious way of simulating the countercurrent move-ment of the solid and the liquid phase by means of a periodic movemove-ment of the inlet and outlet lines. This process presents the big advantages of providing good separation even when the resolution is low, and at the same time increasing the productivity and reducing solvent consumption relatively to conventional batch chromatography.
1.2 Objectives and Thesis Structure
as enantiomeric separation and bio-separations. Following this increasing inter-est, several recent developments have emerged through the variation of selected control parameters during the operation of the cycle, leading to an improvement of the setup efficiency and consequentially to SMB units with smaller number of columns and more economical systems.
These smaller units provide further gains, but usually at the expense of addi-tional complexity. This addiaddi-tional complexity requires the development of highly versatile SMB equipment, advanced optimization tools, and robust control pro-cedures.
Although the SMB process increases throughput, purity and yield relative to batch chromatography, the batch process still presents the obvious advantages of being easy to operate, requiring a low capital investment, and being easily prone to the application of solvent gradients or center-cut separations. Those facts present challenges to anyone who is developing simple chromatographic processes with the enhanced properties of simulated countercurrent behavior, but still maintaining the simplicity of the batch system.
1.2
Objectives and Thesis Structure
The main objective of this work is to develop and experimentally validate compact SMB units with only two columns, which incorporate the simplicity and versatility of bath chromatography and the countercurrent behavior of the continuous SMB process.
Furthermore, a robust strategy under uncertainty, based on a worst-case ap-proach, for process design was developed as well as a broad class of numerical and experimental tools for optimization and validation of new chromatographic processes and separations.
1.2 Objectives and Thesis Structure
the SMB modeling strategies and all the possible different approaches. Part of this chapter is based on the following published papers:
• J.M.M. Ara´ujo, R.C.R. Rodrigues, J.P.B. Mota, Use of Single-Column Mod-els for Efficient Computation of the Periodic State of a Simulated Moving-Bed Process, Ind. Eng. Chem. Res. 45 (2006) 5314-5325;
• J.M.M. Ara´ujo, R.C.R. Rodrigues, J.P.B. Mota, Optimal Design and Op-eration of a Certain Class of Asynchronous Simulated Moving Bed Process, J. Chromatography A 1132 (2006) 76-89.
In chapter 4 a novel single-column setup for experimentally reproducing the steady periodic behavior of simulated countercurrent multicolumn chromatogra-phy is presented. This chapter describes the work published in two recent papers:
• R.C.R. Rodrigues, J.M.M. Ara´ujo, M.F.J. Eus´ebio, J.P.B. Mota, Experi-mental Assessment of Simulated Moving Bed and Varicol Processes Using a Single-Column Setup, J. Chromatography A 1142 (2007) 69-80;
• R.C.R. Rodrigues, J.M.M. Ara´ujo, J.P.B. Mota, Optimal Design and Ex-perimental Validation of Synchronous, Asynchronous and Flow-modulated, Simulated Moving-Bed Processes using a Single-column Setup, J. Chro-matography A 1162 (2007) 14-23.
Chapter 5 describes extensively the developed experimental unit for chromato-graphic separation, which can operate with up to three chromatochromato-graphic columns. The report is done from the process engineering point of view. It focus on the issues that must be dealt with when creating a versatile and compact small-scale system.
1.2 Objectives and Thesis Structure
• R.C.R. Rodrigues, T.J.S.B. Canhoto, J.M.M. Ara´ujo, J.P.B. Mota, Two-column simulated moving-bed process for binary separation, J. Chromatog-raphy A 1180 (2008) 42-52.
Chapter 7 reports some further developments to simplify the previously de-veloped column SMB process. These developments create a simplified two-column scheme which couples the advantages of the simple batch chromatography process and still maintains the high performance behavior of the countercurrent SMB system.
In chapter 8, a general procedure for robust design of SMB processes under flowrate, packing, and isotherm uncertainty is presented. The approach relies on a worst-case scenario to create an enlarged optimization solution which fulfils the purity requirements for all considered possible perturbation. This chapter can be viewed as an extension of the work published in:
• J.P.B. Mota, J.M.M. Ara´ujo, R.C.R. Rodrigues, Optimal design of simu-lated moving-bed processes under flow rate uncertainty, AIChE Journal 53 (2007) 2630-2642.
2
Chromatographic Separation
2.1
History and development
Chromatography is a very effective separation and/or analysis technique. It was first used by chemists for the extraction/purification of dye mixtures by dipping strings or pieces of cloth or filter paper into a dye vessel. The dye solution migrated up the inserted material by capillary action, and the dye components produced bands of different colour.
However, the discovery of chromatography is generally attributed to the rus-sian botanist Mikhail S. Tsvet who, in the first decade of the 20th century, was the first to recognize the physicochemical basis of the separation and applied it in a rational and organized way to the separation of plant pigments. Basically, what he did was to pack a vertical glass column with an adsorptive material, such as alumina or silica, add a solution of plant pigments to the top of the column and wash the pigments through the column with an organic solvent. The result was a series of separated colour bands on the column, divided by regions entirely free of pigments.
2.2 Elution batch Chromatography
Later on, chromatography began to take its modern form in the 1940s and 1950s. The principles and basic techniques of partition chromatography appeared from the work of Archer Martin and Richard Synge and lead to the rapid de-velopment of several lines of chromatography methods: paper chromatography, gas-solid and gas-liquid chromatography and several techniques of column liquid chromatography. Subsequent advances continually improved the performance of chromatography, allowing the separation and/or purification of an extensive va-riety of molecules.
2.2
Elution batch Chromatography
Modern, conventional liquid or elution batch chromatography consists of a cylin-drical column packed with a porous media, usually called stationary phase, which is subjected to a pulse injection of a mixture followed by a continuous flow of fluid phase (mobile phase). Each of the species present in the mixture (analytes) may interact with the stationary phase, the stronger they interact with the porous media the slower they will elute along the column. Therefore, each species will have a concentration band profile of distinct velocity along the column making it possible, with a long enough column, to collect at the output pure fractions
Column Inlet Column outlet
Time, t0 + t
more retained analyte
C O L U M N
less retained analyte
Pulse Injection t0
A + B
A B
2.3 Theory of Linear Chromatography
of each component at different elution times. When all species have eluted from the column a fresh injection of mixture takes place and a new separation cycle is initiated. A simplified scheme of the elution batch chromatography process for a binary mixture can be viewed in Figure 2.1.
It is worth mentioning that because this is a discontinuous process where each product is collected at different times, one cannot continuously feed the column.
2.3
Theory of Linear Chromatography
Generalizing, liquid chromatography is, in essence, a batch process that uses one or more columns (operating in parallel) that provide a semi-continuous flow of products. Each analyte flows axially along the column and interacts with the stationary phase in different ways. Based on the way the species interacts with the solid phase, one can divide column chromatography into five major subclasses:
• Affinity chromatography, where selective non-covalent interactions occur between each analyte and specific molecules present in the porous medium. It is very specific and often used in biochemistry for the purification of proteins.
• Ion exchange chromatography utilizes an ion exchange mechanism to sepa-rate analytes. It uses a charged stationary phase to sepasepa-rate charged com-pounds. In conventional methods the stationary phase is an ion exchange resin that carries charged functional groups which interact with oppositely charged groups of the compound to be retained.
• Size exclusion chromatography (SEC) separates molecules according to their size (or more accurately according to their hydrodynamic diameter or hy-drodynamic volume). Smaller molecules are able to enter the pores of the media and, therefore, take longer to elute, whereas larger molecules are excluded from the pores and elute faster.
2.3 Theory of Linear Chromatography
• Reversed phase liquid chromatography (RPLC), in contrast with NPLC the stationary phase is less polar than the mobile phase and the elution of substances from the column is in the order of increasing polarity. Ironically the “normal phase” has fewer applications and RPLC is therefore used considerably more.
The adsorption equilibrium behavior that occurs between the liquid solute and the surface of the solid is usually described mathematically by an equilibrium isotherm, which describes the concentration of adsorbate in the adsorbent as a function of its concentration in the bulk solution at constant temperature. There is no single characteristic shape for an isotherm. Brunauer et al. classified it into five different classes: type I,. . .,V [1]. A typical type I isotherm is represented in Fig. 2.2.
For sufficient low concentrations the equilibrium relationship between the two phases has a linear behavior. This linear relation is commonly referred to as the
linear region
nonlinear region Type I isotherm
concentration in the liquid phase
concentration in the solid phase
2.3 Theory of Linear Chromatography
Henry’s law:
q=K c (2.1)
where q and c are the concentrations in the adsorbed and fluid phases, andK is called the Henry constant.
Linear and nonlinear chromatography have experienced an enormous progress over the last 50 years, mainly because of the evolution of computers making it possible to easily solve the inherent complex numerical calculations typical of a chromatographic model [2].
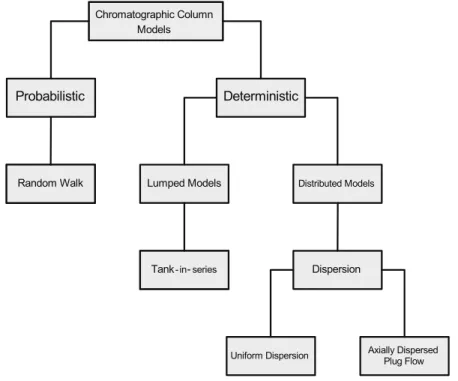
The modeling of chromatography, and the linear case in particular, developed mainly along three different classes of models that describe and predict elution profiles (see Fig. 2.3):
• “Tank in series” model, also known as plate model (lumped models).
Chromatographic Column Models
Probabilistic Deterministic
Random Walk Lumped Models Distributed Models
Tank- in-series Dispersion
Uniform Dispersion Axially Dispersed Plug Flow
2.3 Theory of Linear Chromatography
• Probabilistic models.
• Systems of differential equations that describe the mass balance and the mass transfer kinetics (distributed models).
2.3.1
The Plate Theory
The plate theory of chromatography was introduced by Martin and Synge in 1941 and later by Craig offering the first description of the development of quasi-Gaussian bands in linear elution chromatography. It states that a column can be represented by a series of well-mixed stirred tanks or equilibrium stages, and the mobile phase percolates from one tank to the next after equilibrium is achieved between the mobile and the stationary phases. It was an attempt to work out in detail the theory of chromatography using the previously known concepts devel-oped in distillation and extraction.
This theory assumes that the solute, during its passage through the column, is always in equilibrium with the mobile and stationary phases. However, equi-librium between the phases never actually occurs, consequently to deal with this non-equilibrium condition, the column is considered to be divided into a finite number of plates. Each plate is allotted a specific length and, thus, the solute
Theorical Plate
Column
2.3 Theory of Linear Chromatography
will spend a finite time in each plate. Hence, the smaller the plate, the faster the equilibrium is obtained and the more plates there will be in the column. Conse-quently, the number of theoretical plates contained in a column will be directly related to the equilibrium rate and, for this reason, has been termed the column efficiency. If we consider the column lengthLand the total number of theoretical plates Np, then the Height Equivalent to a Theoretical Plate (HETP) is:
HET P = L
Np
(2.2)
This division of the column into a series of plates can be empirically corre-lated, after the facts, with the column parameters, however the model completely neglects mixing mechanisms, have no predictive value and do not allow a reliable theory of linear chromatography.
A more realistic description of the processes at work inside a column takes into account the time taken for the solute to equilibrate between the stationary and mobile phase (unlike the plate model). The resulting band shape of a chro-matographic peak is therefore affected by the rate of elution. It is also affected by the different paths available to solute molecules as they travel between particles of stationary phase. If we consider the various mechanisms which contribute to band broadening, we arrive at the Van Deemter equation for plate height:
HET P =A+B
υ +Cυ (2.3)
whereυis the linear velocity of the mobile phase, A is known as the Eddy diffusion which accounts for the different paths and lengths of the solute molecules passing through the column, B is the longitudinal diffusion coefficient for a concentration peak and C is the resistance to mass transfer component which describe the amount of time a solute takes to equilibrate between the stationary and mobile phase. A, B and C together are factors which contribute to describe the band broadening that occurs in a chromatographic column. Provided that Np is large
enough (> 10), the discrete stage model becomes numerically equivalent to the continuous linear rate model.
2.3 Theory of Linear Chromatography
Mobile phase velocity,
υ
Plate height, HETP
minimum plate height optimumvelocity
Figure 2.5: Typical Van Deemter plot - By representing the column HETPs dependence of the linear mobile phase velocity υ, the optimum flow rate for a chromatographic process can be obtained.
2.3.2
The Stochastic Theory
In 1955, Giddings and Eyring employed probability (stochastic) concepts to de-scribe the molecular migration process in chromatography. They developed a rigorous probability theory that gave a precise description of the influence of sim-ple adsorption-desorption processes on the zone profile. These authors considered the random migration of a single solute molecule along a chromatographic col-umn. They derived an expression for the elution profile of the molecules of the sample in the column, assuming random adsorption-desorption processes, with a single type of site or two different sites on the stationary phase and pulse in-jection. They ignored the axial dispersion and approximated the mass transfer kinetics in the mobile phase by what is now referred by the random walk theory of chromatography or theory of zone dispersion for the situation when the time spent by the solutes inside the column is large enough to allow each molecule to undergo a large number of individual sorption and desorption steps.
2.3 Theory of Linear Chromatography
dL
Figure 2.6: Random Walk Model - In a packed column the solute molecules will describe a tortuous path through the interstices between the particles and obviously some will travel shorter paths than the average and some longer paths. Consequently, some molecules will move ahead of the average and some will lag behind thus causing band dispersion.
distribution functions, by means of the theory of the Laplace transform.
2.3.3
The Solid-Diffusion Model
As clear shown by Giddings, chromatography is a separation method combining a chemical potential discontinuity in a direction perpendicular to that of a convec-tive transport. This naturally introduces the mass balance approach to calculate the chromatographic response to a given input injection or profile. This approach is based on the use of an equation of motion. In this method, one search for the mathematical solution of the set of partial differential equations describing the chromatographic process, or more precisely, the differential mass balance of the solute in a slice of column and its kinetics of mass transfer in the column. Var-ious mathematical models have been developed to describe the chromatographic process with great predictive value, the most important of these models are:
• Ideal model.
• Equilibrium-dispersive model.
• Lumped kinetic models.
2.3 Theory of Linear Chromatography
• General rate model.
The use of these several different models to describe the dynamic behavior of a chromatographic column has been extensively reported in literature. This work will focus on a lumped solid-diffusion model with linear driving-force approxima-tion for mass transfer. Despite its simplicity, this model is usually a precise tool to describe the chromatographic band profiles in most circumstances [1]. The mass balance equation comes:
ǫ∂ci
∂t + (1−ǫ) ∂qi
∂t +ǫυ ∂ci
∂z =ǫDi ∂2c
i
∂z2 (2.4)
where subscriptiis the solute index,z is the axial coordinate,Di is the dispersion
coefficient, υ is the linear velocity of the mobile phase, t is the time coordinate,
c and q is the concentration in the fluid and solid phases. The equation for adsorption kinetics is:
∂qi
∂t =ki ap (q ∗
i −qi) (2.5)
where ki is the mass-transfer coefficient, ap the surface of the adsorbent particles
and q∗
i is the adsorbed concentration in equilibrium with the bulk concentration
(c1, . . . , cn).
2.3 Theory of Linear Chromatography
ǫ∂ci
∂t + (1−ǫ) ∂q∗
i
∂t +ǫυ ∂ci
∂z =ǫDiL ∂2c
i
∂z2 (2.6)
where DiL is a lumped axial dispersion coefficient.
For the case of linear adsorption conditions, i.e. q∗
i =Ki ci, the lumped
solid-diffusion model is given by the following relationship:
1
Np
= 2Di ǫ
υ L +
2υ
(1−ǫ)L Ki ki ap
(1−ǫ)Ki
ǫ+ (1−ǫ)Ki
2
(2.7)
where Np is the number of theoretical stages that contribute to the axial
disper-sion.
The simplified equilibrium axial dispersive is equivalent to the solid-diffusion model provided that DiL is chosen so that the number of theoretical plates in
the two models are the same. Moreover, with the introduction of additional auxiliary dimensionless scales the equilibrium axial dispersive model (Eq. 2.6) can be simplified to:
(1 +βKi)
∂ci ∂θ = τ υ L hi 2
∂2c
i
∂x2 −
∂ci
∂x
(0< x <1), (2.8)
whereθ=t/τ andx=z/Lare the dimensionless temporal and axial coordinates, respectively,β = (1−ǫ)/ǫis the phase ratio,Lis the column length, Pei =υL/DiL
is the individual P´eclet number, q∗
i is the adsorption isotherm for solute i and ki
is the LDF mass-transfer coefficient. Moreover,
hi =
Hi L = 2 Pe′ i = 2 Pei
+ βKi (1 +βKi)2
2υ kiL
(2.9)
is the dimensionless plate height. The usual boundary conditions are:
ci−
1 Pe′i
∂ci
∂x =c
in
i for x= 0, (2.10)
∂ci
2.4 Batch Chromatography with Recycle Closed-loop
In the working range of fluid velocity used in preparative chromatography, the contribution of axial molecular diffusion is negligible [5] and one can consider the P´eclet number as being approximately independent ofυ. Furthermore, adsorption kinetics is usually governed by intraparticle diffusion rather than by external film resistance, which means that ki is also usually independent of υ. Under
these assumptions, the influence of υ on column efficiency simplifies into a linear relationship:
hi
2 = 1 Pei
+αiυ, αi =
βKi
kiL(1 +βKi)2
. (2.12)
2.4
Batch Chromatography with Recycle
Closed-loop
Closed-loop recycling is a chromatography process with a single-column that in-creases productivity and efficiency relatively to elution batch chromatography. The basic idea of the process is simple; because in batch chromatography the feed pulse is limited by the resolution of the peaks in the column, i.e. the column has to be sufficient long enough to allow complete separation of the peaks as one can see in Fig. 2.7, by means of recycling the traveling mixture several times through the column one can achieve higher peak resolution without the need of a longer column.
In closed-loop chromatography, like in batch mode, a feed pulse is injected into the column however at the end of the column there is the possibility of collecting the pure products fractions or recycling again to the top of the column. Through this recycling behavior, in practice one are increasing the column number of theoretical plates available for the separation because we are simulating the use of a longer column [6]. As showed in Fig. 2.7, the system setup is similar to a typical batch unit with the simple addition of a 4-way valve.
2.5 Simulated Moving Bed Chromatography
Pulsed Feed
Eluent
Products
Pump
4-port valve
Column
Collect Product B
Collect Product A Recycle Mixture
Figure 2.7: Closed-Loop Recycling Chromatography.
purified product fractions in each cycle to substantially decrease the cycle time and increase the overload of the column [8].
This process have been applied mainly in small-scale units as in the case of enantiomer separation [9] and have proved to produce fractions of high purity with higher load capacity and less solvent consumption relatively to elution batch chromatography.
2.5
Simulated Moving Bed Chromatography
2.5 Simulated Moving Bed Chromatography
Mobile Phase
Feed
Injection t0
Stationary Phase
Mobile Phase Stationary Phase
A + B
A B
time t + t0
Figure 2.8: Moving Bed Pulse Injection - schematic of the true moving bed principle. If one imagine a moving solid phase with a velocity between the elution rates of the two components, after a injection of a binary mixture the more retained solute (B) accompanies the solid flow and the less retained (A) follows the opposite direction.
2.5 Simulated Moving Bed Chromatography
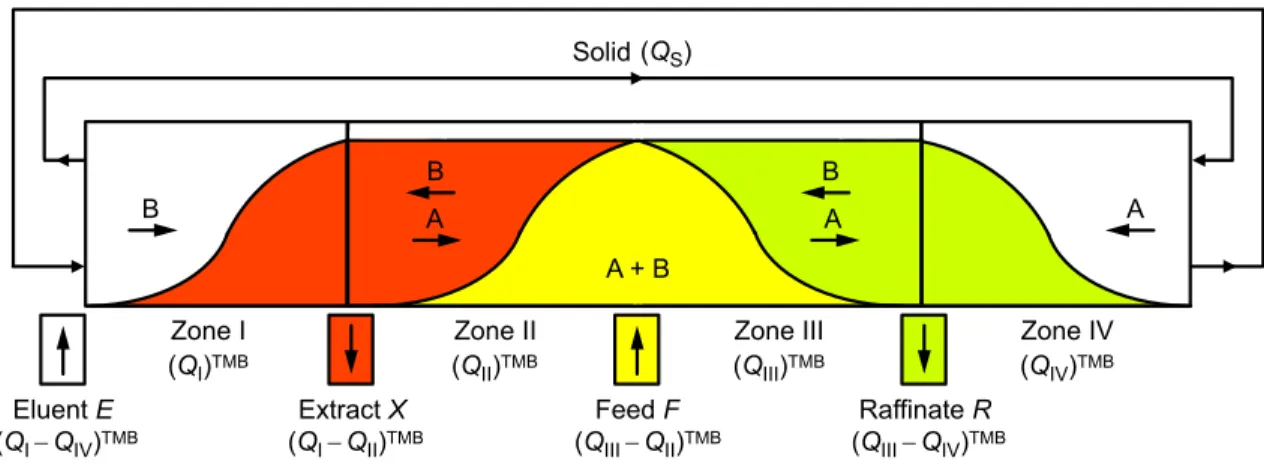
Using this concept one can continuously feed the column, creating two bands of pure material, each one moving to opposite ends of the column. This is the basic idea behind the TMB process. As one can see in Figure 2.9, this process is divided into four different zones, each one with a specific function:
• Zone I - The function of this zone is to regenerate the stationary phase, preventing that only clean solid passes to zone IV in the other end of the unit. It comprises the area between the addition of eluent (E) and the withdrawal of the more retained component, i.e. the extract (X).
• Zone II - This zone, together with zone III, are called separation zones
because it is where the separation of the two products is actually made. The main function here is to enrich the solid phase with the more retained component in a way that the fluid phase passing to zone III only drags the less retained component. It is defined between the lines of withdrawal of extract and the inlet of feed (F).
• Zone III - This is the other separation zone, where is adsorbed the more retained component that moves with the mobile phase so that the less retained product is carried by the fluid to the raffinate withdrawal (R). This zone is located between the feed and the raffinate ports.
• Zone IV - The role of this zone is to regenerate the solvent, preventing that the eluent that is recycled to zone I is not contaminated with products. It is the zone within the raffinate and the eluent lines.
2.5 Simulated Moving Bed Chromatography
Solid
Eluent (mobile phase)
Zone III Zone II
Zone I Zone IV
(QI)TMB (QII)TMB (QIII)TMB (QIV)TMB
(QS)
Eluent E (QI−QIV)TMB
Extract X (QI−QII)TMB
Feed F (QIII−QII)TMB
Raffinate R (QIII−QIV)TMB
B A A A
B B
A + B
Figure 2.9: Schematic diagram of the countercurrent chromatography process (true moving bed) with four zones.
The first practical implementation of the true moving bed concept was the Hypersorption process [10]. It was invented in 1919 by Soddy and developed by the Union Oil Company of California in 1946. They used a bed of activated car-bon moving countercurrently to a gas flow to separate light hydrocarcar-bons from each other and from hydrogen in refinery operations. However, the process was abandoned because attrition of the bed particles proved uneconomic. In practice, TMB has several built-in issues such as the difficulty to promote an homogeneous motion of the solid and the consequent mechanical erosion as well as back-mixing problems. As a consequence, true moving bed chromatography is nowadays only a theoretical concept, barely used in some liquid-liquid chromatography applica-tions.
2.5 Simulated Moving Bed Chromatography
Feed (F), t Extract (X), t X, t+τ
F, t+τ
E, t+τ
Raffinate (R), t Eluent (E), t
R, t+τ
Zone I
Zone II
Zone III
Zone IV Port switching in the direction of the fluid flow QII
QIII
QIV QI
Figure 2.10: Schematic diagram of the Simulated Moving Bed process. The continuous movement of the solid is simulated through the periodic switch of the inlet and outlet ports in the direction of the fluid flow. The Feed, Eluent, Extract and Raffinate are represented by the letters F, E, X, R respectively; Qj is the
fluid flowrate in zone j (j =I,...,IV) and τ is the switching interval.
The simulated moving bed process was first patented in 1961 by the company UOP LLC (Universal Oil Products) as the SORBEX process. This process has been applied for a large number of separations in the petrochemical and sugar industry under various tradenames, related to the specific separation in use. As showed in Fig. 2.11, the process relies on a single rotary valve to impose the switching scheme.
2.6 Unconventional Simulated Moving Bed
Eluent E
Extract X
Feed F
Raffinate R
Rotary Valve
Recycle Pump
Figure 2.11: Schematic diagram of the SORBEX process. A single rotary valve controls the switching of the inlet and outlet lines through a single column sep-arated by various adsorbent beds. This process was firstly applied in large-scale for the petrochemical industry.
2.6
Unconventional Simulated Moving Bed
Due to the cyclic arrangement and the periodic nature of the SMB process, af-ter an initial transient state, the system reaches a cyclic steady state (CSS) in which the process exhibits the same dynamic behavior during each switching in-terval. Thanks to recent developments in cyclic operation schemes, a number of possibilities for improving SMB performance have merged through variation of parameters during a switching interval.
2.6.1
The VARICOL process
2.6 Unconventional Simulated Moving Bed
(Eluent and Feed) and outlet (Extract and Raffinate) lines simultaneously. As a consequence of this synchronous switching of lines, the number of columns in each zone stays the same in every moment, regardless of the location of the inlet/outlet ports, making it possible to describe an SMB process in terms of how the columns are distributed among zones: NI/NII/NIII/NIV, being PNj =N. Obviously, in
a conventional SMB process Nj is an integer number, however if one allow the
ports to have an asynchronous shift then we have a column zone distribution that represents the average zone length during a complete process cycle, expandingNj
to the rational domain (provided that P
Nj is still an integer). This means that
the process is no longer equivalent to a TMB but now has some extra parameters, i.e. the switching times of the single inlet and outlet lines.
A simplified scheme of the Varicol process is showed in Fig.2.12. The Varicol can be viewed as a subdivision of the switching interval into one or more steps of different port configurations; in the case of the SMB all ports remain in the same position for the all interval and then they shift together one column ahead in the direction of the fluid flow. However, in the Varicol case there is one or more subdivisions of the switching interval where the ports do not shift together but in the end of the interval they all have advanced by one column. Fig.2.12represents an example of a Varicol scheme with one simple subdivision α (α < 1) of the switching interval τ where only the raffinate port is moved forward expanding zone III to 2 columns and eliminating zone IV. For this example, the SMB is a process with 4 columns with a column zone configuration of 1/1/1/1, but the Varicol can be described with a average zone length of 1/1/(2−α)/α and still maintain P
Nj = 4.
2.6 Unconventional Simulated Moving Bed
X R
E F
t
X R
E F
t+ατ (α<1)
X R
E F
t+τ
VARICOL SMB
Figure 2.12: Simplified scheme of the Varicol process. The position of eluent (E), feed (F), extract (X), and raffinate (R) ports are identified by arrows. The height of each shaded area is proportional to the flowrate through the corresponding column. The standard SMB scheme keeps the topmost configuration constant over the whole switching interval τ; all ports are then switched forward by one column in the direction of fluid flow. In Varicol mode the ports are switched asynchronously. For example, after a fraction α <1 of the switching interval the position of the raffinate port is moved forward by one column, giving rise to the middle configuration, which has increased zone III by one column and removed zone IV but still maintaining the same zone I, II and III flowrates; at the end of the switching interval all ports have moved forward by one column like in the SMB scheme.
2.6 Unconventional Simulated Moving Bed
E
F
R
X
E
F
R
X
E
F
R
R
X
E
F
R
X
F
1.0/1.2/1.4/0.4
Zone I Zone II Zone III Zone IV
1.0/1.0/1.0/1.0
E
F
R
X
E
F
R
X
E
F
R
X
E
F
R
X
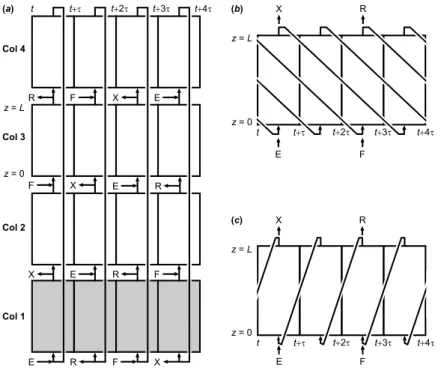
(a) (b)Figure 2.13: Chronograms of port switch over a complete cycle for the (a) SMB and (b) VARICOL processes. Notice that in the case of the SMB all ports shift simultaneously at the same time, for the VARICOL process the switch is made asynchronously. In the beginning of the next process cycle in both cases all ports have moved N columns ahead.
2.6.2
The PowerFeed process
Other parameters that can be manipulated during a switching interval of the SMB process are the zone flowrates. This mode of operation was first patented in 1992 [17] and was named as a “Time Variable Simulated Moving Bed” where the internal flowrates are manipulated for each switching interval in a way that the characteristic steady state waveform is modified to favor the separation process, and demonstrated for a simple sugar separation. More recently, this operation was analyzed for various classes of τ-periodic modulations that extend from a simple discontinuous pulsed feed and product withdrawal [18, 19] to a simultaneous piecewise-constant change of all internal flowrates in a theoretical study of the separation of xylenes [20] and chiral separations [21,22].
2.6 Unconventional Simulated Moving Bed
X R
E F
t
X R
E F
t+ατ (α<1)
X R
E F
t+τ
SMB
PowerFeed
Figure 2.14: Simplified scheme of the PowerFeed process. The position of eluent (E), feed (F), extract (X), and raffinate (R) ports are identified by arrows. The height of each shaded area is proportional to the flowrate through the correspond-ing column. The standard SMB scheme keeps the topmost configuration constant over the whole switching interval τ; all ports are then switched forward by one column in the direction of fluid flow. In PowerFeed operation, which is illustrated by the intermediate step, the flowrates are varied over a fraction of the switching interval but the ports are only moved forward by one column at the end of the step like in the SMB mode.
have shown to either increase the productivity or reduce the specific solvent con-sumption.
2.6.3
Other nonclassical modes to operate an SMB
2.6 Unconventional Simulated Moving Bed
ModiCon
SMB
Feed concentration
0 τ
time
X R
E F
t
X R
E F
t+τ
Figure 2.15: Simplified scheme of the ModiCon process. In the right one can see the port switch scheme for the switching interval which is exactly like in the classical SMB process, i.e. at the end of the switch all ports move simultaneously one column ahead in the direction of the fluid flow. The left graphic shows the evolution of the feed concentration over the switch; in the case of the SMB it is constant over time but for the ModiCon process the feed concentration profile is defined by various steps. In the exemplified case there is a part of the interval where the feed is pure eluent (cF = 0) then one create a step wave where cF is two times the feed concentration of the equivalent SMB process, this means that one are adding the same amount of feeding mixture to the process.
process consists of dividing the switching interval into several piecewise constant steps of different feed concentration. This scheme has proved to both increase productivity and product concentration and at the same time reduce the specific solvent consumption [25]. However it presents the drawback that can only be a valid approach in separations where the feed concentration is limited by technical reasons and not by the solubility of the components in the used solvent [24].