THIS REPORT WAS PREPARED EXCLUSIVELY FOR ACADEMIC PURPOSES BY FRANCISCO ONOFRE, A MASTERS IN FINANCE STUDENT OF THE NOVA SCHOOL OF BUSINESS AND ECONOMICS.THE REPORT WAS SUPERVISED BY A NOVA SBE FACULTY MEMBER, ACTING IN A
M
ASTERS IN
F
INANCE
▪ The commercial automotive industry has been preparing itself for the challenge ahead driven by environmental issues. Disruptive technological developments, new engines and new players are awaited ▪ Although at a slower rate the truck business unit is benefiting from the overall positive outlook and high margins are expected to be maintained with Europe as the major company’s market.
▪ The comeback of the Chinese construction sector will be the seed for an increase of Construction Equipment on the company’s overall sales from 21% to 26% at 7,6% CAGR 2018-2023 supported by SDLG ▪ Asian joint-ventures are ready to overcome the problem of network service’s coverage and capture value from the two largest truck markets in the world
Company description
AB Volvo is the parent company of the Volvo Group. The Volvo Group is one of the world’s leading manufacturers of trucks, buses, construction equipment and marine and industrial engines. The Group also provides complete solutions for financing and service.
AB
V
OLVO
C
OMPANY
R
EPORT
COMMERCIAL AUTOMOTIVE
23MAY 2018S
TUDENT:
F
RANCISCOO
NOFRE[email protected]
Growing in a changing industry
Driving towards sustainable vehicles...
Recommendation: BUY
Price Target FY18: 202,78 SEK
Dividends Forecast FY18 4,25 SEK
Price (as of 23-May-18) 159,85 SEK
Bloomberg: VOLVB: SS
52-week range (SEK) 131,60-171.30
Market Cap (SEK M) 340 581
Outstanding Shares (m) 2 128
Source: Bloomberg
Source: Bloomberg
(Values in SEK millions) 2017 2018E 2019F Revenues 334 748 374 396 381 138 EBIT 30 326 35 549 35 397 Net Profit 21 283 25 441 25 847
EPS 10,32 11,95 12,14
ABVOLVO COMPANY REPORT
Company Overview
Volvo is a leading global high-end manufacturer of trucks, buses, construction equipment and marine and industrial drive systems, headquartered in Gothenburg, Sweden. The company was created in 1927 as a subsidiary of the Svenska Kullagerfabriken AB group, a Swedish ball bearing manufacturer. The idea arose from SKF sales manager Assar Gabrielsson and from the mechanical engineer Gustaf Larsson with the propose of building outstanding vehicles capable of performing under the Swedish climate and terrain. The production of the first lines of cars and trucks began in 1927 and 1928 respectively. In 1935, AB Volvo went public in the Stockholm Stock Exchange with SKF divesting completely its position in the company. In the same year, AB Volvo acquired AB Pentaverken one of its car engine suppliers which enabled the company to secure the supply of engines and to enter in the marine engine market whose division would be later named as Volvo Penta. The company also achieved an important milestone in its history which was the production of its first bus series which later it would become the Volvo Buses. The following years were marked by several acquisitions that allowed the company to increase its capacity and product portfolio to new lines of businesses. In the early 1950’s, AB Volvo acquired the tractor and machinery manufacturer AB Bolinder-Munktell as a first step towards the creation of Volvo Construction Equipment division. Later in that decade, the company created one of the most important solutions for car industry safety, the three-point seat belt. Following this, the company launched its own accident research department that has been responsible for developing technologies such as the side collision airbag or the impact absorbing steering wheel for trucks. The period from 1960’s until late 1980’s was dedicated to growing organically through several openings of manufacturing and assembly plants in Europe, Asia, and Oceania. These plants guaranteed AB Volvo enough capacity to position itself as a truly global manufacturer. The company’s research and development capabilities did not end in safety, it was also pioneer in the environmental field by creating a three-way catalytic converter as an effective solution to control exhaust emissions on vehicles which later became widely used across the auto industry. The 1990’s decade was marked by the failed alliance with Renault whose propose was seeking for synergies to improve both companies’ performance in the car segment. The inability to compete against the entrance of new players in the car industry affected significantly the Volvo Cars performance which led AB Volvo to redefine its strategy by focusing on the commercial automotive industry. This strategic shift resulted in the sale of the Volvo Cars to the Ford Motor Company for SEK 50 billion in 1999. Following this deal, the company created a new group named the Volvo Group, as a subsidiary of AB Volvo which comprised the remaining commercial vehicle businesses which already included two north American bus manufacturers, Prevost and Nova Bus, acquired in 1995 and 1998, respectively. The following decade registered a high level of acquisitions activity driven by the aim of expanding geographically while benefiting from potential synergies and economies of scale regarding product development, production, and purchasing. During this period the company strengthened its truck business by acquiring Renault Vehicules Industrials that had a strong presence in Europe and North America with the Renault Trucks and Mack Trucks brands, respectively. The acquisition of UD Trucks, former Nissan Trucks, enabled the company to enter the Japanese market. AB Volvo also holds minority stakes in two joint-ventures in partnership with the light and medium truck manufacturers Eicher Motors (VECV, India) and Dongfeng Commercial Vehicles
ABVOLVO COMPANY REPORT
(DCFV, China) of 45,6% and 45% respectively. In the Construction Equipment business, the company acquired a 70% of the Chinese wheel loader manufacturer Shandong Lingong Construction Machinery (SDLG) and expanded its operation to the U.S market, thoughout the acquisition of the road equipment division from the Industrial manufacturer Ingersoll-Rand, and the hauler equipment division from Terex. During the same period, the company also divested some of the non-core operations such as Volvo Aero, Volvo Rents, and IT business.
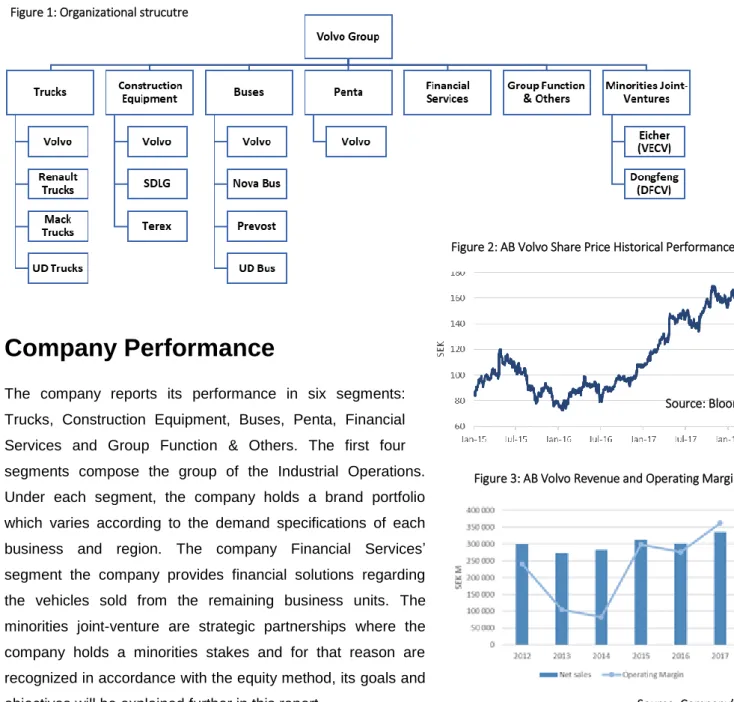
Currently, the Volvo Group has the structure shown in Figure 1
.
Company Performance
The company reports its performance in six segments: Trucks, Construction Equipment, Buses, Penta, Financial Services and Group Function & Others. The first four segments compose the group of the Industrial Operations. Under each segment, the company holds a brand portfolio which varies according to the demand specifications of each business and region. The company Financial Services’ segment the company provides financial solutions regarding the vehicles sold from the remaining business units. The minorities joint-venture are strategic partnerships where the company holds a minorities stakes and for that reason are recognized in accordance with the equity method, its goals and objectives will be explained further in this report.
Figure 1: Organizational strucutre
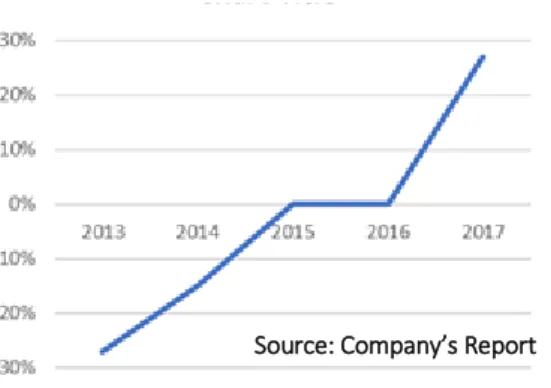
Figure 2: AB Volvo Share Price Historical Performance
Figure 3: AB Volvo Revenue and Operating Margin Source: Bloomberg
ABVOLVO COMPANY REPORT
Figure 4: Financial Position in Industrial Operations as % of Shareholders’ Equity
In April 2015, Martin Lundstedt was appointed CEO after a three-year period where the company went through a restructuring plan based on
the
reduction of structural costs and a product renewal to improve its efficiency after the acquisition-driven growth period. From that moment, AB Volvo Group’s new strategy would be focused on organic growth and to improve profitability through continuous improvements and innovation.In the following three annual reporting periods
,
2015, 2016 and 2017, the company registered operating margin increase to 7,46%, 6,90% and 9,06%, respectively. In August 2017, the Board ofDirectors announced that under normal conditions the Industrial Operations segment shall have no financial indebtedness excluding the pension liabilities. As it can be observed in
the Figure 4, the current financial position as percentage of the shareholders’ equity illustrates a net cash position of 25,16%. However, this situation does not represent a positive Net Financial Debt position once that for this calculation the management has considered the Internal Funding used to finance the Financial Services segment as a Cash Equivalent. Without considering the Internal Funding and assuming book values the Net Financial Debt as percentage of shareholders’ equity would be a net debt position of 77%.
In 2017, the company had SEK 335 billion consolidated in revenues, of which approximately 65% was in trucks, 20% was construction equipment, 8% in buses, and 3% from marine engines. The Volvo Group sells its products in more than 190 markets, and in 2017 having realized 43% of its revenue in Europe, 25% in North America,
21% in Asia and the remaining in South America, Africa & Oceania1. In order to answer the global demand,
the company set up a structure with more than 84.000 employees and a production infrastructure spread across the five continents and in most of the cases the facilities are shared between divisions within the Industrial Operations2. The current organizational structure of diversified business segments and a strong
presence across the globe guarantee the company two important aspects for its overall performance. The fact of being competing in different commercial vehicles segments, the company benefits from economies of scope through sharing a common architecture and technology on engines, electronics, and transmissions among its products. Additionally, this business diversification combined with its global presence will also help the company to manage
1 Company Report 2017 2 Company Report 2017
Figure 6: AB Volvo Revenue by Business
Figure 7: Investment in Research and Development Figure 5: AB Volvo Revenue by Region Figure 4: Financial Position in Industrial Operations as % of Shareholders’ Equity
Source: Company’s Report
Source: Company’s Report
Source: Company’s Report
ABVOLVO COMPANY REPORT
effectively a possible market slowdown from a specific region or business. Regarding its global presence, the company’s strategy of maintaining the regional brands3 after the acquisitions in respective home markets also
mitigates the risk of “one-brand-fits-all”, thus ensuring a smoother entrance in each market while guaranteeing a sufficient service network coverage. AB Volvo has been consistent regarding to what concern investing in research and development capabilities presenting steady levels of investment in research and development4 of around 5% of the its Sales. By maintaining this focus and investment in innovation and R&D
capabilities it is expected the AB Volvo to be prepared to address the upcoming challenges in the commercial automotive industry which will be discussed later in this report.
Shareholder Structure
As mentioned above, AB Volvo is the parent company of the Volvo Group, is listed in the NASDAQ Stockholm, Sweden stock exchange since 1935, and is currently included in a large number of indexes compiled by Dow Jones, FTSE, S&P and Nasdaq Nordic.
The company’s share capital is divided into two classes A and B.
Both classes have the same rights except for voting at Annual General Meetings. Each class-A share entitles the shareholder to one vote whereas one class-B share carries one-tenth of a vote.
As of 31 March 2018th the company has 2,021 billion shares outstanding with a
high level of free-float representing 95% of the registered shares. According to the historical performance of both class of shares the investors’ opinion seems to converge to a consensus that the price of the control premium likely to be paid for a class A is almost offset for a potential lower liquidity from the same class of shares. The overall share capital structure presents a low-level of ownership concentration and at the end of last year the investment manager Cevian Capital, the largest shareholder in terms of ownership, sold its stake of 8,3% to Zhejiang Geely Holding Group for approximately SEK 33,37 billion5. The deal assumed an implied
valuation of SEK 402,05 billion representing a 21,41% premium when compared to
market value verified at 27th December of 2017. Under the terms of the agreement Nomura Holdings Inc and
Barclays Plc have committed to hold the shares while the regulatory approvals are concluded. At the date of the announcement the Chinese group, who also owns Volvo Cars, stated that aims to contribute positively to the long-term development of A.B. Volvo mainly through its Chinese market expertise and leading capabilities in the fields of electrification, autonomous driving and connectivity. However, in the last February, the potential of this partnership it seems to be vanished having AB Volvo’s election committee not proposed the Geely-linked board member to re-election, after the Chinese group acquired a 10% stake on A.B. Volvo’s major competitor, Daimler AG. The company has paid a fixed dividend of SEK 3,00 during the period 2011-2015 share having increase it in the following two periods to SEK 3,25 and SEK 4,25 in 2016 and 2017,
3 Renault Trucks, Mack Trucks, UD Trucks & Buses, Nova Buses, Prevost and the joint-ventures VECV and DFCV
4 Part of this investment might not be recognized as “Capitalized R&D” due to insufficient “criteria meeting” required by the IFRS standards. 5 Richard Milne. “China’s Geely takes €3.25bn stake in truckmaker Volvo Group”, Financial Times, 27 December 2017, Web 13 May 2018
Figure 8: Class A and Class B Historical Share Price
Source: Bloomberg
Figure 8A: AB Volvo Ownership Structure
ABVOLVO COMPANY REPORT
respectively. These increases are aligned with the success of the restructuring program, profitability improvements and positive financial net position, mentioned above.
Commercial Automotive Industry
The commercial automotive industry is a strategic pivot for economic growth and development. The fact of being responsible for transporting people and goods or even to build roads and cities call itself the concerns from governments and local authorities about what should be the best practices to take in order to provide the best service for economy, people and to the environment.
External context
• Environmental global context
In 2015, the Paris Agreement brought all countries into a consensus to tackle climate change threat through a commitment to hold the global average temperature rise between 1.5-2º Celsius above pre-industrials levels during this century. It was the first time in history a deal brought together all the world’s nations into an agreement to cut greenhouse gas emissions (GHG).
The transport sector plays an impact role in this matter representing approximately one-quarter of the CO2
emissions globally, according to the International Energy Agency6 in 2015. The volume of emissions
produced by this sector grew more than in any other sector between 1990-2013, around 60%7. The road
sector accounted for three quarters of the transport emissions registered in 20158. The medium and
heavy-duty vehicles position, behind the light-passenger vehicles, as the second largest contributor of road sector emissions. For instance, in European Union, the medium and heavy-duty vehicles, which includes buses and trucks, represent near one quarter of the road sector emissions and 6% of the overall emissions having other regions like North America and Asia registered similar weights. This trend is projected to continue growing propelled by the expected increase in the global economic trade. Given these circumstances governments across the world have set strategies and implemented measures to define a clear path targeting the decarbonization of the transport sector either for passenger and commercial vehicles.
In 2011, the European Commission announced a long-term vision until 2050 to build a competitive and resource efficient transport system to increase mobility, to reduce CO2 emissions and oil dependence while promoting growth and employment. The strategic plan “Roadmap to a single European transport area” established ten goals that were set as a guidance to achieve a 60% reduction of GHG emissions from transport sector by 2050 with respect to 1990 levels. Part of the strategy consists in an optimization of the performance of the current logistic chain which includes a greater use of more energy-efficiency mode with priority given to railway. The European emission standards are another measure that European Union have been implementing progressively through EU directives since 1992, representing a quicker tool to reduce emissions and improve air quality. These standards require every new model to undergo a controlled emissions test procedure before it can be commercialized.
6 IEA (2017), “CO₂ Emissions from fuel combustion Highlights”, IEA Publications, p.12 7 OECD/ITF (2017), ITF Transport Outlook 2017, OCED Publishing, p.42
ABVOLVO COMPANY REPORT
In the United States, there is still a high level of uncertainty regarding the impact of the Trump’s Administration decision to pull out the Paris Agreement once it will be only effective in the end of the current mandate and how it will allocate the Infrastructure Plan announced by the President in the beginning of the year to understand which type of transport modes will take the priority regard transportation’s strategy. However, like the European case, the North American agencies Environmental Protection Agency and National Highway Traffic Safety Administration have been ruling emission limits requiring engines manufacturers an ongoing emission improvement process in their products to comply in legislation over the past three decades. Some states like California are setting stricter levels when compared with federal legislations9.
This kind of restrictions has been progressively adopted across the world having other regions of world that either adopted European and North American regulation or creating their own regulations like China and Japan. In some cases, we are witnessing countries and cities taking the first steps to go beyond emissions as it can be seen by the ban of diesel cars from cities from the German local authorities10.Although this decision does not affect directly the heavy-duty truck vehicle sector, it is revealing about the governments’ plans regarding the future of the transportation sector which certainly will have the public transportation sector, mainly city-buses, as their first target.
• Road safety
Demographic trends are also affecting commercial automotive industry, population growth along with the increasing urbanization rates across the world mean higher levels of traffic in large cities and respective outskirts resulting in higher road and highway’s congestion. Traffic congestion is a transport network condition that affects the normal operation of the road transport network. More than passengers’ delays, fuel consumption and GHG emission raises, this phenomenon makes the road more conducive for car accidents, less safe for road’s users/agents and therefore a public safety problem. According to Volvo’s Accident Research department11 on average per year 1.2 million are killed in road traffic accident worldwide making
them a global concern for the society. Behind this figure there is an infinite of factors to explain each accident that are usually caused by more than one factor. Volvo’s Accident Research team reported that 90% of the accidents involving truck has origin in human error, having environmental conditions responsible for 30% and just 10% occurred due to mechanical failures. To prevent this phenomenon Government and local authorities might focus on policies to promote best practices awareness among the most vulnerable road users, increase their action’s radius on tackling speed and drink driving and to invest in safer infrastructures. However, these efforts will always fall short in being effective on those situations where the driver is distracted, tired or having an improper steering. Over the years, manufacturers have been introducing several automation processes to assist drivers to prevent accidents with high potential crash situations such as the Assisted Brake System that improved the vehicles’ reaction in situations where the wheels blocked. In the next decades it is expected manufacturers to improve vehicle’s safety by increasing the automation processes that take the lead to prevent high potential crash situation rather than react to them.
9 Hiroko Tabuchi. “Calling Car Pollution Standards “Too High”, EPA Sets Up Fight With California”, Washington Post, 2 April 2018, Web 13 May 2018 10 Grace Donnelly , “German Cities Can Ban Now Ban Diesel Cars” Fortune, 27 February2018, Web 27 Mar 2018
ABVOLVO COMPANY REPORT
Industry trends
• Driver shortage
Another trend affecting the commercial automotive industry, mainly the truck industry, is the current driver shortage which has been verified across the globe in the past two decades. According to the World Road Transport Organization12, this problem is affecting either developed and emerging countries. Whereas the
United States has an average age of 47 years old and it is projected the need to hire more one million new drivers in the next 15 years. European countries like Germany will have around 40% of their current driver force retired within a 10 to 15 years period. In India near 10% of the truck fleet is currently not operating due to the lack of drivers. The current situation is expected to worsen in the following years considering the likeliness of the global trade in goods and services to rise in the long-run. The lack of skilled drivers will put pressure on the road freight industry to increase drivers’ salaries, which currently represents near 30-40% of the total operating costs, with an expected increase in the price which might final customer to seek for alternative modes of transportations. Automation and connectivity might be also an answer for this problem, currently we have assisting to developments in these two fields regarding autonomous driving and truck platooning that will allow freight companies to do not depend so much on the drivers
Next stop for the commercial automotive industry
Having highlighted the external and internal drivers of the industry, there are evidences to consider that the industry has no chance to deflect from alternative fuel engines and from technological development respecting to autonomous driving systems. However, a long and tough path has to be done from manufacturers, suppliers, customers and government to create an appropriate ecosystem for alternative autonomous commercial automotive vehicle prevail.
• What it will take to the transition for alternative fuel engines?
Having the emissions regulations progressively becoming stricter, and in some situations with diesel bans scheduled and ready to take place, it is expected the commercial automotive industry to follow the steps towards alternative fuels like the passenger automotive industry. Nevertheless, it is important to point out the distinctive driving patterns present across the different segments of commercial vehicles and how this transition will affect them. In order understand these implications, two major categories driving patterns were set13:
- Long-haul: This category includes all the routes that run over a 300 km to complete its full
journey. As an example, it might be considered an international freight which will need to do
12 World Road Transport Organization “Driver Shortage Problem”, IRU, Web 02 April 2018 13 Short-haul routes were not considered once are mainly operated by light-duty trucks.
ABVOLVO COMPANY REPORT
multiple stops until reaches its final destination. In general, these routes are operated by heavy-duty trucks which combines a tractor and one or more semi-trailer to carry freight. - Regional and urban-haul: These routes require a distance below 300 km to complete its full
journey and present a high level of predictability and repeatability. For instance, depot-to-depot delivery, urban distribution and delivery, and city buses route. For this type of assignment operators usually prefer to use medium-duty trucks which the payload body cannot be remove from the cabin.
Currently the solution towards the decarbonatization for regional and urban hauls operated by the medium-duty truck segment seems to have been found by the main truck manufacturers. Daimler14 and Volvo15
already announced additions of full electric-powered trucks with a range near 250-350 km to their portfolios to be commercialize in the following years. In the meanwhile, Volkswagen announced an investment of $1.7 billion to develop electric powertrains for its trucks and buses16.
For the long-haul segment, manufacturers are still struggling with a range of different solutions to tackle the decarbonatization problem. When building a truck is important to bear in mind they are limited to payload and space available to transport freight which varies depending on their class. As mentioned before, heavy-duty trucks class operates in distance ranges between 300 km to 700 km which will require a high energy level. When analysing electric battery vehicles is also important to understand that current marketed Li-on battery provide lower energy density when compare with diesel engine, so for this reason they would become less competitive as the expected distance range for the vehicle increases. For the specific case of long-haul journey, the truck would require a volume of battery to comply with its range needs that will jeopardize the payload capacity making it non-competitive17. Lithium batteries have been improving its energy density over
the years achieving a 100% improve between 1990-2010 and some scholars argue there is still room to improve it18. In case of this limitation being successful overcome it will be necessary to build an appropriate
infrastructure to recharge and support trucks on their long-haul journey. According to an article published in the Energies Journal from MDPI19 where the scenario of heavy-duty battery trucks in Germany was
evaluated, it was estimated that would be need to provide the 2113 resting area on German highway with charging places with two types of chargers: 6 “fast chargers” to use during the drivers resting times20 and 26
“slow chargers” to be used over the night period21. Based on the cost of chargers for public buses, once there
are no heavy-duty truck chargers available in the market, each charging place was estimated to cost near 3.5 million. From a practical point of view and ignoring the technological limitations associated with the heavy-duty battery trucks, the success of the electrification of this class would be far more dependent from external factors (e.g. governmental investment) to guarantee an appropriate charging infrastructure than medium-duty trucks which would only need a charging station on their depot/base. Additionally, it is also important to bear in mind that for longer inland distances, rail transportation is considered to be more competitive than road in
14 Press Release. “Premiere for Volvo Trucks’ first all-electric truck”, Volvo, 12 April 2018, Web 21 April 2018 15 Fred Lambert. “Daimler starts delivering all-electric trucks in Europe”, Electrek, 14 December 2017, Web 21 April 2018
16Fred Lambert. “VW plans large $1.7 billion investment to bring electric trucks and buses to market”, Electrek, 12 October 2017, Web 21 April 2018 17 Viswanathan, V. (2017, June), “Performance metrics required of next-generation batteries to make practical electric semi-trucks”, ACS Energy Letters 18 Tetsuo Nozawma. "New battery technologies still years away", Nikkei Asian Review. 2 April 2017. Web 06 May 2018
19Mareev, I.; Becker, J.; Sauer, D.U. Battery Dimensioning and Life Cycle Costs Analysis for a Heavy-Duty Truck Considering the Requirements of Long-Haul
Transportation. Energies 2018, 11, 55
20 According to European Union legislation, truck drivers have a compulsory resting time of 45 minutes after a 4,5 hours driving. 2114 hours period that follows the two daily shift of 4,5 hours
ABVOLVO COMPANY REPORT
terms of cost and payload, while having a better impact concerning to GHG emissions and road’s congestions issues. For these reasons, is expected from a government’s perspective to give higher investment priority to a transport mode that addresses a higher amount of transport network. In those regions where the railway network presents some limitations concerning network coverage or operational issues, in other words an investment gap situation, the heavy-duty trucks will have their opportunity at least until the investment need is fulfilled. Considering, for instance that “Roadmap to a single European transport area” is still in work-in-progress situation, this represents a short-to-medium term opportunity to manufacturers to keep developing and improving the current ICE engines of their heavy-duty trucks or even moving toward a hybrid engine combining electric battery and improved ICE engines.
The technology behind these two alternatives, full electric and hybrid powertrains, is the same that have been used for passenger cars, lithium-ion batteries. Currently, due to its unique characteristics of high energy density and light weight, lithium remains as the only option in the market to supply electric-vehicle’s batteries. Unlikely other commodities, lithium cannot be stored more than 9 months otherwise it would be start reacting and degrading, not enabling the commodity to be traded on any major exchange. For this reason, there are no public prices leaving each contract negotiation to settle its own price. For this transition will be important to understand if there would be enough supply to match the expected growing demand which have been pushed not only by trucks but mainly by passenger cars. According to the U.S Department of the Interior22,
the current global lithium resources23 are estimated to be around 53 million tons which 16 million tons
reserves24 where lithium could be already extracted.
This could represent a challenge for Volvo once its major competitors, Daimler and Volkswagen, own a passenger car business with higher demand for lithium giving them higher bargaining power and priority when dealing with lithium suppliers or batteries makers. However, in the long-run this challenge is expected to be diluted considering the high price of lithium and the abundance of lithium available to be extracted.
As mentioned above AB Volvo has already positioned itself in the regional and urban haul segment, with the announcement25 that will start selling medium-duty electric trucks in 2019 under its Volvo and Renault Trucks
brands. The successful in this segment will depend on AB Volvo’s capacity to understand its customer individual needs regarding driving cycles and load capacity and together with charging equipment suppliers provide a suited solution to make the transition smooth and secure.
• What it will take to the transition to autonomous trucks?
The current expectation on the transition to connected and automated driving systems suggests that it can be one of the largest industry’s disruptors being capable to reduce and mitigate industry’s challenges and risks such as road safety, driver shortage and fuel efficiency. Being self-driving trucks the ultimate goal of full
22 U.S Department of Interior. (2018, January). “Mineral Commodity Summaries 2018”. U.S Geological Survey, pp.99-100
23 A concentration of naturally occurring solid, liquid, or gaseous material in or on the Earth’s crust in such form and amount that economic extraction of a commodity from
the concentration is currently or potentially feasible
24That part of the reserve base which could be economically extracted or produced at the time of determination. The term reserves need not signify that extraction facilities are in place and operative.
ABVOLVO COMPANY REPORT
automation, there is still a long way to run and many small steps that have to be taken whose are depending on several aspects such as customers acceptance, technological developments, legislation and operating infrastructure.
By analysing the different levels of automation driving for on-road vehicles on the Table 1 and the portfolio offered by the major manufacturers, the current equipped technologies on trucks can be positioned on the stage 1 regarding automation level having the Adaptive Cruise Control and Lane Keep Assist systems as the most impactful ones. Truck platooning is a technology under development which is considered by the industry’s practitioners as the state of art technology with the potential to change the current landscape completely. This technology is a connected driving system that enables two or more trucks in convoy to automatically maintain and set a close distance between each other. The truck in the lead of the platoon defines the route and the remaining vehicles react and adjust to change in its movements with little or almost no action from the respective drivers. In a more advanced stage, is anticipated that technology requires just one driver on the leading truck being the remaining ones driverless. This technology projects trucks to be more efficient on saving fuel, reducing emissions and traffic congestion, and enhanced safety due to the lower human intervention on the driving. Additionally, in a later stage this technology might also be useful to address driver’s shortage problem outlined before.
In order to achieve the later stages of automation it would be necessary to develop critical software and hardware technologies such as sensors, communicators, and vehicles’ controls to collect spatial imaging data, to interact M2H and to define and control the route. Whereas these advancements will require a new supply chain, new players will try to step in this market having Uber27, Tesla28 and Google29 already
announced their intentions and the outcomes of their initial experiments.
It is important to highlighted that for autonomous driving be possible it will be need a completely new legal driving framework to clarify issues about liability or even to define testing areas where manufacturers could enhance their products. The responsibility to draw this legislation is entrusted to governments and local authorities. Another important issue that must be solve before autonomous driving being approved is the ethical consideration behind the machine decision-making, considering it is a highly sensitive subject its feasibility might have be jeopardy in case of low level of comfort with machine’s decision-making from the
26 “Hands off” when using Lane Keep Assist and “feet off” when using Adaptive Cruise Control
27 Daisuke Wakabayashi. “Uber’s Self-Driving Trucks Hit the Highway, but Not Local Roads”, NY Times, 6 March 2018. Web 13 May 2018 28Julia Wong. “Elon Musk unveils Tesla Electric truck – and a surprise new sports car”,The Guardian, 17 November 2017, Web 13 May 2018 29Fred Lambert. “Waymo officially expands self-driving effort into trucks”, Electrek, 9 March 2018, Web 13 May2018
Stage 0 No Automation Driver is fully engaged, and warning signals might be displayed Stage 1 Driver Assistance Driver is fully engaged and may be “hands off” or “feet off”26
Stage 2 Partial Automation Driver is fully engaged and may be both “hands off” and “feet off” but eyes must
stay on the road Stage 3 Conditional
Automation
Driver responds to a request to intervene, may be “hands off”, “feet off” and “eyes off” but must be able to resume control quickly
Stage 4 High Automation Driver is not expected to monitor the road and has no responsibility during the
automated mode
Stage 5 Full Automation Driver has no responsibility during the entire driving Table 1: Society of Automotive Engineers International – Automation Levels
ABVOLVO COMPANY REPORT
public. The time taken to solve these questions will be critical to define the speed of the adoption rate of this technology. According to the consulting firm Roland Berger30, the stage 5 of autonomous driving systems will
result an increase of USD 20.000 on truck’s price mainly driven from the incremental software and hardware. On the other hand, it will represent a saving of almost 1.2 USD/mile which means that driver would need only 16.000 driven to drive down the total cost of ownership.
AB Volvo have been taking steps towards autonomous driving system in past couple of years. Since 2016, the company have been testing a self-driving truck which operates in the Kristineberg Mine31. By
manufacturing and developing autonomous trucks to operate in controlled environments such a construction site or a mine, allows the company to target a segment where legal driving framework or ethical issues related with machine decision-process might be bridged more easily and for that reason experienced a higher speed to be marketed.
Business units
Trucks
The company’s truck segment manufactures and sells medium to heavy premium truck for long-haul, regional transport and construction operations. The ability of trucks to move goods quickly and safely to markets make them essential for international trade, national distribution trade
,
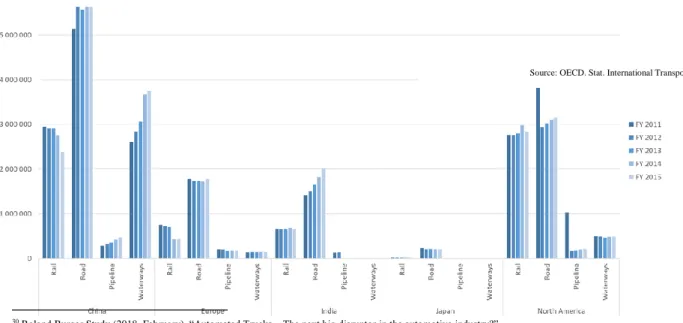
and economic development. Trucks’ flexibility enables connections between producers, businesses, and customers from almost everywhere. The fact of being one of the most popular transportation mode within the freight industry as can be observed in Figure 932, positions the road transportation industry as one of the main sources of greenhouse gases and airpollutants as it was mentioned before. For this reason, in the short-term manufacturers are also required to have an agile approach to develop engines in compliance with the new emissions standards otherwise their business operation might be at stake.
30 Roland Burger Study (2018, February). “Automated Trucks – The next big disruptor in the automotive industry?”
32 Due to lack of data available for China, Japan and India for the year of 2016. It was only considered the values until 2016
Figure 9: Inland Freight Transportation by transport mode and region in million ton-kilometer
ABVOLVO COMPANY REPORT
The oil prices affect manufacturers’ performance considering they represent a major role in customers’ margins. After 2014, oil prices have registered values near half of those registered in the four years before. This decrease was related with the oversupply verified in the market, however in November 2016 OPEC producers agreed in cut the production33 levels for the first time eight years in effort to boost the oil prices
which will be extend at least until end of 2018. If in one hand the road freight companies benefit from the low oil prices allowing them to reduce costs and to be more competitive against other transport modes such as rail freight, in the other hand a slowdown from Oil & Gas activity would also affect the level of activity in the road freight transportation.
• Customer’s preferences
The industry’s customer preferences start all on the same ground despite being a diversified base composed by small and fragmented customers. Customers are looking for vehicles easy to operate and on which they can rely on, regarding its uptime-downtime ratio. Beyond this, preferences will change mainly on the region of the world the customer operates:
- Premium: From one side there are the premium customers who have high expectations on
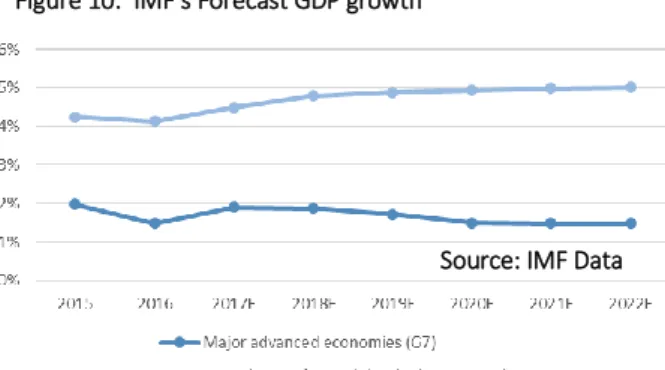
the product, seeking for premium features that enable them to connect trucks to data networks, taking advantage from telematics-based fleet management services, to improve performance consumption and reducing truck’s downtime. These features will also help customers to optimize routes and maximizing their utilized capacity. Despite the fact of the manufactures could charge a higher price for these premium features, they will also be reducing the demand once they are providing customers conditions to have a better maintenance and higher uptime period. This type of customer is presented in the Triad region which is composed by North America, Europe, and Japan. Even though the International Monetary Fund’s expectations for the GDP growth are positive they are still low when compared to other regions of the world. The competition in this market is dominated by European and North American players.
- Low cost and value: On the other hand, there is low cost and value customers who share
the same preference for the reliability and uptime-downtime ratio with the premium customers but with a completely different price sensitiveness. Here the customers are looking for a truck that costs 2 or 3 times less than a premium one. This type of customer is mainly located in emerging countries, which led them to opt for trucks with low features adapted to their countries’ imperfect infrastructure. Although this type of truck presents a lower breakdown
33 Reuters Staff. “OPEC reaches first deal to cut oil output since 2008”, Reuters, 26 November 2016, Web 30 Dec 2017
Figure 10: IMF’s Forecast GDP growth
ABVOLVO COMPANY REPORT
reliability when compared with premium ones, the current service network coverage from “Triad” manufacturers in these countries does not answer quick enough to trucks’ breakdowns to compensate for a lower downtime period when compared with local manufacturers.
As it can be observed in Figure 11, China positions itself as the largest market in the world accounting for more than 40% and together with India they represent more than half of the global demand for heavy-duty trucks. Considering these two countries belong to the group that IMF’s expects to growth at a higher rate for following years, they become strategic markets where every manufacturer wants to be. The Chinese market, historically, has been almost entirely composed by low and value trucks supplied by local manufacturers with only 3% of the sales regarding premium
sales34. Another issue from the Chinese market is its current overcapacity which is creating pressure to drive
trucks’ prices down. Between 2007 and 2014 the average utilized capacity was 43% which is conducting Chinese manufacturers to consider alternatives such as adopting an internationalization strategy.
Europe
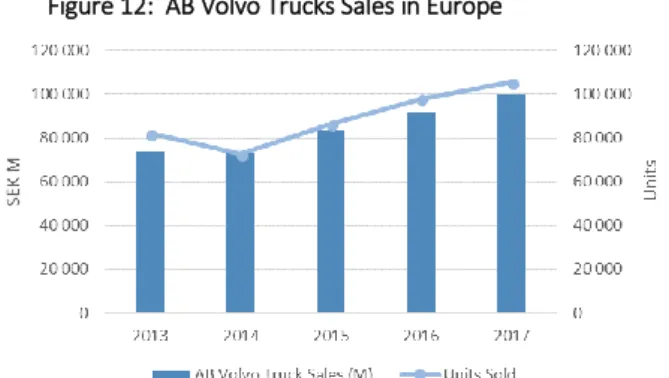
The European truck segment has been the company’s main revenue driver, representing 30% of the overall revenue. The company’s strategy for the region involves marketing trucks under two different brands: Volvo Trucks and Renault Trucks. As can been seen on the Figure 12, the segment’s performance has been stable over the years with a moderate growth trend from 2015 to 2017.
As the main market of the “Triad” region, the European market has been disputed between five manufacturers which includes AB Volvo, Daimler, Volkswagen, Iveco and DAF as illustrated in the Figure 13. The European market of heavy trucks have been led by Volkswagen which operates under Scania and MAN brands and was responsible for more than 30% of new registrations over the last three years. In 2016, Volvo saw its market share increase from 21% to 25% overcoming Daimler as the
second largest. The fact of being a premium customer region, European market have shown few
34 McKinsey & Company, (2016, May) “Gearing up for growth: Futures perspectives on the global truck market”
Figure 11: Global Demand for HD Trucks 2016
Figure 12: AB Volvo Trucks Sales in Europe
Figure 13: European HD Trucks by Manufacturer
Source: Frost & Sullivan, McKinsey&Company, Analyst’s estimates
ABVOLVO COMPANY REPORT
Source: AB Volvo Report, Eurostat
opportunities for foreign manufactures to step in, with the exception to the American Paccar who throughout the acquisition of the Dutch DAF in 1996, now holds a 15% stake of the market.
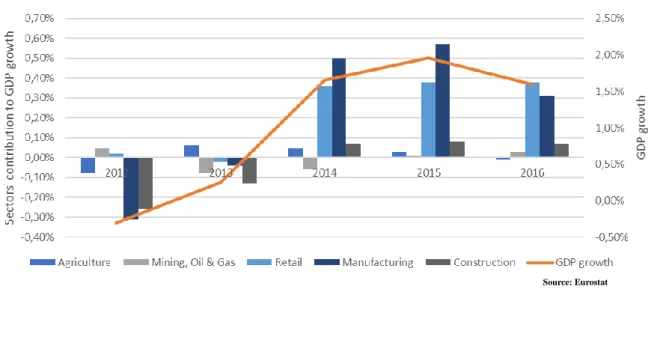
The Figure 14 gives an overview of European market demand for freight transportation in the recent years which has presented a stable trend having the Retail sector as the largest one, and the Manufacturing sector responsible for 28% and 18% of the demand, respectively. The transport dependent sectors have contributed in different ways towards the GDP growth over the same period. As expected only after the stagnation period in 2012-2013 where the GDP fell by 0,3%, these sectors were able to contribute positively to the GDP growth having the Manufacturing and Retail sector as those that benefit the most from the economic recovery. Europe has been showing strong signals of economic recovery having registered, in 2017, its fourth consecutive year of GDP growth. The road freight transportation industry has been enjoying from these favorable conditions hitting an all-time high of ton-kilometer transported35
and the number of the new trucks registrations in the European has followed this trend showing a moderate grow
th
in 2015 and 2016.35 A tonne-kilometre (or tonne-mile) is the standard unit of measure for freight activity and is the transport of 1 t of cargo (which typically includes pallets and packaging as
well as products) over 1 km.
Figure 16: EU GDP growth and respective segregation by sector
Source: Eurostat
Figure 15 EU Road Freight and Trucks Registrations Figure 14 EU Road Freight Transportation by Sector
ABVOLVO COMPANY REPORT
Besides the overall economy’s health, the sectors of Agriculture and Mining, Oil & Gas are also dependent on the price of the commodities they produce and sell, which as tradable commodities are determined by the supply and demand. Agriculture and Mining sectors whose prices have been decreasing trend since 201136,
like the Oil prices mentioned above. For the next 5 years
,
the IMF expects the European Union to grow at a rate higher of 2.1 percentage points in 2018 and decreasing to 1.8 in 2019 and 2020 and then to 1.7 in 2021 and 202237. It is expected Manufacturing and Retail sectors to keep their moderate grow aligned with theGDP growth while the Construction sector is expected to grow its contribution boosted by the investment in the European Union strategy to expand its transportation network.
North America
The North American region is predominantly defined by the performance in the United States market. The company’s strategy for this market of operating under to brands, Volvo and Mack Trucks which have resulted in a stable performance over
the
course of the last five years with the exception for the year of 2015, where the company achieved more than SEK 73 billion in sales. The combination of historical low fuel prices, with the Fed Fund Rate almost near zero, 0,25%, and the GDP growing arate higher than 2% for the fourth time in six years, have impacted positively the number of new trucks registrations in the country.
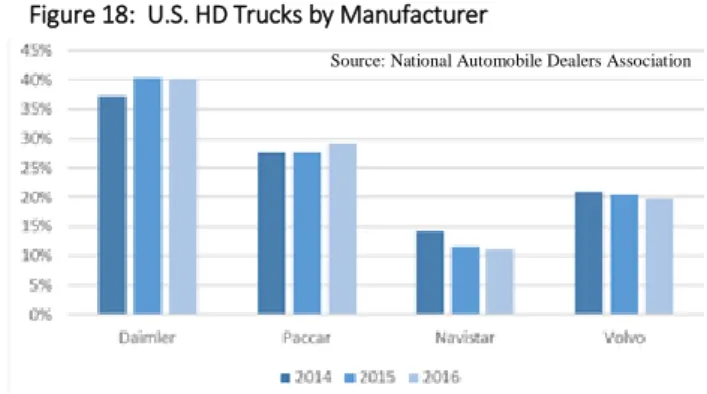
The U.S heavy-duty truck market for its turn is composed by European and American manufacturers. In 2016, Daimler, maintained its position as the largest manufacturer marketing its trucks under the Freightliner and Western Star brands summing up 40% of the market, followed by the American manufacturer Paccar with 29% with the market. AB Volvo comes in the third place achieving 18% market share with its two brands and it is
followed by Navistar which comes in the fourth place having registered a decline of 3% in the last three years. As the European case, the Asian manufacturers have low presence in the American heavy-duty market which is dominated by American and European manufacturers. The largest manufacturer in Europe, Volkswagen Group, unlikely its European peers had no commercial presence in the U.S market until 2017 when acquired a 16,6% stake in the American Navistar which might indicate a first step of a possible full merger in the future however it is not expected to affect significantly the market share in the short-term period.
37 IMF Data Mapper: World Economic Outlook (2017, October);
Figure 24: U.S. HD Trucks by Manufacturer
Figure 25: U.S. Road Freight Transportation by Sector Table 2: U.S. HD New Trucks Registrations
Figure 17: AB Volvo Trucks Sales in North America
Figure 18: U.S. HD Trucks by Manufacturer
ABVOLVO COMPANY REPORT
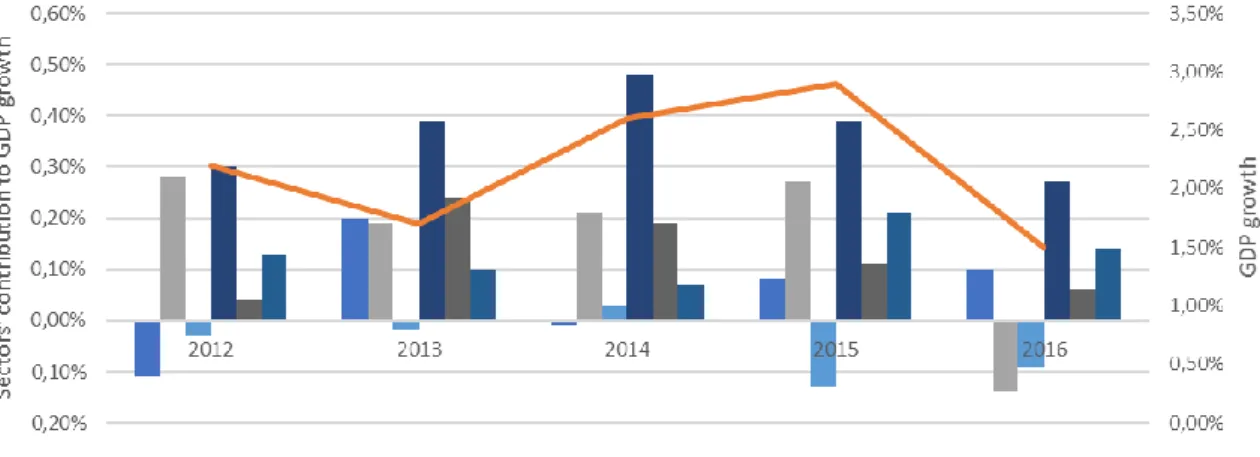
Figure 21: U.S. GDP growth and respective segregation by sector
The cargo transported within the U.S soil has presented a constant distribution among the different transport dependent sectors being the Oil, Gas & Chemical sector the one responsible for the largest portion with 21% of the overall freight, as it can be concluded from Figure 19. The U.S economy had a slowdown in its grow
th
from 2,9% in 2015 to 1,5% in 2016 mainly driven by the poor performance from the Oil & Gas and Mining sector justified by the low prices mentioned above on these industries.However, in 2017 the economy expanded to 2,6% growth rate having the U.S road freight transportation activity benefited from that, growing at a higher rate than 2015-2016 period as can be observed through the Truck Tonnage Index, which represents the gross tonnage of freight transported by truck in a given month, on Figure 20.
Across the last five years, the two sectors that have contributed the most to the GDP growth were the Retail and the Oil, Gas & Chemical sectors having experienced a contraction in 2016 driven by the decline in oil prices. During this period with a smaller impact, Manufacturing and Construction sectors registered positive contribution over the period. The IMF expects the U.S economy to grow 2,3% in 2018 maintaining a growth rate above the 1,7% in the following year until 2023. The Manufacturing and Retail sectors are expected to continue benefiting from these favorable conditions the Oil & Gas is also expected to recover aligned with the positive trend the oil prices have been following in 2018. The announced infrastructure plan by the President Donald Trump earlier this year is expected to contribute positively to the construction sector
Figure 24: U.S. HD Trucks by Manufacturer Figure 24: U.S. HD Trucks by Manufacturer Figure 19: U.S. Road Freight Transportation/Sector
Figure 20: U.S. Truck Tonnage Index Sector
Source: U.S. Bureau of Transportation Statistics
Source: U.S. Bureau of Transportation Statistics
ABVOLVO COMPANY REPORT
Source: AB Volvo Report, Euromonitor
Asia
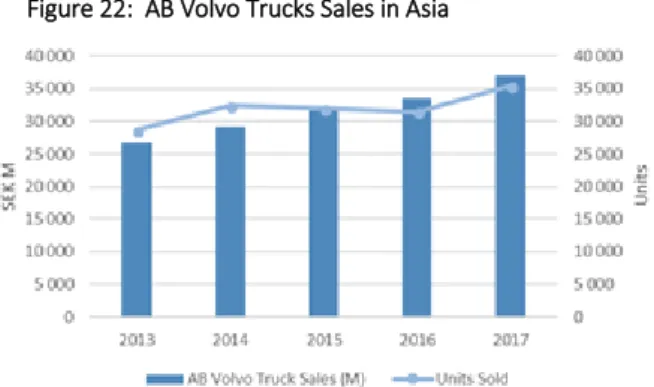
The Asian region represents the third largest market within the Truck segment and has Japan as its main market. Unlikely the previous regions the company operates only under the one brand, UD Truck. The company’s performance has been following a positive behavior, since a fall in 2013. The Japanese market completes the “Triad” market and it has the particularity of not being led by a European manufacturer.
The medium and heavy truck segment has not changed significantly over the last three years. Toyota Group comes as the largest manufacturer in the country through its subsidiary Hino Motors who holds 56% of the market followed by the joint venture Mitsubishi FUSO which is 90% owned by Daimler AG and the remaining by Mitsubishi. In the third place comes Volvo under its Asian brand UD trucks with 12% of the market.
The Japanese economy has shown moderate growth rates of
1% in 2016 and 1,6% in 2017 after the stagnation in 2014 which occurred two years after the 2011 recession38. The Industrial Production index has been falling
since 2014 however it seems to maintain the positive trend initiated in the beginning of 2016. The Japan road freight activity has been showing a positive trend, expanding over the past four years and the New Truck Registration volume seemed to stabilize over last three years after having verified an increase of approximately 15.000 new truck registrations in 2014. The IMF expects the Japanese economy to slow down its growth to 1.2 and 0.9 in 2018 and 2019, respectively.
38 IMF Data Mapper Data Set: World Economic Outlook (October 2017)
Figure 23: Japan MD & HD Trucks by Manufacturer
Source: Japan Automobile Manufacturers Association, Analyst’s estimates Figure 22: AB Volvo Trucks Sales in Asia
ABVOLVO COMPANY REPORT
Construction Equipment
The company construction equipment segment manufacturers and sells equipment for construction, mining, agriculture under three different brands: Volvo, Terex
,
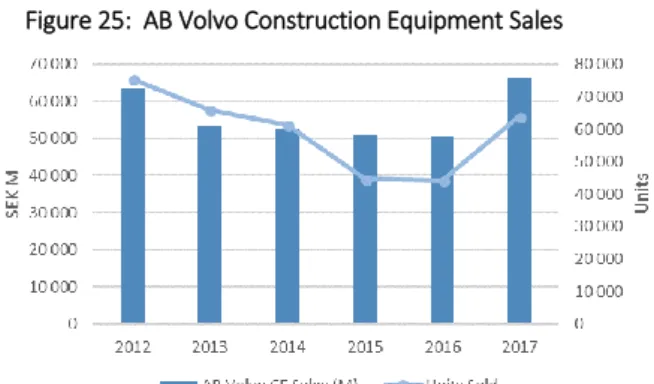
and SDLG. SDLG is a joint-venture created in 2006 and 70% owned by the Volvo Group and follows the accounting principle of consolidation method. This strategic partnership arose to complement Volvo CE’s strategy of selling high-end products with low to medium-end equipment aiming to target the Chinese market.As it can be observed in the Figure 25, the performance of this division has been through a stagnated period between 2013 to 2016 along with the tough market conditions verified worldwide as illustrated by the KHL Group39 in the Figure 26. The year of
2017 was marked by a global recovery verified in all regions of the world having Europe expanded its growth to 16% and Asia increased its sales in more than 60%. Together, these two regions have been historically division’s main markets representing together near 70% of its sales, as it will be described later in this chapter.
The construction equipment segment is primarily driven by demographic trends such as population growth and urbanization rates which will require from cities an adequate response in terms of public infrastructures and real estate. The World Bank expects urbanization rates to grow across the globe having China and India as the countries where largest growth will be
registered with increases of 19 and 17 percentage points, respectively, until 205040. Following these
demographic trends, in the long-run it is expected the demand for the construction sector in emerging markets to be constant and high to accommodate and answer all the needs from countries with a poor infrastructure and high growing population. Whereas, in developed markets the demand will be more linked to governments assessment of the existing infrastructure gap and its priority in their political strategy, thus is expected the demand to be low with sporadic increases. The construction equipment market is a highly fragmented, see Figure 27, where 50% of the global sales is concentrated in a group of eight manufacturers who have their operations spread over the world. Volvo Construction Equipment, encompassing its own three brands was able to maintain an average of market share of 4,7% over the last three years, positioning itself as the fifth largest manufacturer in the world in 2016.
39 Hayes, Mike (2017, April). Yellow Table. International Construction Vol.56 23-27 40 World Bank Data
Figure 33: Largest Players Global CE Market Figure 25: AB Volvo Construction Equipment Sales
Figure 26: Global Construction Equipment Market
ABVOLVO COMPANY REPORT Construction Equipment 2012 2013 2014 2015 2016 2017 Europe Sales SEK M 16 518 16 356 17 215 17 732 19 739 22 977 % of CE Sales 26% 31% 33% 35% 39% 35% Units Sold 12 545 13 522 14 174 12 539 14 700 17 519
Europe
A strategy based on a multi-brand strategy, with Volvo and Terex, enable the company to experience a four-year growing period after a stagnation year in 2013. During 2015 and 2016,
the region was the main market within the segment. The European construction equipment industry, along with the real estate sector, found its historical high in 2007 achieving 210.000 units sold.
The following two years the construction equipment sales decreased more than 60% representing in this case a 10-year low. Since 2011 the industry has remained stable with sales approximately 120.000 units, almost half of the value from 2007. According to the Committee for European Construction Equipment41, the construction sector in Europe
shown a modest growth of 2% in 2016 following a 1,8% verified in 2015. The residential construction rose in all countries driven by the new building activity
which summed up a 3,9% overall. The non-residential construction had a positive variation of 1,5% after a series of 7 years with negative or null grow. The civil engineering sector suffered a 1% decline mainly driven by the reduction of EU funding to the Eastern countries whose activity decrease 9%. These indicators were reflected positively in the construction equipment sector that experienced a double-digit growth of 12% and reaching a 5-year high of 145.000 unit sold. The largest contributors to the construction equipment sales were Germany, United Kingdom, and France with a market share of 25%, 14%
,
and 14% respectively42. TheCECE’s expectations on the construction sector for the period 2018 and 2019 are positive with a slowdown
i
n the residential and non-residential construction. Large infrastructure projects which are taking place in Europe such as the €270 billion German “2030 Federal Transport Infrastructure Plan” to renew and expand country’s existing transport network are expected to drive the civil engineering sector to an accelerated growth of 1,8%, 2,9% and 3,2% in the next three years.41,19 CECE Annual Economic Report 2017, Committee for European Construction Equipment
Table 2: AB Volvo Construction Equipment Europe Sales
Figure 33: Largest Players Global CE Market Figure 28: Construction Equipment European Market
ABVOLVO COMPANY REPORT Construction Equipment 2012 2013 2014 2015 2016 2017 Asia Sales SEK M 27 033 21 911 18 458 16 424 15 765 25 058 % of CE Sales 43% 41% 35% 32% 31% 38% Units Sold 49 263 44 892 33 648 22 339 21 072 36 254
Asia
After experiencing a downturn period between 2013 to 2016 where the sales drop 42%, the region was able to recovery and increase more than 63% its sales, achieving a 5-year high of
SEK 25.1 billion. The segment’s performance was mainly affected by the contraction registered in China. The Chinese construction sector has been slowing down since
2011 as result of an excess of supply on the residential sector which experienced a contraction in 2014, bringing the whole sector to growth below a double-digit growth rate in the following two years. This deacceleration was reflected on the construction equipment market which registered a decrease in the total units sold from 295.000 to 100.000 between 2012 to 2016.
However, the Chinese construction sector has been showing positive signals of recovery since 2015 having the Residential and Construction sector experiencing a 7,7% growth, in 2016, and it is expected to expand over the next year, and boosted the investment in public infrastructure and improvements in customer and investor confidence resulting from the governmental investment plans such as 13th Five-year, which expected to
totalize a RMB 15 trillion spending for transportation and infrastructure projects until 2020.
Table 3: AB Volvo Construction Equipment Asia Sales
Figure 30: China Construction Sector Growth Figure 29: Construction Equipment Chinese Market
ABVOLVO COMPANY REPORT
Minority Joint Ventures
In order to capture value from the Asian growth driven by Chinese and Indian economies, Volvo set a strategy based on holding minorities stakes in joint ventures to grow its Truck business in both countries. The strategy behind of holding minority stake in JV is related with the fact of Volvo’s expertise and product portfolio being not oriented to low-end markets. The following partnerships are expected, on one hand, to enable Volvo to skip stages concerning acquiring experience in emerging markets, knowledge of frugal engineering and access to a wide service network service, and on the other hand to allow partners to take advantages from Volvo global distribution network and its advanced technology which will help them to anticipate issues regarding standard emissions limits which normally are behind European and North American markets.
• VE Commercial Vehicles (VECV)
Created in 2008, Volvo Group paid a total of SEK 1,8 billion for a 45,6% stake in the partnership made with the Indian manufacturer Eicher Motors, one of the country’s leaders in medium-duty trucks43.The primarily goal of this partnership were to consolidate
Eicher position within the medium-duty market, to gain market share in the heavy-duty market with a portfolio renewal and to expand the production capacity from by 50% of units produced per year.
Across the last five years the VECV has registered a growth trajectory which allowed to increase its units sold by 21% resulting from its investing in production capacity. The joint-venture intents to keep investing in capex with an investment plan of INR 4.25 billion per year, SEK 552 million44, in the following years. Representing
near 11% of the trucks sold globally, the Indian market is concentrated in three major manufacturers Tata Motors, Ashok Leyland and VECV that hold more than 95%45 of the total market.
Volvo positions as the only foreign manufacturer with significant
presence although jointly. Expecting a GDP growth of 7,0% 2018 accordingly to the World Bank, India’s economy expects a further push from the construction sector after the approval of the Bharatmala project46
which consists in building 83,000 km in road and a total spending of SEK 912 billion47 until 2022. This
improvement in country’s infrastructure shows a clear strategy towards road transportation from the Indian
43 AB Volvo’s Press Release. "Volvo signs final agreement with Indian vehicle manufacturer Eicher.” Volvo. 26 May 2008. Web 30 Dec 17 44 Converted as at 30 December 2017 rate according to OANDA.com
45 Society Indian Automobile Manufacturers based on CV News “2016-2017, Heavy Commercial Vehicle Sales – A round up” CV News 16 April 2017. Web 30 Dec 17 46 ET Bureau. "Modi govt approves mega Rs 7-lakh crore project to develop 83,000 km highways in 5 years.” The Economics Times. 25 Oct 2017. Web 30 Dec 17 47 Converted as at 30 December 2017 rate according to OANDA.com
Figure 31: VECV Sales
Figure 32: India MD & HD Trucks by Manufacturer
ABVOLVO COMPANY REPORT
government. The first impact of this strategy is expected to be reflected as an increase in the construction activity demanding more from the road freight transportation. Then with a more extensive road network it is expected an increase in trade between the different regions of the country promoting in this way a larger use of heavy-trucks. Finally, this infrastructure improvement might represent an opportunity for higher value trucks once the level of the country’s infrastructure will improve resulting in different needs from the clients. Despite this effect could take some time to be verified, VECV is well positioned to take advantage from it.
• Dongfeng Commercial Vehicles (DFCV)
In 2015, AB Volvo completed the acquisition of 45% of the commercial vehicles subsidiary of Dongfeng Motor Group which kept the remaining 55%48 by paying SEK 5,6 billion. The initial
priorities were to strengthen Chinese market presence and technological leadership, accelerating the process of exportation and improve its aftermarket services and solution. Nevertheless, the financial data available regarding this joint-venture is scare and with low-level of detail, it is possible to understand the
potential of this partnership. In the first three years the joint-venture registered an interesting sales levels of SEK 34 billion, 37 billion and 50 billion in 2015, 2016 and 2017, respectively. The year of 2017 was the first year where the venture was profitable achieving positive operating margin of 3% recovering from two consecutive reporting periods of negative operating margins of -3% and -1% in 2015 and 2016. This might indicate the break-even point lies between a level of sales between SEK 37 billion and 50 billion. Although, the Chinese market is still dominated by low-value segment as it was described earlier, the consulting firm Bain Company49 identified a trend for an increasing number of customers, one in five, who are considering
upgrading to higher-value segment truck. The consulting firms calculates the trend will drive the premium segment to double until 2022. Another factor to bear in mind regarding the Chinese market is the “One Belt One Road” plan proposed by the President Xi Jinping in 2013 to create a network of railways, roads, pipelines to link China to the remaining parts of the Asian continent. One of the initiatives encompassed in the plan is the “Silk Road Economic Belt”50 which envisioned three road routes connecting China to Europe, to Persian
Gulf and to West Asia. Combined these two factors represent a significant opportunity for DFCV, which is well positioned to capture more value by being capable of mixing both firms’ know-how to supply the existent customer-base as the potential trend for higher-value trucks.
48 AB Volvo’s Press Release. "Volvo completes the acquisition of 45% of Dongfeng Commercial Vehicles.” Volvo. 1 May 2015. Web 30 Dec 17 49 Gnam, Jorg et others (2017, June), “China's Truck Market: New Opportunities for Europeans” Bain & Company Insights
50 Jinchen, Tian (2017, July), “One Belt One Road: Connecting China around the World” McKinsey & Company Our Insight
Figure 43: DFCV Sales