Inácio Barbosa Borges1, Omar Cruz Rocha 2, Juaci Vitória Malaquias 3, Marcelo Fagioli 4, Marcos Aurélio Carolino de Sá5, Antônio Fernando Guerra6 (Received: June 27, 2018; accepted: October 17, 2018)
ABSTRACT: The cover plants affects soil spatial variability interfering with soil moisture and density, leading to doubts about the need for calibration of the neutron probe for different management systems. The objective of this study was to evaluate the Model Identity Method in the verification of equality of linear regressions resulting from the calibration of a neutron probe for different layers, as a function of signalgrass management as a cover crop between rows of soil coffee crop in the Brazilian Central Cerrado. Aluminum tubes were installed to access the probe and two saturation basins were built in a coffee area, irrigated by a central pivot, in an Oxisol, with two management systems, T (Traditional with bare soil) and Sg (Signalgrass in the row). Samples were taken at depths of 0-0.20; 0.20-0.40; 0.40-0.60; and 0.60-0.80 m for determination of gravimetric moisture and density, and the volumetric moisture was determined to follow the drying of the soil. Concomitantly, measurements were taken with the neutron probe in these layers. Two calibration curves were constructed for each layer, which were compared by the above method. It was observed that treatment Sg yielded differences in soil water storage in the 0.20-0.40 m layer, differing from treatment T. The statistical method allowed the observation of equality of regressions between treatments Sg and T at depths 0-0.20, 0.40-0.60, and 0.60-0.80 m; it also showed the need for different regression curves per layer, besides justifying the need for neutron probe calibration for each specific local condition.
Index terms: Coffea arabica, soil moisture, management systems, sustainability, cover crops.
IDENTIDADE DE MODELOS GERADOS NA CALIBRAÇÃO DA SONDA DE NÊUTRONS EM LATOSSOLO CULTIVADO COM CAFEEIRO E BRAQUIÁRIA
RESUMO: As plantas de cobertura afetam a variabilidade espacial do solo interferindo na umidade e densidade do solo, levando a dúvidas sobre a necessidade de calibração da sonda de nêutrons para diferentes sistemas de manejo. O objetivo deste trabalho foi avaliar o Método da Identidade de Modelos na verificação de igualdade de regressões lineares resultantes da calibração de uma sonda de nêutrons para diferentes camadas do solo, em função do manejo da braquiária como planta de cobertura nas entrelinhas da cultura do café no Cerrado Central do Brasil. Foram instalados tubos de alumínio para acesso da sonda e construiu-se duas bacias de saturação em área de café, irrigada por pivô central, em um Latossolo Vermelho distrófico, com dois sistemas de manejo, sendo T (Tradicional com solo nu) e B (Braquiária na entrelinha). Retirou-se amostras nas profundidades 0-0,20; 0,20-0,40; 0,40-0,60; e 0,60-0,80 m para determinação propriedades físico-hídricas e acompanhamento da secagem do solo, concomitantemente tomou-se medidas de leitura com a sonda de nêutrons nestas camadas. Construiu-se duas curvas de calibração para cada camada, as quais foram comparadas pelo método citado. Observou-se que o tratamento B proporcionou diferenças no armazenamento de água no solo na camada 0,20-0,40 m, diferenciando-se do tratamento T. O método estatístico: permitiu a observação de igualdade das regressões entre os tratamentos B e T nas profundidades 0-0,20, 0,40-0,60, e 0,60-0,80 m; mostrou a necessidade de diferentes curvas de regressão por camada; justificou a necessidade da calibração da sonda de nêutrons para cada condição local específica.
Termos para indexação: Coffea arabica, umidade do solo, sistemas de manejo, sustentabilidade, plantas de cobertura.
1 INTRODUCTION
The sustainability of agricultural production can be improved through the use of cover crops. Variations in exploitation form and depth of the root system of plants used in covers and their capacity of biomass production, in relation to the main crop, allow the recycling of nutrients,
1Instituto Federal do Norte de Minas Gerais/IFNMG - Cx. P. 05 - Rodovia MG 202, Km 407, s/n - Zona Rural Arinos - 38.680-000-
Arinos - MG - [email protected]
2,6Embrapa Café - Parque Estação Biológica/PqEB - Av. w3 Norte (final) - 70.770-901 - Brasília - DF - [email protected],
3,5Embrapa Cerrados - Rodovia BR-020, Km 18 - Cx. P. 08223 - 73.310-970 - Planaltina - DF - [email protected],
4 Faculdade de Agronomia e Medicina Veterinária/UnB - Campus Darcy Ribeiro - ICC-Sul - Brasília - DF - 70.297- 400 -
protection against water erosion, besides hindering surface runoff and favoring soil water infiltration by the opening of drainage canals when their roots die (CARDOSO et al., 2012), and by the improvement in structural quality (CALONEGO; BORGHI; CRUSCIOL, 2011; LAL, 2015) and biological activity (MBUTHIA et al., 2015 ). In addition, it contributes to a reduction in water
several models are observed. This procedure has been widely used in forestry engineering due to the large number of models generated for administrative planning and prediction of yield capacity and production (ROVEDA et al., 2016). Thus, this procedure could be used in the comparison of models that describe the behavior of the calibration of a neutron probe under different types of soil and / or handling.
Therefore, the objective of this study is to evaluate the Model Identity Method in the verification of equality of linear regressions resulting from neutron probe calibration for different soil layers, as a function of signalgrass management as a cover crop between coffee rows in the Brazilian Central Cerrado.
2 MATERIAL AND METHODS
The experiment was set at Embrapa Cerrados, in Planaltina, Federal District, Brazil (15°35’42” S, 47°43’51” W and 1009 m). The climate of the region is CWh1, according to the Koppen classification, with an annual average rainfall of 1,460 mm and average temperature of 21.3ºC (ROCHA et al., 2014) with a large variation of precipitation over the months of the year. The months of May to September are considered the dry season and present a historical cumulative average of 67 mm and from October to April the wet season with a cumulative historical average of 1400 mm (CARDOSO; MARCUZZO; BARROS, 2014).
The soil of the experimental area is classified as an Oxisol (LVd), of clayey texture, irrigated by a central pivot irrigation system, cultivated with signalgrass ( Brachiaria decumbens Stapf) from January 2000 until December 2007 when coffee (Coffea arabica L.) was planted. The cultivar ‘Catuaí vermelho IAC 144’ coffee (Coffea arabica L.) was planted, with a 3.50m spacing between rows per 0.70m between plants in the row, with 120 g of triple superphosphate were added, as well as 50 g of magnesium thermophosphate (Yoorin®) and 24.5 g of fritted trace elements (FTE) per well. Liming was performed with 2 mg ha-1 dolomitic limestone, in order to raise base saturation to 50%. In the years after planting, the nutritional management of coffee trees was carried out according to Guerra et al. (2008).
In the irrigation strategy of coffee trees, the controlled water deficit was used to standardize flowering (GUERRA et al., 2007), with a management criterion based on the monitoring of soil water content, according to Rocha et al. evaporation and thermal oscillation (MATORANO
et al., 2009), with a direct positive effect on soil moisture (BORGES et al., 2014; CARDOSO et al., 2012; SANTOS et al., 2010).
According to Balbinot Junior; Santos; Yokoyama (2017), signalgrass, a plant belonging to the genus Brachiaria spp., can improve soil quality from the direct action of its roots in the structure, improving infiltration, water retention, oxygen flow and reducing soil resistance to penetration of crop roots. Adaptability to local conditions, adequate architecture to the coffee production system, perenniality, ease of natural resowing, rusticity, ease of maintenance and resistance to mechanization are characteristics that qualify signalgrass as a cover crop (BULISANI et al., 1993; FIRTH; WILSON, 1995), which can be used between coffee rows.
Soil properties such as texture, structure, porosity and organic matter determine its adsorption and capillarity characteristics, while rainfall, solar radiation, temperature, crop evapotranspiration, leaf area index, plant density and soil management systems affect moisture and drying periods (MARTORANO et al., 2009). Cover plants increase microbiological activity, nutrient cycling (MBUTHIA et al., 2015) and soil moisture directly influencing plant development of coffee; therefore, it is an indispensable information to evaluate the contribution of different management systems.
Among the methodologies used in research to monitor soil water content, the use of the Neutron Probe in both irrigated and non-irrigated areas is considered as the standard method. Although the use of this equipment is repeatedly addressed by several authors (BORGES et al., 2014; MENEZES et al., 2013; SANTOS et al., 2010), it is common knowledge that calibration is a fundamental part of its use (FALLEIROS et al., 1993; KODIKARA et al., 2014). The calibration curve, however, is affected by the spatial variability of the soil and by moisture and density, which result in the main causes of the dispersion of points in the curve (GREACEN, 1981). Although there is a consensus on the need for specific models for each type of soil, there is uncertainty whether different management systems alter calibration curves, as well as whether the various curves generated result in significant differences in soil water content.
The Model Identity Method proposed by REGAZZI (2003) allows to analyze the feasibility of using a single model for situations where
(2008). Two management systems were used: with Signalgrass (Sg) and Traditional (T), distributed in nine-plant plots; the five central plants were considered useful. For each useful coffee row, two parallel rows were border. Signalgrass was managed with mechanical handling when the plant reached 0.60 m average height, maintaining the crop remains in the area. In the traditional treatment, the soil was kept free of invasive plants with the aid of manual weeding, keeping the same crop remains in the respective plots.
The experimental design was in five randomized blocks in subdivided plots, in which the plot consisted of the two management systems (Sg and T) and the subplots, of the soil layers 1 (0.00 to 0.20 m), 2 (0.20 to 0.40 m), 3 (0.40 to 0.60 m) and 4 (0.60 to 0.80 m) (1, 2, 3 and 4).
In September 2014, the coffee trees were submitted to pruning, cutting the orthotropic branch 0.80 m above ground level, leaving the existing plagiotropic branches up to that height and leading one orthropic branch per plant. In May 2015, aluminum access tubes were implanted in all experimental plots, according to Kodikara et al. (2014) for soil water content monitoring, using a neutron probe (CPN 503 TDR Hydroprobe®), supplied with a 241Am/Be source of 1.85 GBq radioactive activity. Four soil monitoring layers were used, corresponding to the depths of moisture monitoring with the probe 0,10; 0.30; 0.50 and 0.70 m, respectively.
For probe calibration, a 4-m2 saturation basin formed by an zinc plate (0.30 m x 8m), installed in the form of a square nailed to the soil, was constructed in representative plots of each management system, keeping 0.10 m buried. The basins received a sufficient water volume to saturate the soil profile up to 1.00 m deep. After the complete saturation of the soil profile, the basin was covered with a plastic canvas for 24 hours to control evaporation and deformed soil samples immediately underwent natural drying, from the determination of gravimetric moisture by the greenhouse method and then, with soil density, the volumetric moisture (Empresa Brasileira de Pesquisa Agropecuária - EMBRAPA, 2011). A total of five replicates at the depths of the probe reading (0.10; 0.30; 0.50 and 0.70 m), on seven different dates, between the months of June and September, period without rainfall. Subsequently, at each sampling, readings were taken with the use of the neutron probe. The relative counting (RC) of neutrons in the soil was obtained according to
Kodikara et al. (2014), from the division of the soil reading values obtained in the access tubes, by the counting obtained inside the probe head housing.
The models for describing the soil moisture variation for each layer, as a function of the management system, were obtained by correlating the relative counting (RC) with the volumetric moisture (θ).
In order to analyze the chemical attributes and physical and water properties of the soil, deformed and undeformed samples, respectively, were collected, in duplicate in the projection of the crown of the coffee trees in each experimental plot. With the deformed samples, the particle density was analyzed by the volumetric flask method and ethyl alcohol (EMBRAPA, 2011). The undeformed samples, collected in rings (50 mm x 51 mm), were used to determine soil density (SD) and the water retention capacity by the Richards chamber method (EMBRAPA, 2011) at water tensions corresponding to 3, 6, 10, 33, 60, 100 and 1,500 kPa. The experimental points of the retention curves were adjusted using the van Genuchten equation (1980), using the restriction proposed by Mualem (1986). The SWRC (3.00 beta) program, developed by Dourado-Neto et al. (2001), was used to adjust the retention curves.
The total water availability (TWA, in mm cm-1) of the soil was obtained from the following expression: TWA= ((U6 – U1,500)/10)SD, where, U6 and U1,500 correspond to the gravimetric moisture expressed as % equivalent to matrix tensions of 6 and 1,500 kPa determined by the Richards chamber method; SD corresponds to the soil density, in mg m-3.
A total of eight linear models resulting from the relation between the Relative Counting (x) and the Average Volumetric Humidity (y) were generated for different management systems and depths, given by:
yi = β + b1x1i + b2x2i +... + bk xki +ei where,
yi : i-th value of the response variable, i=1,2, ... , N observationss;
xki : i-th value of k-th explanatory variable, k=1,2, ... , K variables;
bk : linear model parameter; ei : random errors.
In the linear regression model, the minimum square estimation method can range between ordinary, weighted and generalized, according to the assumptions that residue can assume. In this study, from the verification of the assumptions of residue linearity, normality, homogeneity and
independence, for the adjustment of the models, the Ordinary Least Squares Method was used to estimate the parameters β. The adjustment of a model by this method assumes that the mean of the residue is zero; the error variance is constant and equal to s2; the residue is independent, that is, the errors are random variables with normal distribution.
After the generation of linear regression models, the possibility of constructing a single regression model for each depth was tested, independently of the management system. Thus, a test was applied to verify the equality of two linear regressions, called Model Identity Method (REGAZZI, 2003). With this method, models were created from each coefficient (angular and linear) and from the standard error, which were compared by the F test and as a rule of decision it was determined that if Fcal > Ftable, for a given level of significance α, we reject the hypothesis that the coefficients are the same for the two sets of observations.
In order to determine the possible differences in the calibration curves of the probe as a function of the different treatments, the total porosity was determined in the different layers from the expression: TP=1- (SD/PD) 100, where: TP is the total porosity (%); SD is the soil density (mg m-3) and PD is the particle density (2.65 mg m-3) (EMBRAPA, 2011).
Likewise, in order to understand the distribution of the root system of the coffee tree and signalgrass in the different management systems, in March 2016, soil samples were taken in the projection of the coffee crown, at the same depths of the samples collected in the saturation basins, to evaluate the distribution of the root system. Thus, a 0.10-m auger was used for collecting the soil at the depths of the probe reading. The samples were washed in running water on 0.001- and 0.0005-m sieves. The remaining impurities were collected with tweezers.
The roots were placed in a 150-mL bottle containing 70% ethyl alcohol for conservation. Subsequently, they were treated with gentian violet for 24 hours. They were then washed for the removal of the excess dye, scattered in a glass tray with a white background and water slide, and photographed with an 8-megapixel camera. The root samples were placed in an oven at 60ºC for 48 hours in paper bags and then weighed in a precision scale to obtain the root dry matter. With the obtained images, the root area, volume, length and diameter were determined using the free software Safira, version 1.1 (JORGE; SILVA, 2010).
Data were submitted to the normality test (Shapiro-Wilk 5%) and the means were compared by the Tukey test at 5% probability. All statistical analyses were performed using the free software R, version 3.2.2 (R Core Team, 2016).
3 RESULTS AND DISCUSSION
The linear regression models for the neutron probe calibration curves of the four depths and the respective studied soil layers (1 – 0.10 m or 0 to 0.20 m; 2 – 0.30 m or 0.20 to 0.40 m; 3 – 0.50 m or 0.40 to 0.60 m; and 4 – 0.70 m or 0.60 to 0.80 m), as a function of management systems (Sg – Signalgrass and T - Traditional), are found in Table 1.
Only for the linear coefficient in layer 1, there was no statistical significance, independent of the adopted management system. This result can be explained by the sphere of action of the neutron probe, which represents the range of the radiation emitted by the capsule inside the soil. The radiation sphere varies as a function of soil moisture, as reported by Falleiros et al. (1993), who observed that, under saturated soil conditions until the condition of permanent wilting point, it can range from 0.10 m to 0.20 m radius, respectively. Thus, in the reading related to layer 1, part of the radiation can exceed the soil surface as the soil moisture decreases, losing into the atmosphere, which can cause errors in probe reading, resulting in numerical values that are commonly underestimated.
According to Greacen (1981), the margin of error of the probe can be reduced with a comprehensive calibration in relation to the soil moisture range, considering from the conditions near the permanent wilting point to the saturation condition, from the moisture correlation, measured by the neutron probe, with the volumetric moisture layered by depth, as performed in this study. In fact, this comprehensive calibration method reduced the reading margin of error of the probe, both in layer 1 and in the others, as can be observed in Table 1, since the determination coefficients for both treatments (Sg and T) demonstrate that the calibration models represent the accuracy of soil moisture measurement variation with a minimum margin of error, always equal to or less than 0.015 (1.5%).
Table 2 shows the estimates of the parameters of the complete and reduced linear regression models, adjusted according to the management system and layers 1, 2, 3 and 4.
There is a significant difference in the reduced model III olnly for layer 2, indicating that the generated models, as a function of management systems, differ from each other. Thus, the Model Identity Method showed that there is a need for the use of different calibration regressions in this soil layer as a function of the soil management system to estimate the volumetric soil water content with the neutron probe.
The adjustment of the calibration models of the neutron probe for layers 1, 2, 3 and 4 in the T management system is shown in Figure 1 (a). It is observed that the Model Identity Method demonstrated efficacy in the verification of the equality of the linear regressions, since the difference between the layers is evidenced by the different positioning of the lines in the graph, without the existence of overlapping confidence intervals, proving the statistical difference conditioned by different capacities in water storage, from the superficial (1) to the deepest (4) layer. Figure 1 (b) shows that there is an increase in storage capacity in layer 2, conditioned by the presence of signalgrass, matching layer 3 with overlapping confidence intervals of these two layers.
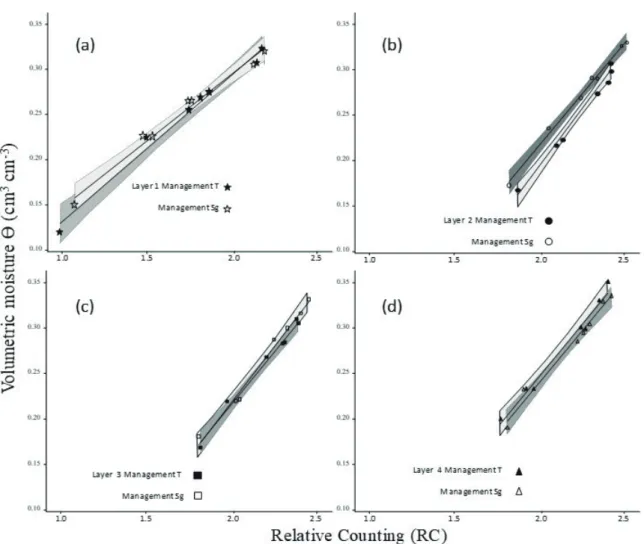
In Figure 2 (a, c and d), the adjustment of the calibration models of the neutron probe in layers 1, 3 and 4, respectively, in the Sg and T management systems, show that the differences in water storage, due to the presence of signalgrass, did not alter the positioning of the regressions of these layers. In this condition, the Model Identity
FIGURE 1 - Adjustment of the neutron probe calibration models for layers 1, 2, 3 and 4 in the Traditional (a) and Signalgrass (b) management systems.
Method demonstrated that it is possible to use a single calibration regression per layer, regardless of the management system, since there were overlapping confidence intervals within each of the different management systems, proving the applicability of the method.
In Figure 2 (b), considering only layer 2 in relation to the two management systems (T and Sg), it was observed that the regression distances resulted in overlapping confidence intervals only at the ends of the equation where the experimental error is larger, indicating that there is a difference between the regressions in this soil layer. Roveda et al. (2016) evaluated eucalyptus growth in six different locations, and observed that two models did not show statistical difference through the Model Identity method, indicating the possibility of using a single plant growth curve for these locations. For the others, as there was a statistical difference, it was concluded by using a specific model for each location.
The difference in layer 2 as a function of the management system can be attributed to the significant increase in water storage capacity in this layer since, while in the soil layers 1, 3 and 4 the presence of signalgrass changed the total soil water availability (TWA) in -0.6%, 8.8% and 4.0%, respectively (Table 3), in layer 2 this increase was higher than 11%, corroborating the significant effect observed in Table 2 and Figure 2 and the results presented by Rocha et al. (2014), who observed an increase in water readily available in a coffee area with signalgrass between rows.
FIGURE 2 - Adjustment of calibration models in management systems T and Sg for layers 1 (a), 2 (b), 3 (c) and 4 (d). TABLE 3 - Total water availability (TWA) per soil layer under different management systems between coffee rows irrigated by a central pivot.
Layers 1 2 3 4 --- mm cm-1 ---Traditional 1.61 1.62 1.71 1.74 Signalgrass 1.60 1.80 1.86 1.81 Difference -0.62% 11.11% 8.80% 4.02% 1 Layer (0-0.2 m); 2 (0.20-0.40 m); 3(0.40-0.60 m); 4(0.60-0.80 m) depth.
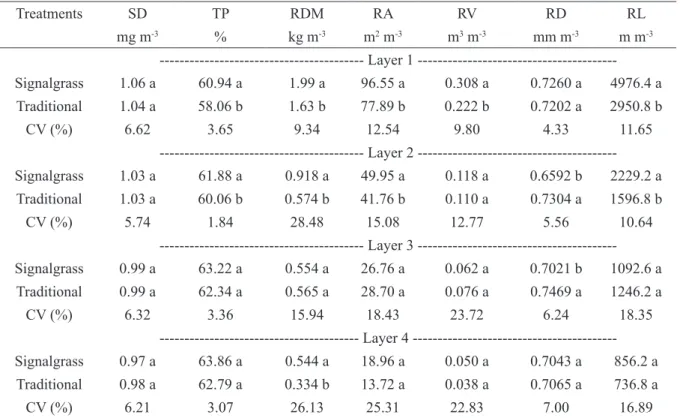
This increase in TWA can be understood observing Table 4 in layer 2 (0.20 to 0.40 m), where it was possible to verify that, although there was no significant effect on soil density (SD), the presence of signalgrass in this layer significantly altered total porosity (TP), root dry matter (RDM), root area (RA), mean root diameter (RD) and its
length (LR) by 3.0%, 59.9%, 19.6%, -10.8% and 39.6%, respectively (Table 3). In this context, this root dynamics can affect the degree of soil structure, as well as its organic matter, and signalgrass can improve soil physical and water quality (CRUSCIOL et al., 2015).
TABLE 4 - Apparent soil density (SD), Total porosity (TP), Root dry matter (RDM), Root area (RA), Root volume (RV), Root diameter (RD) and Root length (RL) of coffee and signalgrass roots in two soil management systems.
Treatments SD TP RDM RA RV RD RL mg m-3 % kg m-3 m2 m-3 m3 m-3 mm m-3 m m-3 - Layer 1 ---Signalgrass 1.06 a 60.94 a 1.99 a 96.55 a 0.308 a 0.7260 a 4976.4 a Traditional 1.04 a 58.06 b 1.63 b 77.89 b 0.222 b 0.7202 a 2950.8 b CV (%) 6.62 3.65 9.34 12.54 9.80 4.33 11.65 - Layer 2 ---Signalgrass 1.03 a 61.88 a 0.918 a 49.95 a 0.118 a 0.6592 b 2229.2 a Traditional 1.03 a 60.06 b 0.574 b 41.76 b 0.110 a 0.7304 a 1596.8 b CV (%) 5.74 1.84 28.48 15.08 12.77 5.56 10.64 - Layer 3 ---Signalgrass 0.99 a 63.22 a 0.554 a 26.76 a 0.062 a 0.7021 b 1092.6 a Traditional 0.99 a 62.34 a 0.565 a 28.70 a 0.076 a 0.7469 a 1246.2 a CV (%) 6.32 3.36 15.94 18.43 23.72 6.24 18.35 --- Layer 4 ---Signalgrass 0.97 a 63.86 a 0.544 a 18.96 a 0.050 a 0.7043 a 856.2 a Traditional 0.98 a 62.79 a 0.334 b 13.72 a 0.038 a 0.7065 a 736.8 a CV (%) 6.21 3.07 26.13 25.31 22.83 7.00 16.89
CV coefficient of variation. Means followed by the same letter in the column, by depth, do not differ by the Tukey test at 5% probability; layer 1 (0 – 0.2 m); layer 2 (0.2 – 0.4 m); layer 3(0.4 – 0.6 m); layer 4 (0.6 – 0.8 m)
Dalmago et al. (2009) observed higher water availability in the 0 to 7.5 cm layer under no-tillage system (NTS) compared to conventional planting system (CPS) in an Argissolo with 30% clay and associated this difference to the presence of matter organic matter added to the soil surface by the first system. On the other hand, in the layers below these authors observed a greater availability of water in CPS and attributed this fact to the incorporation of the straw of oats and vetch grown in the winter. More recently, it has been found that organic compounds can improve soil-water-plant relationships by modifying soil density, total porosity and soil water balance (SULTANI et al., 2007), especially at low suctions, since soil moisture content increases linearly with increasing soil organic matter content (BRAIDA et al., 2010).
In layer 2, there was a significant increase in all related measures due to signalgrass, except for mean root diameter, which showed a decrease of -9.7% and no significant in the layer 1. This trend for RD is also true for the layer 3. This may indicate a greater presence of signalgrass
roots that are more branched, thin and grow more abundantly in subsurface than coffee tree roots. While root dry matter (RDM) in the signalgrass system of layer 1 is twice that observed in layer 2, in the traditional system the same measure corresponds to triple when comparing the layers.
The other measures related to roots showed a significant increase, indicating a higher presence and root activity, which may influence soil organic matter and, consequently, a greater water availability and perhaps microrganism activity in this layer, besides the alteration of soil aggregates. Loss et al. (2011) working on a dystrophic Red Latosol with more than 60% of clay and two cultivation systems, where in one of them there was the presence of signalgrass, observed higher aggregate stability indices (weighted mean diameter and geometric mean diameter) of light organic matter and mass of stable aggregates and assign these effects to the roots of that forage. These results corroborate with the present work since these evaluated characteristics favor soil water.
On the other hand, in layer 1 (Table 4), the presence of signalgrass significantly altered TP, RDM, RA, and RL in 5.0%, 22.1%, 24.0% and 68.6%, respectively, in addition to root volume (RV) in 38.7%. However, none of the parameters presented significant differences, either in the full or in the reduced linear regression models (Table 2), indicating that the generated models do not differ from each other, as a function of management systems. This result demonstrates that the changes in the layer due to the presence of signalgrass were not sufficient to significantly alter the water availability of this layer, as can be observed in Table 3, demonstrating that there were no changes in the TWA of layer 1 due to the use of signalgrass.
In deeper layers, 3 and 4, thus more structurally preserved, the management system with signalgrass increased TWA by 8.8% and 4%, respectively, without, however, changing the significance of the calibration curves as a function of management system. The layers just below the soil surface, with lower amounts of organic matter, may present substantial aggregate formation after the entry of organic carbon and can, therefore, be responsive to the root characteristics colonizing the soil (POIRIER; ANGERS; WHALEN, 2014).
4 CONCLUSIONS
The Model Identity Method allowed the verification of equality of linear regressions resulting from neutron probe calibration in different soil layers and management systems of coffee rows in the Brazilian Central Cerrado.
The Model Identity Method allowed to identify the need for differentiated calibration curves of the neutron probe in the different soil layers and management systems.
The method justified the need for neutron probe calibration for each specific local condition.
5 REFERENCES
BALBINOT JUNIOR, A. A.; SANTOS, J. C. F. dos. H.; YOKOYAMA, A. H. Contribution of roots and shoots of Brachiaria species to soybean performance in succession. Pesquisa Agropecuária Brasileira, Brasília, v. 52, n. 8, p. 592-598, Aug. 2017.
BORGES, T. K. de. S. et al. Influência de práticas conservacionistas na umidade do solo e no cultivo do milho (Zea mays L.) em semiárido nordestino. Revista Brasileira de Ciência do solo, Viçosa, v. 38, n. 6, p. 1862-1873, Sept./Oct. 2014.
BRAIDA, J. A. et al. Teor de carbono orgânico e a susceptibilidade à compactação de um Nitossolo e um Argissolo. Revista Brasileira de Engenharia Agrícola e Ambiental, Campina Grande, v. 14, n. 2, p. 131-139, Feb. 2010.
BULISANI, E. A. et al. Adubação verde nos estados de são Paulo, Paraná, Santa Catarina e Rio Grande do Sul. In: BALTASAR, B. da Costa (Coord.). Adubação verde no Brasil. 2. ed. Rio de Janeiro: AS-PTA, 1993. P. 58-195.
CALONEGO, J. C.; BORGHI, E.; CRUSCIOL, C. A. C. Intervalo hídrico ótimo e compactação do solo com cultivo consorciado de milho e braquiária. Revista Brasileira de Ciência do Solo, Viçosa, v. 35, n. 6, p. 2183-2190, Nov./Dec. 2011.
CARDOSO, D. P. et al. Plantas de cobertura no controle das perdas de solo, água e nutrientes por erosão hídrica. Revista Brasileira de Engenharia Agrícola e Ambiental, Campina Grande, v. 16, n. 6, p. 632–638, June. 2012.
CARDOSO, M. R. D.; MARCUZZO, F. F. N.; BARROS, J. R. Classificação climática de Köppen-Geiger para o estado de Goiás e o Distrito Federal. Acta Geográfica, Boa Vista, v. 8, n. 16, p. 40-55, Jan./ Apr. 2014.
CRUSCIOL, C. A. C. et al. Improving soil fertility and crop yield in a tropical region with
palisadegrass cover crops. Agronomy Journal, Madison, v. 107, n. 6, p. 2271–2280, Nov./Dec. 2015. DOURADO NETO, D. et al. Soil water retention curve. SWRC, version 3.00. Piracicaba, 2001.
EMPRESA BRASILEIRA DE PESQUISA AGROPECUÁRIA – EMBRAPA. Manual de métodos de análise de solo. 2. ed. Rio de Janeiro: Embrapa Solos. 2011. 230 p.
FALLEIROS, M. C. et al. Neutron probe measurement of soil water content close to soil surface. Scientia Agricola, Piracicaba, v. 50, n. 3, p. 333-337, Oct./ Dec.1993.
FIRTH, D. J.; WILSON, G. P. M. Preliminary evaluation of species for use as permanent ground cover in orchards on the north coast of New South Wales. Tropical Grasslands, Brisbane, v. 29, n. 1, p. 18-27, Jan./Mar. 1995.
GREACEN, E. L. Soil water assessment by the neutron method. Adelaide: CSIRO/Division of soils, 1981. 140p.
GUERRA, A. F. et al. Sistema de produção de café irrigado: um novo enfoque. Irrigação & Tecnologia Moderna, v. 73, p. 52-61, 2007.
GUERRA, A. F. et al. Resposta do cafeeiro arábica a aplicação de fósforo. In: SIMPÓSIO BRASILEIRO DE PESQUISA EM CAFEICULTURA IRRIGADA, 10., 2008, Araguari. Resumos Expandidos... Araguari: Embrapa Café, 2008. p. 62-66.
DALMAGO, G. A. et al. Retenção e disponibilidade de água às plantas, em solo sob plantio direto e preparo convencional. Revista Brasileira de Engenharia Agrícola e Ambiental, Campina Grande, v. 13, n. sup, p. 855–864, Nov./Dec. 2009.
JORGE, L. A. de. C.; SILVA, D. J. da. C. B. Safira: manual de utilização. São Carlos, SP: Embrapa Instrumentação Agropecuária, 2010. 29p.
KODIKARA, J. et al. Soil moisture monitoring at the field scale using neutron probe. Canadian Geotechnical Journal, v. 5, n. 3, p. 332-345, 2014. LAL, R. Soil carbon sequestration and aggregation by cover cropping. Journal of Soil and Water Conservation, v. 70, n. 6, p. 329–339, Nov./Dec. 2015. LOSS, A. et al. Agregação, carbono e nitrogênio em agregados do solo sob plantio direto com integração lavourapecuária. Pesquisa Agropecuária Brasileira, Brasília, v. 46, n. 10, p. 1269-1276, Oct. 2011.
MARTORANO, L. G. et al. Indicadores da condição hídrica do solo com soja em plantio direto e preparo convencional. Revista Brasileira de Engenharia Agrícola e Ambiental, Campina Grande, v. 13, n. 4, p. 397-405, July./Aug. 2009.
MBUTHIA, L.W. et al. Long term tillage, cover crop, and fertilization effects on microbial community structure, activity: Implications for soil quality. Soil Biology and Biochemistry, v. 89, p. 24-34, Oct. 2015. MENEZES, J. A. L. de. et al. Comportamento temporal da umidade do solo sob Caatinga e solo descoberto na Bacia Experimental do Jatobá, Pernambuco. Water Resources and Irrigation Management, Cruz das Almas, v. 2, n. 1, p. 45-51, Jan./Apr. 2013.
MUALEM, Y. A catalogue of the hydraulic properties of unsaturated soils, technical report. Haifa: Israel Institute of Technology, 1974.
POIRIER, V.; ANGERS, D. A.; WHALEN, J. K. Formation of millimetric-scale aggregates and associated retention of 13C e 15N-labelled residues are greater in subsoil than topsoil. Soil Biology & Biochemistry, Québec, v. 75, p. 45-53, Aug. 2014. R Core Team. R: A language and environment for statistical computing. R Foundation for Statistical Computing, Vienna, Austria. 2016. Available in: <https://www.R-project.org/.>
REGAZZI, A. J. Teste para verificar a igualdade de parâmetros e a identidade de modelos de regressão não-linear. Revista Ceres, Viçosa, v. 50, n. 291, p. 9-26, Jan./June. 2003.
ROCHA, O. C. et al. Water deficit in arabica coffee trees as affected by irrigation regimes in the cerrado region. In: International Conference on Coffee Science, 22, 2008, Campinas. Proceedings… Paris: ASIC, 2008. p. 1157-1160.
ROCHA, O. C. et al. Qualidade físico-hídrica de um Latossolo sob irrigação e braquiária em lavoura de café no cerrado. Coffee Science, Lavras, v. 9, n. 4, p. 516-526, Oct./Dec. 2014.
ROVEDA, M. et al. Testes de identidade de modelos aplicados na construção de curvas de índices de local e na produção de povoamentos de Eucalyptus grandis. Scientia Forestalis, Piracicaba, v. 44, n. 109, p. 115-127, 2016.
SANTOS, T. E. M. dos; SILVA, D. D. da; MONTENEGRO, A. A. de A. Temporal variability of soil water content under different surface conditions in the semiarid region of the Pernambuco state. Revista Brasileira de Ciência do solo, Viçosa, v. 34, n. 5, p. 1733-1741, Sept./Oct. 2010.
SULTANI, M. I. et al. Evaluation of soil physical properties as influenced by various green manuring legumes and phosphorus fertilization under rain fed conditions. International Journal of Environmental Sciences Technology, New York, v. 4, n. 1, p. 109-118, Jan./Mar. 2007.
VAN GENUCHTEN, M. T. van. A closed-form equation for predicting the hydraulic conductivity of unsaturated soils. Soil Science Society of America Journal, Madison, v. 44, n. 5, p. 892-898, Sept./Oct. 1980.