Eurasian Journal of Business and Economics 2011, 4 (7), 1-11.
Macroeconomic Determinants of the Stock
Market Index and Policy Implications: The
Case of a Central European Country
Yu HSING
*Abstract
This paper examines the relationship between Hungary’s stock market index and relevant macroeconomic variables. The GARCH model is applied in empirical work. It finds that Hungary’s stock market index has a positive relationship with real GDP, the ratio of the government debt to GDP, the nominal effective exchange rate and the German stock market index, a negative relationship with the real interest rate, the expected inflation rate and the government bond yield in the euro area, and a quadratic relationship with real M2 money supply. It indicates that there is a positive (negative) relationship if real M2 money supply is less (greater) than the critical value of 9,563 billion forints. If the quadratic relationship is not specified and tested, the positive coefficient of real M2 will be insignificant at the 10% level, and we may reach a misleading conclusion that the stock market index is not affected by real M2.
Keywords: stock market index; government debt or borrowing; money supply; interest rates; exchange rates; foreign stock market
JEL Classification Codes: E44, P34, O23
1. Introduction
Like many other stock markets in the world, the recent global financial crisis had caused the Budapest stock exchange index to decline as much as 67% during July 2007 – March 2009 compared with the 57% decline of the U.S. S&P 500 stock index. Although it has recovered and shown an upward trend, its index value as of March 1, 2011 was still 24% below the all-time high of 29,840.94 on July 17, 2007. A substantial decrease in stock values has significant impacts on consumption and investment expenditures due to the liquidity and wealth effects, the balance sheet effect and Tobin’s q theory.
This paper studies macroeconomic determinants of the stock market index for Hungary and has several major focuses. First, this paper attempts to test whether the stock market index and the money supply may exhibit a quadratic pattern: a positive relationship if the money supply is less than a certain critical value and a negative relationship if the money supply is greater than a certain critical value. Increased money supply may initially raise the stock market index due to increased liquidity and output and portfolio adjustment. However, a further increase in the money supply beyond a certain critical value may reduce the stock market index because of the concern about the inflationary pressure and its negative impact on the stock price. Second, the roles of the government debt and the foreign interest rate are considered and analyzed. Third, the GARCH or ARCH model is applied in order to determine whether the error variance may be a function of the past squared error and/or the past error variance. This paper finds that Hungary’s stock market index is positively associated with real GDP, the ratio of the government debt to GDP, the nominal effective exchange rate and the German stock market index, is negatively influenced by the real interest rate, the expected inflation rate and the government bond yield in the euro area, and exhivits a bell-shaped relationship with real M2 money supply.
rates (Bulmash and Trivoli, 1991; Abdullah and Hayworth, 1993; Dhakal, Kandil and Sharma, 1993; Humpe and Macmillan, 2009), exchange rates (Abdullah and Hayworth, 1993; Choi, 1995; Ajayi and Mougoue, 1996; Nieh and Lee, 2001; Kim, 2003), foreign interest rates (Bredina, Gavin and O’Reilly, 2005), foreign stock market indexes (Rahman and Khan, 2009), and other relevant variables. They show that these macroeconomic variables have significant effects on stock prices or returns in the U.S. and other advanced countries to varying degrees.
Several studies analyze the subject for Hungary and related countries. Hanousek and Filer (2000) indicate that the stock market index and economic variables in Hungary are mainly connected with lags, suggesting the rejection of the semi-strong efficiency hypothesis and possible profitable trading activities using public information. They also find that the Hungarian stock market index is linked to the German stock index (DAX) or the U.S. DJIA based on the contemporaneous or lagged values. Poshakwale and Murinde (2001) find the presence of nonlinearity and conditional heteroskedasticity in the stock markets in Hungary and Poland and reject the day-of-the-week effect and that conditional volatility of the stock market index declines in Poland more consistently than that in Hungary.
Grambovas (2003) shows that Hungary’s stock market index is negatively associated with the HUF/DEM exchange rate and positively affected by the DAX in the long run. Furthermore, the stock market index also affects the exchange rate. Samitas and Kenourgios (2007) report several major findings for the four EU countries, namely, Hungary, Czech Republic, Poland and Slovakia: (1) the domestic industrial production has more impact on the stock market index than the domestic interest rate; (2) the U.S. interest rate has more effect on the stock market index than the U.S. industrial production; (3) the domestic economic activity in these four countries and the German factor are more important in affecting the stock market index than the U.S. global factor. Horobet and Dumitrescu (2009) find that Hungary’s stock market index is positively associated with the CPI and negatively influenced by real GDP, M1 money supply, the interest rate, and the effective exchange rate.
These previous studies have made significant contributions to the understanding of the behavior of Hungary’s stock market index. To the author’s knowledge, these previous studies did not consider the ratio of the government debt to GDP, M2 and M2 squared, and the euro area government bond yield in the formulation of the model and econometric estimation.
2. The Model
Extending previous studies, we can express Hungary’s stock market index as:
? ?
? ?
) , , , , , , , (
+ − − +
′ ′
= f Y D M R S R
H ε πe
(1)
where
H = the stock market index in Hungary,
Y = real output,
D = the government debt,
M = the money supply,
R = the real interest rate in Hungary,
ε
= the nominal effective exchange rate (NEER),e
π
= the expected inflation rate,S
′
= the foreign stock market index, andR
′
= the foreign interest rate.The sign below each of the variables shows the partial derivative of the stock market index with respect to a change in each of the variables. Hungary’s stock market index is positively influenced by real output and the foreign stock market index, negatively affected by the domestic real interest rate and the expected inflation rate, and may be affected positively or negatively by the government debt, the money supply, the nominal effective exchange rate or the foreign interest rate.
Increased government deficit-financed spending would initially increase aggregate demand, business opportunities, the price level, and the interest rate (Darrat, 1990a, 1990b; Ardagna, 2009). In the long run, deficit- or debt-financed government spending would crowd out private spending and may have a neutral effect on the stock market index and real GDP due to the Ricardian equivalence theorem (Barro, 1974). Hence, its net impact is uncertain.
∂ ∂ × ∂ ∂ + ∂ ∂ × ∂ ∂ + ∂ ∂ × ∂ ∂ + ∂ ∂ × ∂ ∂ = ∂ ∂ M S S H M R R H M Y Y H M H M H e e π
π > or < 0. (2)
In order to test a potential quadratic relationship between the stock market index and the money supply, the following equation is considered:
) , , , , , , , ,
(P D M M2 R S R h
H=
ε
π
e ′ ′ . (3)The partial derivative of H with respect to M is given by:
,
2 4
3 M
M
H =φ + φ ∂
∂ (4)
where
φ
3 andφ
4 are the respective coefficients of M and M2 in equation (3),,
0
3
>
φ
andφ
4<
0
.
Setting the first-order condition to zero and solving for the critical value of M that maximizes H, we have:. 2 4 3 φ φ − =
M (5)
An appreciation of the Hungarian forint would increase international capital inflows (F), hurt exports (X), and reduce import costs (C) and domestic prices (P) (Choi, 1995; Abdalla and Murinde, 1997; Nieh and Lee, 2001; Hacker and Hatemi-J, 2004; Ratanapakorn and Sharma, 2007):
∂ ∂ × ∂ ∂ + ∂ ∂ × ∂ ∂ + ∂ ∂ × ∂ ∂ + ∂ ∂ × ∂ ∂ = ∂ ∂ ε ε ε ε ε P P H C C H X X H F F H
H > or < 0, (6)
where 0 , 0 , 0 , 0 < ∂ ∂ < ∂ ∂ < ∂ ∂ > ∂ ∂
ε
ε
ε
ε
P C X F .Therefore, the net impact of currency appreciation is unclear.
A higher foreign interest rate tends to make the foreign assets more attractive, reduce international capital inflows to Hungary, and reduce the demand for stocks. On the other hand, a higher foreign interest rate could cause the foreign currency to appreciate and reduce the competitiveness of the foreign country.
The GARCH(m,n) model (Bollerslev, 1986) to be applied can be written as:
∑
∑
= − = − + + = n i i t j m i i t i i u 1 2 1 2 02 φ φ γ σ
σ , (7)
where
σ
2is the error variance andu
2is the squared error estimated from equation (3). Note that if all the coefficients forσ
t2−i are insignificant, equation (7)3. Empirical Results
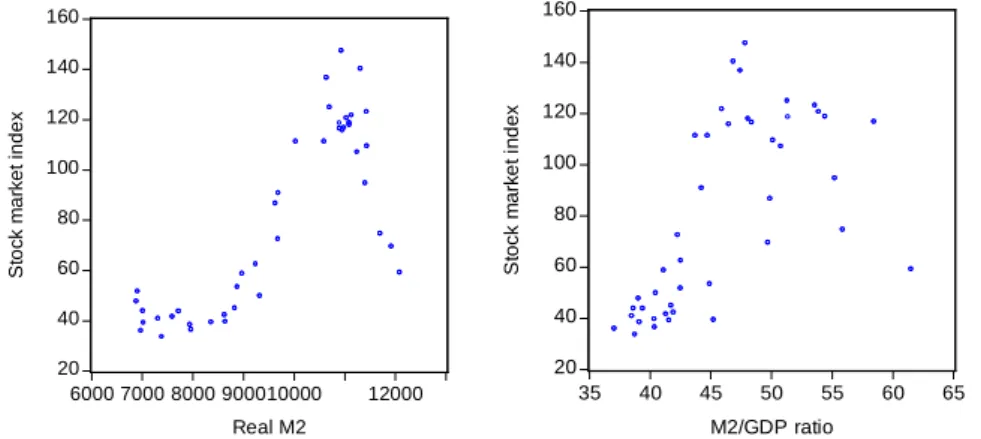
As shown in Graph 1, the stock market index and real M2 exhibit a positive relationship initially and then a negative relationship after real M2 reaches a certain critical value. The correlation between the stock market index and the M2/GDP ratio seems to be positive and decreases as the M2/GDP ratio increases. Estimated parameters and related statistics derived from equation (3) are used to test whether the evidence of a quadratic relationship between the stock market index and real M2 may be found statistically.
20 40 60 80 100 120 140 160
6000 7000 8000 900010000 12000
Real M2
S
to
c
k
m
a
rk
e
t
in
d
e
x
20 40 60 80 100 120 140 160
35 40 45 50 55 60 65
M2/GDP ratio
S
to
c
k
m
a
rk
e
t
in
d
e
x
Graph 1. The Relationship between the stock market index and real M2 or
the M2/GDP ratio in Hungary
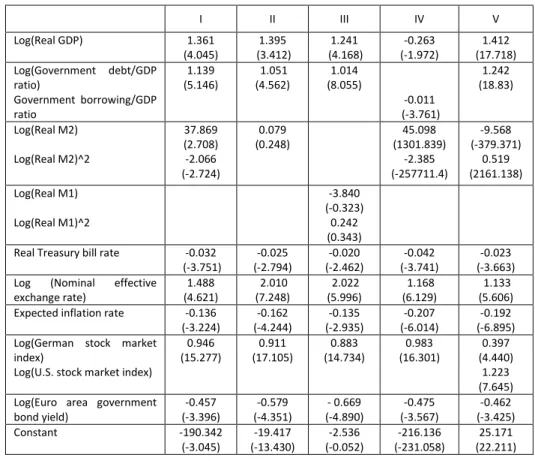
Table 1 presents empirical results for equation (3). Figures in the parenthesis are z-statistics for testing the significance of estimated coefficients. The GARCH model is considered. In Version (I), 96.5% of the variation in the stock market index can be explained by the nine right-hand side variables. All the coefficients are significant at the 1% level. The stock market index has a positive relationship with real GDP, the government debt/GDP ratio, the nominal effective exchange rate and the German stock market indexes, a negative relationship with the real Treasury bill rate, the expected inflation rate and the government bond yield in the euro area, and a quadratic relationship with real M2 money supply. Since the coefficients of the linear and quadratic terms for log(real M2) are significant at the 1% level, the critical value for real M2 that maximizes the stock market index is estimated to be 9,563 billion forints. Hence, the stock market index and real M2 will exhibit a positive relationship if real M2 is less than 9,563 billion forints and a negative relationship if real M2 is greater than the critical value of 9,563 billion forints.
not spurious, and these time series variables have a long-term equilibrium relationship.
Several different versions are estimated. When real M2 squared is not included in the estimated regression (Version II), the positive coefficient of real M2 is insignificant at the 10% level. Due to the omitted variable of real M2 squared, this result is misleading as the scatter diagram of the quadratic relationship shows in Graph 1. If real M2 and real M2 squared is replaced by real M1 and real M1 squared (Version III), their coefficients are insignificant at the 10% level, suggesting that the stock market index is not correlated with real M1. Hence, the choice of M1 or M2 will affect the outcomes. When the ratio of the government debt to GDP is substituted by the ratio of government borrowing to GDP (Version IV), its negative coefficient is significant at the 1% level. However, the negative significant sign of the coefficient of real GDP is incorrect. Note that the wrong sign of the negative coefficient of real GDP and the negative sign of the coefficient of the government borrowing/GDP ratio are attributable to a high degree of multicollinearity between real M2 and real M2 squared.
Table 1. Estimated regressions of Log (Hungary’s stock market index)
I II III IV V
Log(Real GDP) 1.361 (4.045) 1.395 (3.412) 1.241 (4.168) -0.263 (-1.972) 1.412 (17.718) Log(Government debt/GDP
ratio)
Government borrowing/GDP ratio 1.139 (5.146) 1.051 (4.562) 1.014 (8.055) -0.011 (-3.761) 1.242 (18.83) Log(Real M2) Log(Real M2)^2 37.869 (2.708) -2.066 (-2.724) 0.079 (0.248) 45.098 (1301.839) -2.385 (-257711.4) -9.568 (-379.371) 0.519 (2161.138) Log(Real M1) Log(Real M1)^2 -3.840 (-0.323) 0.242 (0.343) Real Treasury bill rate -0.032
(-3.751) -0.025 (-2.794) -0.020 (-2.462) -0.042 (-3.741) -0.023 (-3.663) Log (Nominal effective
exchange rate) 1.488 (4.621) 2.010 (7.248) 2.022 (5.996) 1.168 (6.129) 1.133 (5.606) Expected inflation rate -0.136
(-3.224) -0.162 (-4.244) -0.135 (-2.935) -0.207 (-6.014) -0.192 (-6.895) Log(German stock market
index)
Log(U.S. stock market index)
0.946 (15.277) 0.911 (17.105) 0.883 (14.734) 0.983 (16.301) 0.397 (4.440) 1.223 (7.645) Log(Euro area government
bond yield) -0.457 (-3.396) -0.579 (-4.351) - 0.669 (-4.890) -0.475 (-3.567) -0.462 (-3.425) Constant -190.342
Variance equation
RESID(-1)^2 -0.169
(-3.061)
-0.161 (-1.990)
GARCH(-1) 1.948
(139.293)
0.670 (5.597)
0.775 (6.079)
2.010 (121.407)
0.915 (3.559) GARCH(-2) -1.031
(-83.834)
-1.042 (-63.950)
-1.158 (-1.819)
Constant 0.0005
(25.835)
0.003 (328.441)
0.002 (1.833)
0.0003 (20.533)
0.004 (2.661) Adjusted R-squared 0.965 0.963 0.963 0.955 0.980 Akaike information criterion -1.978 -1.830 -1.727 -2.008 -2.333 Schwarz criterion -1.440 -1.334 -1.189 -1.470 -1.753 F-statistic 96.059 98.765 89.374 72.822 157.848 Estimation method GARCH GARCH GARCH GARCH GARCH
Notes: The data were collected from IMF’s International Financial Statistics. H is represented by the share price index with 2005 as the base year. Y is represented by real GDP index with 2005 as the base year. D is measured by the government debt as a percent of nominal GDP. The government deficit is not used due to lack of complete data. M is represented by real M2, which is defined as nominal M2 divided by the CPI times 100. R is represented by the Treasury bill rate minus the expected inflation rate, which is the average inflation rate of the past four quarters.
ε
is measured by the trade-weighted nominal effective exchange rate. An increase means an appreciation of the Hungarian forint. Due to significant economic integration between Hungary and Germany (Korhonen, 2003), the foreign stock market indexS
′
is represented by the German share price index with 2005 as the base year.R
′
is represented by the euro area government bond yield. Because Hungary has joined the EU since 2004, the selection of the government bond yield in the euro area should be appropriate. The logarithmic scale is used unless a variable has potential negative values. The quarterly sample runs from 2000.Q1 to 2010.Q2. The data for the share price index and the government debt before 2000.Q1 are not available.When both the U.S. S&P500 index with 2005 as the base year and the German stock market index are included (Version V), their coefficients are significant at the 1% level, and the negative coefficient of real M2 and the positive coefficient of real M2 squared are significant at the 1% level. These results suggest a U-shaped relationship and are contrary to what the theoretical model suggests. Hence, the U.S. stock market index is not included in the estimated regression. If the U.S. stock market index replaces the German stock market index, its estimated coefficient of 1.793 is significant at the 1% level. However, the signs of real M2 and real M2 squared are wrong. If the M2/GDP ratio and the M2/GDP ratio squared replace real M2 and real M2 squared, both of their coefficients are insignificant at the 10% level, indicating that real M2 and real M2 squared can better capture the quadratic relationship with the stock market index. To save space, these results are not printed here and will be available upon request.
Horobet and Dumitrescu (2009) in the sign of the real interest rate. However, our results are different from Samitas and Kenourgios (2007) that the German factor is more important than the U.S. global factor and Horobet and Dumitrescu (2009) in the signs of real GDP, the CPI, M1 money supply, and the real effective exchange rate. This paper has made an additional contribution by testing or incorporating the quadratic relationship between the stock market index and real M2 money supply, the government debt/GDP ratio, and the government bond yield in the euro area in the estimated regression.
4. Summary and Conclusions
This paper has examined the macroeconomic determinants of Hungary’s stock market index based on a quarterly sample during 2000.Q1 – 2010.Q2. The GARCH model is employed in empirical estimation. More real GDP, a higher government debt/GDP ratio, a lower real Treasury bill rate, an appreciation of the forint, a lower expected inflation rate, (increase) in German stock market index, or a lower government bond yield in the euro area would increase Hungary’s stock market index. The stock market index and real M2 money supply exhibit a positive (negative) relationship if real M2 is less (greater) than the critical value of 9,563 billion forints.
There are several policy implications. To maintain a robust stock market, the authorities need to promote economic growth, keep a relatively low interest rate and expected inflation rate, and pursue a strong currency policy. Investors may use the quadratic relationship between the stock market index and real M2 money supply in determining whether too much money may cuase inflationary pressures.. More real M2 initially causes a positive impact on the stock market index due to more liquidity and output and portfolio adjustment. However, if real M2 money supply continues to rise beyond a certain critical value, its impact becomes negative because of inflationary pressures. If the government debt/GDP ratio continues to rise beyond a certain critical level in the future, its positive impact on the stock market index may change.
References
Abdalla, I. S. A. & Murinde, V., 1997. Exchange rate and stock price interactions in emerging financial markets: evidence on India, Korea, Pakistan and the Philippines. Applied Financial Economics, 7, pp. 25–35.
Abdullah, D. A. & Hayworth, S. C., 1993. Macroeconometrics of stock price fluctuations. Quarterly Journal of Business and Economics, 32, pp. 50–67.
Ajayi, R. A. & Mougoue, M., 1996. On the dynamic relation between stock prices and exchange rates. Journal of Financial Research 19, pp. 193–207.
Barro, R. J., 1974. Are government bonds net wealth? Journal of Political Economy, 82, pp. 1095-1117.
Barro, R. J., 1990. The stock market and investment. Review of Financial Studies, 3, pp. 115– 131.
Becker, K. G., Finnerty, J. E., & Friedman, J., 1995. Economic news and equity market linkages between the US and the UK. Journal of Banking and Finance, 19, pp. 1191–1210.
Bollerslev, T., 1986. Generalized autoregressive conditional heteroskedasticity. Journal of Econometrics, 31, pp. 307-327.
Bredina, D., Gavin, C. & O’Reilly, G., 2005, US monetary policy announcements and Irish stock market volatility. Applied Financial Economics, 15, pp. 1243–1250.
Bulmash, T. G. & Trivoli, G. W., 1991. Time-lagged interactions between stock prices and selected economic variables. The Journal of Portfolio Management, 17, pp. 61–67.
Campbell, J. & Shiller, R. J., 1988. Cointegration and tests of present value models. Journal of Political Economy, 95, pp. 1062–1088.
Chaudhuri, K. & Smiles, S., 2004. Stock market and aggregate economic activity: evidence from Australia. Applied Financial Economics, 14, pp. 121-29.
Chen, N., Roll, R., & Ross, S. A., 1986. Economic forces and the stock market. Journal of Business, 59, pp. 383–403.
Cheung, Y. W. & Lai, K. S., 1994. Macroeconomic determinants of long-term market comovements among EMS countries. manuscript, UCSC, California.
Cheung, Y. W. & Ng, L. K., 1998. International evidence on the stock market and aggregate economic activity. Journal of Empirical Finance, 5, pp. 281–296.
Choi, J. J., 1995. The Japanese and US Stock prices: a comparative fundamental analysis. Japan and the World Economy, 7, pp. 347–360.
Darrat, A. F., 1990a. Stock returns, money and fiscal deficits. Journal of Financial and Quantitative Analysis, 25, pp. 387-398.
Darrat, A. F. 1990b, The impact of federal debt upon stock prices in the United States. Journal of Post Keynesian Economics, 12, pp. 375-389.
Dhakal, D., Kandil, M., & Sharma S. C., 1993. Causality between the Money Supply and Share Prices: A VAR Investigation. Quarterly Journal of Business and Economics, 32, pp. 52–74. Engle, R. F., 1982. Autoregressive conditional heteroskedasticity with estimates of the variance of U.K. Inflation. Econometrica, 50, pp. 987-1008.
Engle, R. F., 2001. GARCH 101: The use of ARCH/GARCH models in applied econometrics. Journal of Economic Perspectives, 15, pp. 157-168.
Fama, E. F., 1981. Stock returns, real activity, inflation and money. American Economic Review, 71, pp. 545–565.
Fama, E. F., 1990. Stock returns, expected returns, and real activity. Journal of Finance, 45, pp. 1089–1108.
Fama, E. F. & French, K. R., 1989. Business conditions and expected returns on stocks and bonds. Journal of Financial Economics, 25, pp. 23–49.
Hacker, R. S. & Hatemi-J, A., 2004. The effect of exchange rate changes on trade balances in the short and long run. Economics of Transition, 12, pp. 777-799.
Hanousek, J. & Filer, R. K., 2000. The relationship between economic factors and equity markets in Central Europe. Economics of Transition, 8, pp. 623-638.
Horobet, A. & Dumitrescu, S., 2009. On the causal relationships between monetary, financial and real macroeconomic variables: evidence from Central and Eastern Europe. Economic Computation & Economic Cybernetics Studies & Research 43, pp. 1-17.
Humpe, A. & Macmillan, P., 2009. Can macroeconomic variables explain long-term stock market movements? a comparison of the US and Japan. Applied Financial Economics, 19, pp. 111-119.
Kim, K., 2003. Dollar exchange rate and stock price: evidence from multivariate cointegration and error correction model. Review of Financial Economics, 12, pp. 301-313.
Korhonen, I., 2003. Some empirical tests on the integration of economic activity between the euro area and the accession countries. Economics of Transition, 11, pp. 177-196.
Mukherjee, T. K. & Naka, A., 1995. Dynamic relations between macroeconomic variables and the Japanese stock market: an application of a vector error correction model. The Journal of Financial Research, 18, pp. 223–237.
Nieh, C.-C. & Lee, C.-F., 2001. Dynamic relationship between stock prices and exchange rates for G-7 countries. Quarterly Review of Economics and Finance, 41, pp. 477-490.
Poshakwale, S. & Murinde, V., 2001. Modelling the volatility in East European Emerging stock markets: evidence on Hungary and Poland. Applied Financial Economics, 11, pp. 445-456. Rahman, M. & Khan, M. M., 2009. The Euro and convergence among stock markets of Germany, France and Italy, Global Economy Journal, 9, Article 1, pp. 1-13.
Ratanapakorn, O. & Sharma, C., 2007. Dynamic analysis between the US stock returns and the macroeconomic variables. Applied Financial Economics, 17, pp. 369-337.
Samitas, A. G. & Kenourgios, D. F., 2007. Macroeconomic factors' influence on 'new' European countries' stock returns: the case of four transition Economies” International Journal of Financial Services Management, 2, pp. 34-49.