Estudos de Economia, vol. xm, n.• 2, Jan.-Mar., 1993
EDUCATION AND ECONOMIC GROWTH IN PORTUGAL:
A SIMPLE REGRESSION APPROACH
Ana Bela Nunes (*)
Introduction
Over the last two decades Portuguese economic growth has been a par-ticular field of interest for Portuguese economic historians of the 19th and 2oth centuries. Since 1980's special efforts have been focused on the quantitative appraisal of Portuguese economy during the two last centuries. Those inves-tigations have been producing some comparatively long retrospective series of estimates of basic economic indicators. Public finance [Valerio (1982); Mata (1985); Valerio (1987); Silveira (1987)]; money supply and banking [Valerio (1984); Mata (1987); Reis (1990); Sousa (1991 )]; foreigh trade [La ins (1992)]; active population structure [Nunes (1989)]; prices and price indexes [Justina (1988) (1989)]; agriculture and industrial production indexes [Reis (1987)]; Lains (1990); national accounts [Justina (1987); Nunes, Mata, Valerio (1990)] have been the most privileged fields of recent investigation.
The availability of these quantitative data introduced new grounds to de-bate the performance of Portuguese economy during the last two centuries and particularly to review the causes of Portuguese economic backwardness in an international comparative perspective.
The level and character of integration in the world economy, of natural, human and produced resources, institutional aspects, such as state interven-tion and banking instituinterven-tions, have been reconsidered under pioneering theo-ries tested for other counttheo-ries before.
The quality and flexibility of economic resources, namely of labour, has been considered to be a decisive growth factor particularly since investigations on the causes of the post-second world war rates of growth in USA, European western countries and Japan. Actually, the relationship between education and economic growth is a matter that has been growing in interest among econo-mists, since the last three decades after Schultz (1961 a), Anderson, Bowman (1963) and Denison (1967), just to mention the earliest well known of their works. The subject has also focused economic historians attention, more re-cently, particularly after the so quoted works of Cameron (1985), Easterlin (1981), Sandberg (1979) and Sandberg (1982), in a somewhat diferent perspective. Of the different approaches that have been used to assess the economic contribution of education, especially on economic growth, the one Bowen (1968) called «the simple correlation approch» has been particularly employed by eco-nomic historians (1). This approach consists of correlating an index of
educa-(*) lnstituto Superior de Economia e Gestao, da Universidade Tecnica de Lisboa.
(1) See Tortella ed. {1990) Education and Economic Development since the Industrial
tiona! activity and an index of economic activity. Cross-section models, actu-ally cross-national and cross-regional camparisons have been used, among other aims, to «measure>> the degree of association between education and economic performance and to test gaps in GOP per capita, as explained in Bowman (1980)-cause-effect relationship between human capital and growth is harder to prove. Regression models (both time-series and cross-section) of this type have also been used, for instance, to estimate income-elasticity of demand for education, as refered in Schultz (1961 b) and to iluminate the time--lag problem as education is «a long-lived asset» - Mironov (1990) - and a relatively high income-elasticity good.
Only apparently does this matter seem incontestable. Actually, economic historians, in particular, are sensitive to the fact that the relative importance of sustained growth factors differs according to space and time and that the indispensability of a factor depends on the existence of alternative ones, form-ing a specific interrelated complex. Moreover, even if the existence of such a relationship could be taken for granted, many significant details have proved to be controversial.
As far as Portugal is concerned there are very few studies on education, or on human capital, from an economic, general approach
(2).
The present paper attempts to present a very preliminary, limited, simple, statistical analysis of a new case study on the relationship between education and economic growth.
We were interested, for the time being, in measuring the degree of asso-ciation between literacy, taken for the education variable, and GOP per capita, standing for the economic activity variable
(3)
to test some classical hypoth-eses, namely: a) The «literacy threshold» around 30-40% as a necessary con-dition for sustained economic growth, as suggested in Anderson and Bowman(2) Reis (1989) is a recent study on literacy in Portugal in the 19th century; it is an inter-esting, relevant economic aproach concerned with the economic and social reasons of Portugal's backwardness (relatively slow improvement) in the Mediterranean context, after the 1850's, in terms of literacy. The auther builts a model to predict the would be financial effort of Portuguese state to keep up with the literacy level of the European economies in a similar degree of development (pp. 102-105). He argues that the ressources needed, both financial and human, were perfectly within the country's ability. According to J. Reis the main problem was «insufficient political will» and «lack of proper (political) motivation» -social and military peaceful time during the second half of the 19th century- in a country where market forces were inefficient especially from de-mand side; economic conditions -low per capita income and reduced opportunies in the labour market- were responsable for a low demand for education, namely primary education.
Ramos (1988) is an interesting study basically on social-cultural, regional, gender aspects of literacy in Portugal. Some remarks on economic aspects, namely propriety structure, are also dis-cussed.
(3) Though these choices may be questioned they have been used for similar purposes to
deal with very different case studies such as Spain -Nunez (1990) - and Russia/USSR
-Mironov (1990)- and cross-national carnparisons -Anderson; Bowman (1963) and Sandberg (1982) - , with substantive, significative results.
Actually, specialy if the analysis focuses on early stages of economic growth and/or the adult literacy rates are not sufficiently close to 100%, as the case is, their relative advantages seem to be significant.
(1963) and Sandberg (1982); b) The existence of a significant statistical corre-lation between the two sets of data with a specific lag for GOP per capita (most case studies seem to suggest a time-lag between 20 and 35 years as having a rather high, if not the most significant statistical result); c) The exist-ence of a significant statistical correlation between the two sets of data with a specific lag for literacy (in this case the results seem to be less consistent).
The heart of this study is a number of time-series regressions relating GOP per capita -annual data- for the years 1835 to 1990 and literacy rates (of the total population) -annual data- for the years 1878 to 1981, or adult literacy rates (people over 10 years of age) for the years 1890 to 1981. A larger number of cross-section regressions, relating the same two variables in 20 relevant regions with several time-lags, were also tried to test an even-tual significant statistical explanation of diferences in regional per capita GOP through literacy level diferences among those 20 regions, in earlier periods. The methodology and sources of the estimates mentioned above are presented in the appendix.
1 - Literacy threshold
Time series of overall literacy, adult literacy rates and per capita GOP are presented in table A, below.
It is worth emphasizing some brief general remarks. As far as literacy rates, both total and adult, are concerned the most striking in the long-term trend is their very slow increase, a fact already noticed and discussed in Reis (1989), as mentioned in note 2 above, and in Ramos (1993). Actually it took almost a century to reach the 70% literacy threshold, and by 1981 universal literacy was still far. According to the estimates of per capita GOP, Portuguese economic growth has only become sustained after the Second World War, showing high growth rates per year, especially during 1946-1973 (5.2%). Till then, some periods of moderate but irregular growth (1860-1888; 1922-1941 ), alternated with periods of near stagnation (1833-1859; 1889~1913) (4). Further arguments to date modern economic growth in Portugal after the late 1940's and early 1950's, based on rather thorough analyses of the sectorial structure of labour force in Portugal from 1890 to 1981 are to be found in Nunes (1989) and Nunes (1991) (5).
On the advantages and drawbacks of using literacy as an estimator for education instead, for instance, of years of schooling or school enrollments, see Tortella, ed. (1990), and Bowman (1981).
The use of GDP (per capita) to measure growth is, despite all the inconveniences sistematicaly point out in Kuznets (1954), the best synthetic variable of the economic performance of an (na-tional) economy.
(4) For further details on the agregative aspects of Portuguese economic growth since the 1830's see Nunes, Mata, Valerio (1989).
(5) Only after 1950's does Portuguese economy show a significat rhythm of structure mod-ernization. Till then industrial share in labour force was 24% while agriculture share was still 48% (61% in 1890). In the early 1980's those figures were respectively 38% and 18%. The service sector, including commerce, public administration and defence, and other services, took up re-spectively 23% and 37% of active population.
Therefore, Bowman and Anderson suggestions, corroborated by Sandberg, that 30-40% of literates of the total population is a necessary threshold for sustained growth, is still confirmed.
2 - Literacy and per capita GOP
As S. Kuznets noticed about the problem of association and causation, specifically concerning income levels and some associated characteristics (6), correlation analyses, from the statistical point of view, as mentioned above, are useless, as such, to determine a cause-effect sequence of the relationship between any two variables. In the correlation analysis the coefficient of corre-lation (!) measures the linear association between (the) variables.
However, a time-lag cause-effect relationship between education and eco-nomic growth bears logic, ecoeco-nomic meaning in both directions.
It takes time before education, namely literacy, may influence GDP (and per capita GDP) either through its more direct productivity and allocation ef-fects or through its more difuse effect, for instance, on attitudes
(?).
Education is an investment whose private returns, rise in real earnings per worker, and accumulative social returns are not immediate.On the other hand, education, both private and public, envolves costs; the ability to bear them depends on a relatively high level of income per capita and on economic expectations of future incomes.
Therefore there is ground to run simple regressions, using the OLS method, both considering literacy as the independent, explanatory variable and per capita GDP as the dependent one and suggesting the reverse cause-effect sequence. Apart from the estimation of regression coefficients and their statistic signifi-cance - standard errors, t-statistic value, F- statistic value - regression analy-sis is statistically assessed by the coefficient of determination (r2) (or the ad-justed coefficient of determination (r'2) that measures the «goodness of fit» and the percentage of the total variation in the dependent variable explained by the regression model (the independent, explanatory variables).
We tried to find out after what time-lag have changes in literacy levels had a (more) significant impact on per capita GDP and, reciprocally, after what time-lag have changes in income levels had a larger effect on basic education in Portugal.
(6) "[ ... ] Because of this interaction of income level and other caracteristics [industrial struc-ture, literacy, patterns of population growth], the statistic association between them is no basis for assuming that this caracterstics are causative factors [ ... ]" in Kuznets (1954), p. 225.
Cl
Further analyses on how education, and literacy, fosters economic growth can be read in Schultz (1961b), Bowman {1981), Tortella ed. (1990). As far as sustained growth is concerned, S. Kuznets emphasized in Kuznets {1987) that modern economic growth depends on the difusion of science-based innov ations which requires formal educated labour force to explore them effi-ciently. To test specifically modern economic growth, enrollments or number of years attending school, would be rnore convenient proxy variables to the education level.A - Time-series analysis
First we ran the time-series regressions. As far as the regression analysis is concerned we faced the inevitable problems of autocorrelation. The use of a model that excludes many explanatory variables (further remarks on this bellow and in note 9), the fact of raw data «manipulation» (see the appendix on interpolation of censuses data to compute annual literacy rates) showed that the problem did not fall short of our expectaction. Actually, the computa-tion of the Durbin-Watson statistic revealed a very low figure. In this case the very high values of F and
t
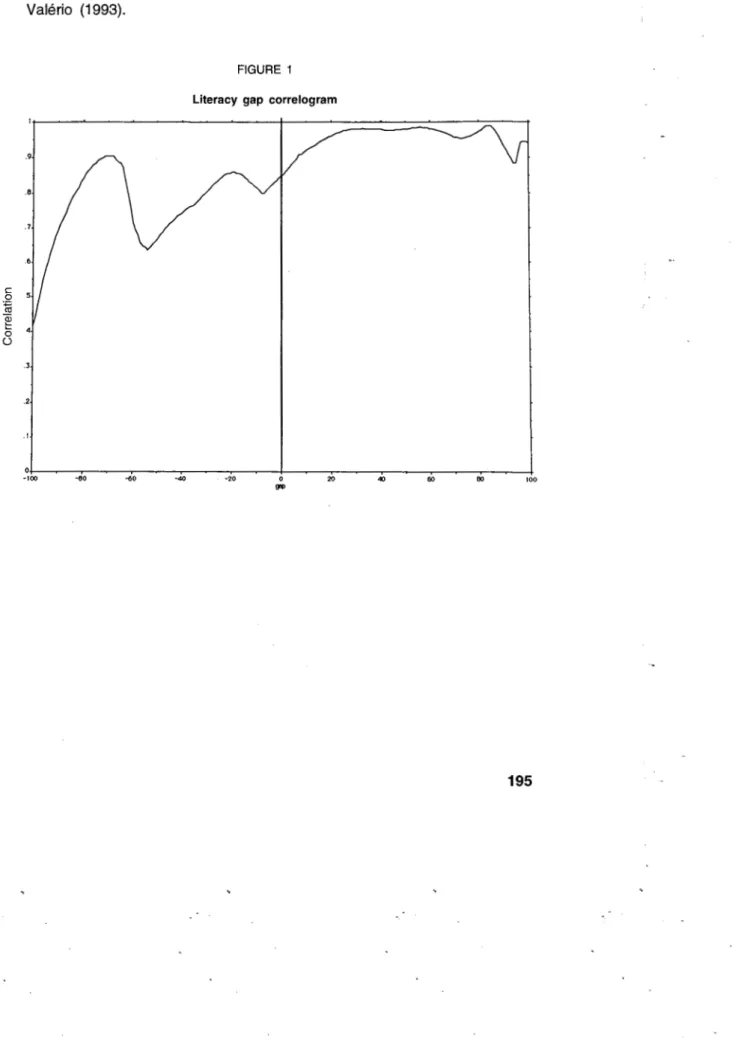
tests of significance loose credibility and the standard errors of the estimators are probably underestimating the real ones. Fortunately our aim is not prediction. Yet, figures on the statistical results of the relevant regressions, but the Durbin-Watson, are shown in table B, below.The correlogram gives a more impressive, clear view of the results. The right side of it corresponds to the first set of regressions -literacy as the explanatory variable- and the left side to the second set of regressions-per capita GOP as the explanatory variable. The curve represents the regres-sions using annual values of both series. The original per capita GOP series, shown in table A, was transformed in the index 1990 =100.
Other regressions were run aiming at checking the validity of the former results, and reducing the eventual criticisms on the roughness in measure-ment thanks to the shakiness of data, namely the figures of per capita GOP till 1930's, reflected in the sharp, short term fluctuations; the annual data se-ries of per capita GOP was rebuilt as a sese-ries of a fourth rank moving media to smooth the original data. As far as the literacy data is concerned the annual data serie was reduced to the figures of the censuses not combed with inter-polations, which often cause statistic problems. The hypothesis of dealing with a time-gap limited to 50 years maximum could have also been a cautious decision.
The comparison of the results of two sets of regression just mentioned proved to be very similar. Again, the similarity of the regression and correla-tion results taking overall or adult literacy rates is remarkable as these two series are highly correlated (8). We chose to use the literacy rates series as it is longer.
So we will dare to comment the figures supporting the correlogram, included in table B, which shows the results of the statistical analysis, of every 5 years time-lag regressions.
Let us begin with the analysis of the regressions considering per capita GOP as the dependent, lagged variable: p.c. GOP = ~% literates).
(8) Literacy rate = adult literacy rate x .948 - 4.059
df. 91 t: 234
r = .999 F: 54 606. (2 = 1'2 = .998
The results of the statistic analysis show that the degree of association between literacy and economic growth (t}, is always very high, certainly too high (9), taking any tested time-lag. The adjusted determination coefficients (r2) are in the interval .767- .972 if we use literates out of total population
(.787-.978 if adult literacy is taken as the independent variable).
A more detailed look at the figures of rand 1'2 reveals a certain periodicity. The first peak is observed at a time-lag of around 30 years; the second one, at a 55-60 years time-lag; a third maximum at a time-lag of 85-95 and it is growing at the last possible tested time-lag of 1 05 using literates out of total population. So a 25-35 years time-lag seems to be the one reflecting the strong-est relationship between education and economic growth, using literacy and per capita GDP as proxy variables.
This result confirms previous similar conclusions from other case studies [Spain in Nunez (1990), Russia/URSS in Mironov (1990), and Japan in Hanley
(1990)] and is credited with social historical evidence. 25-35 years is the nor-mal time span from the moment one gets its primary education to the moment one is fully adjusted to his professional activity.
As adjusted determinant and correlation coefficients figures are rather close along the analysed period, and it is impossible to test time-lags of more than
105 (literacy rates for total population), for lack of degrees of freedom, it is risky to foresee the time span of an eventual cumulative effect, of say, 120
years, as it is suggested in Sandberg (1982), and for Japan in Hanley (1990).
Once maximum values of the coefficients are rising (though slightly) as time--lags are larger, it is tempting to suggest such an hypotesis, all the more since a peak at 120 years time-lag would be 25-35 years after the last one detected at a time-lag of 85-95.
(9) According to the statistical meaning of the coefficient of determination, this figures mean that around 80% of the level of per capita GOP is explained by literacy during the time span under investigation. Obviously this is not feasible as there are many other important factors of economic growth as has been statistically proved using more realistic models of several explana-tory variables, as is discussed in Maddison (1991 ), not to quote classical studies as the ones of Denison. Actually, as explained in Mironov (1990), pp. 116-117, due to the use of «one-factor model [ ... ] the calculated determination coefficients can not reflect the net contribution of the 'edu-cation factor' to economic growth. They also reflect the contribution of other factors which we did not take into account and which affect economic growth not directly but indirectly, through educa-tion. Indeed, the economic potencial of society results from the action of many factors, including, perhaps, all those that affect economic growth as well [ ... ] The 'education' factor should therefore correspond to all other factors of economic growth and indirectly reflect their influence.» A more realistic model would probably be of the autoregressive type, which would help to overcome the autocorrelation problem.
However, as far as Russian/URSS case study is concerned, the author device to depict the net contribution of education from the original set of coefficients did not alter his original conclu-sions on the time-lag rhythm of effects of education on economic growth.
In Kuznets (1954), p. 225, the author with regard to explaining international diferences in income levels, states «Factors such as population growth pattern, literacy, industrial structure, and capital investment are of some importance in determining international differences in levels of income. But their importance per se, is much more limited than their close statistical association with per capita income suggests. Their net effect, if it could be measured, might account for but a small part of the existing differences, and therefore leave much room for further search and explanation_,
Table B also presents the results of the adjusted determination and corre-lation coefficients, r'2 and r, for every 5 years time-lags of literacy, considering
it as the independent variables in running the regressions: % literates
=
f (p.c. GOP).The results of the statistic analysis shows a relatively high degree of linear association with literacy rates time-lags varying from 0 to 90 years. The ad-justed determination coefficient are above .5 except for time-lags of 50-55 years, taking literates out of total population (45-50-55 and 90 years taking adult lit-eracy); in this cases r'2 are still above .4 (if we take ~ instead of r'2, the
number of exceptions would be reduced). For time-lags above 90 years coef-ficient values show figures of no statistic significance and with short fluctua-tions.
A more detailed analysis reveals a first peak at a time of 20 years time--lag and a much more significant one around a timetime--lag of 65-70 years. Notice that 140 years time-lag may be a peak (though not at a significative statistical level).
So, it seems that an improvement in per capita GOP has some positive effect in the level of education some 20 years ahead and especialy some 70 years after, what seems to be quite a long time span.
Though an hypothesis of a 70 years periodicity may be foreseen, the effect of a raise in the country's economic performance looses impact on its educa-tion ability after the first 7 decades, and, as meneduca-tioned above, at 140 years time-lag the eventual relative peak is of no statistical significance.
Comparing the two cause-effect sequences of the relationship between lit-eracy and economic growth, apparently, changes in the educational level of population are determined in a lower proportion by per capita GOP, than the reverse effect. Actually, the adjusted determination coefficients of regressions where the dependent, lagged variable is the literacy level are lower (maybe too low once we are running time series regressions) than the ones where it is the explanatory factor
(1°).
A more interesting aspect of the observed reciprocal cause-effect relation-ship between literacy and economic growth is the eventual existence of a chain mechanism. The hyp'othesis of a chain link of alternate positive effects of the type ... literacy -> economic growth -> literacy -> economic growth -> ... , is tempting. There would be two (or three) time span links; 25-35 years after a spur on literacy level (probably of formal primary education), there would be an increase in per capita GOP which would raise demand and supply of education, namely basic education, first, some 25 years ahead, and more clearly some 65-70 years later. Obviously, we would never know whether education or economic growth would be the starting point of the chain. This hypothesis has to be sistematically tested against other quantitative and qualitative data and has to take into especial account institutional aspects, as, for instance, the start of compulsory primary education.
(1°) Probably, according to the explanation in note 9, the diferences of the level of the coef-ficient values are also a consequence of the relative number and importance of indirect effects of other explanatory factors gathered on the two sets of simple regression models run.
Such a test is far from being an easy task and, what is certainly less stimulating, may be considered as hardly conclusive. Further relevant quanti-tative evidence, is scanty for most of the period under analysis.
Taking only some information on public attitudes towards education and instruction, though not very detailed for most of the period under considera-tion, we will risk, notwithstanding, the exercise of checking the chain mecha-nism stated above against some quantitative and qualitative information on public attitude towards education and particularly primary education.
As far as quantitative data is concerned, some relatively recent economic studies on public finance allow us to depict the evolution of the functional struc-ture of public expendistruc-tures, which includes a figure (for most of the period, an overall figure) on education
(1
1). Data is only available since the second half of the 19th century. Qualitative information is available in Carvalho (1986) a study on the history of teaching in Portugal till the end of Salazar-Caetano regime.The proportion of public expenditure on education from the 1860's to the 191O's hardly changed: 3% is the average figure with very small annual devia-tions of only ±1 %; in the 1860's and the years before the First World War, the figure attained 4% (and exceptionally 5% in 1910-1911 and 1912-1913). The decade after 187 4 and the 1890's public expenditure on education took only 2% of the total. During the First World War public expenditure on primary education accounted for 1/
3 of total expenditure on education. The 1920's, corresponding to the last years of the democratic republican regime, are the years of a radical change in the structure of public expenditures in favour of education and especially of primary education. The proportion of education on total jumped to a 9% average figure and primary education took 1/
2 of the total expended on education. These figures would remain till the beginning of the Second World War, corresponding to the firstyears of an authoritarian regime that would last till 197 4. During the Second World War the 9% figure went slightly down to 8% and primary education fell to 1/
3 of total public expendi-tures on education. From 1946 to 1974 education averaged 10% of total pub-lic expenditure and from then to 1988 the figure rose to 14%.
The most striking, and most inconvenient to our purpose, aspect of a synthetic view on qualitative evidence on this matter, is the large political in-stability of the 19th and 20th century and its obvious negative consequences as far as the implementation of an educational policy is concerned. Actually, even in periods of relative regime stability, as most of the second half of the 19th century, the rotation of prime ministers was far too quick and their edu-cational reform decrees, namely of primary education, were revoked as soon as their successors took over. Till the second half of the 20th century, most prime ministers were out of government in a couple of months, and so, their educational reform (if it had had time to be regulated and implemented), would have been canceled and, eventually, a new reform regulated and implemented. A second aspect worth emphasizing is the inexistence of a separate state department for education before 1913. The two previous attempts to create a
(11
State Department of Education were short-lived due to more or less serious financial crises: in 1870 it lasted two months; in 1890 it lasted 3 years.
A third aspect concerns compulsory primary education. Only legaly can it be considered to have been introduced in 1835, 1844 or, more accurately, in 1911, as it soon proved not to be practicable for economic and social reas-ons. Apparently, only in the beginning of 1950's there is quantitative evidence of compulsory primary education being accomplished. In 1950 still 20% of 7 to 11 years old children were not attending school; in 1955 that proportion was reduced to 1%. Only in 1960 did compulsory education attain 4 years of schooling.
A very broad analysis suggests a period of important reform of primary teaching during the last quarter of the 18th century, which aimed at creating a regional network of primary schools, and under a general ideological attitude favouring education
(1
2) (period of relative economic prosperity).The first third of the 19th century seems to have been detrimental to school-ing, thanks to political and military instability, including the wars with Spain and France (1801 and 1807-1814), and a civil war (1828-1834). In 1829 around 1/3 of primary schools were extinguished, a measure that had already been taken in 1823 for the same economic reasons. Though political instability went on to 1851, some ministers tried to implement primary education reforms, taking into account previous efforts in this field. Actually, some aspects of Rodrigo da Fonseca's reform in 1835 were respected in Passes Manuel's reform (1838) and both contributions were attended in the legislation of Costa Cabral (1844) on this matter.
As we refered above the first decades of the 2nd half of the 19th century brought some stability and some economic growth. Apparently the most im-portant innovation were technical schools, at least during the first two decades. During the 1870's some primary teaching reforms were thought out (1870 and 1878) but hardly implemented. Some private iniciative was taken and some important pedagogic innovation, concerning the teaching of reading and writ-ing, began its diffusion which would last many decades ahead.
Republicans would only take power in 1910 but their political and social pressure was actually felt, very deeply, from 1890 on. One of their /eit motiv was certainly primary education. They would try to implement what is still con-sidered to have been a very good reform of primary education, including a very large concern with the quality of teachers. The number of primary schools increased, but war, political instability and economic financial problems pre-vented this effort to be more fruitful.
Authoritarian regime, especial under Salazar, has traditionally widely been accused of having had basically negative influence on the level of education and instruction in Portugal, for ideological and political reasons
(1
3). Actually the slow improvement of the rate of literacy and the inability to garantee com-pulsory primary education, till 1950's, may, apparently, support such thesis.(12
) Two important institutions were founded standing for the especial athmosphere of this
period: the Academia Real das Ciencias de Lisboa (1779) and the Real Casa Pia (1780). (13) M. F. Monica, has been studying for some time cultural aspects of Portuguese society under Salazar regime. See specially Monica (1978).
Time comes to try to see into these informations to test, without going into detail, the above mentioned hypothesis of a chain relationship between eco-nomic growth and literacy level. Till the first decade of the second half 19th century the estimates on GOP per capita show acute short term flutuations and a near stagnation trend, so, apparently, the expected GOP growth after the first quarter of the 19th century, that would be induced by the favourable educational developments of the last quarter of the 18th century, cannot be depicted. However, taking in consideration the large margins of error accepted for those estimates for that period, and the evidence of an industrial conjunctural spurt (1835-1850) and of some institutional changes
(1
4), after the civil war between absolutists and constitutionalists (1828-1834), we may accept some signs of economic development some 35 years after significant measures in favour of education. Some 25 years later, in 1870's, as stated above, improve-ments on teaching methods may correspond to an eventual slight raise in demand and supply for education, namely primary education, reinforced around 191O's and 1920's with the Republican regime. This effort on primary educa-tion was fruitful 25-35 years later, as expected. Actually, by then, around 1950's, modern economic growth was at last gaining ground on Portuguese economy and some 25 years after the rythm of increasing literacy was raising.Naturally, the periods in which improvements on education are more ap-parent, are also moments of comparative prosperity. That is the case in the last decades of the 18th century
(1
5), again in 1860's, 1870's and most of the 1880's, in the 1920's and in 1980's.8 - Cross-section analysis
Let us now turn to cross-section regression analyses.
According to the time series regression and correlation analyses, we found a time-lag of around 30 years to be the most significant. Actually, the closest relationship between literacy and economic development, namely the strong-est impact of the former on the latter, seems to be reflected some 25-35 years after an eventual spurt of basic education. Figures also reveal that every 25-35 years the association of those variables is relatively stronger than in the years in between. We took these results as indicators to select the potencial relevant time-lag worth considering in view of running cross-section regressions. Naturally, special attention was given to the 25-35 time-lags.
Tables C and 0 show figures on regional literacy rates and per capita gross domestic product (GOP) or gross added value (GAV), respectively, as they were used to undertake the statistical analysis. For the present purpose, and taking into account the availability of data, the country was divided into 20 relevant regions, namely the 18 distritos -an administrative division - of the Main-land and the two archipelagos of Madeira and Azores. The appendix on meth-odology and sources, below, includes further details and account for a minor exception of the regional scope.
(14
) See Godinho (1955), Serrao, Martins (1977). (15) See again references in note 14.
We are not concerned here to describe or analyse regional differences neither on literacy rates nor on economic development, though those diferences are very apparent and make a point to the discussion on the relevant spacial scope to be considered when modern economic growth is the subject.
However, as expected, the statistical results on tables E and F, consider-ing different time-lagged cross-section regression and correlation analyses, show coefficients of correlation and of adjusted determination considerably lower than the ones revealed in the time-series analyses. This means that some regions show a relatively high literacy rate though their per capita GOP, some time later, is comparatively low.
The comparison of tables E and F confirms these findings. Table F includes the statistic results taking data from the Mainland, while table E includes also data from the Islands, where, namely Azores, in most censuses, show a com-paratively high literacy rate
C
6) ranking this region in a position that does not match its rank as far as economic development is concerned(1
7). Statistical results, namely the regressions fit are, clearly, better when the 18 administra-tive divisions of the Mainland, alone, are considered.Social, institutional and cultural factors influence regional patterns of literacy; those factors are smoothed at national scope but they may be quite apparent at regional level. Actually, factors as migration expectations, migration sexual structure, migration destiny (national or international); location of religious or-ders - and their subsequent suppression - ; type of property; insertion of women in agriculture activities, among others, are responsable for regional (and also national), particular types and levels of literacy patterns, and their eco-nomic impact may not be felt ever, significantly, on that region. This is the case if, namely, it is an emigration region. Azores, and some Northern interior areas of the Mainland as Viseu, Vila Real, Guarda are for comparatively long periods, outstanding examples. Again, this is not the purpose of this paper. How far do the statistical results of cross-section analysis corroborate the ones from time-series regressions?
Tables E ant F summarize the results of the regression and correlation analyses we considered to be relevant. As we stated above, our main point was to check time-lags of 25-35 years, as, broadly, leading to rather signifi-cant correlation and adjusted determinant coefficients, in a context of good fits.
According to available data, the first regression taking time-lags close to that time span is 1900 -> 1938, standing for 1938 per capita GOP
=
f(1900 literacy rate), and the last one is 1985 per capita GAV = f(1960 literacy rates), schematizing, 1960 -> 1985. Statistical results are quite confident. Only for 1920,(16) The Azores Islands also show an unexpected gender pattern caracterized by female lit-eracy rates clearly above male litlit-eracy rates. A couple of examples: according to the census of 1920 they were respectively 38.0% and 30.4%. In 1940 the corresponding figures were 39.6 and 46.0%.
(17
) This difference in ranking according to literacy and according to economic development is still smooth by the fact that the method used to estimate regional per capita GOP, as stated in the appendix, lays on the assumption of equal productivity througout the country in each branch of activity, which certainly favours Azores.
1940, 1950 literacy rates, taking the whole country, and 1940, taking only its Mainland, do the adjusted determinant coefficients and the coefficient of corre-lation show figures clearly below .5 and .7 respectively, when taking time-lags of 25-30-35.
The fact that if we reduced the time lags to 20 years in case of taking 1940 and 1960 as independent variable, that is to say, if we ran 1940 -> 1960 and 1960 -> 1980 regressions, we would find rand r'2 above .7 and .5 (the
same would even happen with 1970 -> 1985 regression) may be an interest-ing findinterest-ing. It may point out that from the moment a certain national literacy threshold is attained (apparently the first threshold, refered above), the higher the level of literacy, the shorter the time-lag needed to the impact of educa-tion to "be significantly felt on the economic performance, and the better the coefficients of determination and correlation.
The results of regressions taking longer time-lags, namely of 55-60 years, seem to confirm this. Except for 1878 -> 1938, 1890 -> 1950, 1900 -> 1955/ 1960; 1930 -> 1980/1985, where the coefficients are definitely high, the consid-eration of these longer time-lags reflects r'2 rather low, and always lower than taking shorter lags (with the apparent exception of 1930 -> 1985), although all significant tests remain positive and significant with minor exceptions (a coup-le of F-statistic roughly below 9.5).
Conclusion
Some broad qualifications must be noticed and bring this preliminary study to a simple contribution, a mere exercise, on this matter.
Improvements to national account estimates, especialy before 1950's, and to regional accounts are, of course, still expected. Since this paper is strictly based on the existing available estimates, its findings are to be discussed and eventually revised in the (near, I hope) future. Inserted as it is in larger scopes, namely the explanation of Portuguese economic backwardness, the considera-tion of more complex explanatory models envolving other factors of growth is expected to enlight the subject.
As far as education is concerned, literacy is probably its most easily avail-able indicator specially in a country where statistical data is scanty. School enrollments, data on technical education, analyses of gender gap, are also classical variables standing for education and used for similar analyses. Efforts to estimate and use long-series of other related or proxy variables, are still welcome and they also may discuss some of the conclusions and qualifi-cations of this study.
Nevertheless, for the time being, our findings on the contribution of educa-tion, namely literacy, to (modern) economic growth, and the time-lags of its major impact, seem to adjust to similar, prior case studies.
APPENDIX
1 - Computation of literacy rates
A - Methodology
Official estimates of population and literates are available in the 12 popu-lation censuses covering the period 1864-1981. Those counts took place in the years of 1864, 1878, 1890, 1900, 1911, 1920, 1930, 1940, 1950, 1960, 1970, 1981 (preliminary results of 1991's census are now coming out but fig-ures on literates are not yet available). Data is available on a regional basis. Some setbacks, due to inevitable diferences in the arrangements of the infor-mation presented in the censuses along such a time span (almost 120 years), did not prevent an apparently rather homogeneos set of data for the 20 rel-evant regions considered (the 18 distritos of the Mainland, and the archipela-gos of Azores and Madeira). Yet, as far as 1878 census is concerned it is only possible to gather data on literacy for 19 regions as, by then, the would be distrito of Setubal, created in 1926 (decree no. 12 870, Dec. 22), was a part of the distrito of Lisboa. There is no corresponding data on concelhos -the administrative divisions of the distritos - so we could artificially breake up the distrito of Lisboa and to compute literacy levels in the areas that would correspond to the new distrito of Lisboa and to the one of Setubal; the same is not true of the censuses of 1890, 1900, 1911 and 1920 where it is possible to undertake such computations.
Linear interpolation between every two consecutive census was the method to produce a year to year estimate of literacy rates.
A similar procedure was used to compute a year to year estimate of adult literacy rate (people over 10 years of age) for the period 1890-1981. The cen-sus of 1878 presents no information on literates by age groups; the cencen-sus of 1864 presents no information on literates.
All census counted literates (and obviously population) by sex.
8-Sources
Censo da Popula9fio de Portugal- 1864, published by the Direcgao-Geral de Estatfstica.
Censo da Popula9fio de Portugal- 1878, published by the Direcgao-Geral de Estatfstica.
Censo da Popula9fio de Portugal- 1890, published by the Direcgao-Geral de Estatfstica.
Censo da Popula9fio de Portugal- 1900, published by the Direcgao-Geral de Estatfstica.
Censo da Popula9fio de Portugal- 1910, published by the Direcgao-Geral de Estatfstica.
Censo da Popula9fio de Portugal- 1920, published by the Direcgao-Geral de Estatfstica.
Censo da Popula9fio de Portugal- 1930, published by the Direcgao-Geral de Estatfstica.
VIII Recenseamento Geral da Populat;ao- 1940, published by the Institute Nacional de Estatfstica.
IX Recenseamento Geral da Populat;ao- 1950, published by the Institute Nacional de Estatfstica.
X Recenseamento Geral da Populat;ao- 1960, published by the Institute Nacional de Estatfstica.
XI Recenceamento Geral da Populat;ao- 1970, published by the Institute Nacional de Estatfstica.
XII Recenseamento Geral da Populat;ao- 1981, published by the Institute Nacional de Estatfstica.
2 - Computation of per capita gross domestic product (GOP) at 1914 market prices A -Methodology
The year to year estimates of per capita gross domestic product at 1914 market prices, for Portugal, were previously published in our paper «Portu-guese Economic Growth 1833-1985», in The Journal of European Economic History, vol. 18, no. 2, Fall 1989 (in collaboration with Eugenia Mata e Nuno Valerio). The paper includes, at the appendix, a detailed explanation of com-putation of GOP, population, the deflator and GOP per capita. Figures for 1981--1985 were corrected to take into account the results of the 1991 census. Fig-ures for 1986-1990 were computed by the very same method explained in the paper just quoted and are to be published in a forthcoming papar by Nuno Valerio.
Only very recently have some official estimates of GOP (actualy gross added value at current prices) on a regional basis been published, by the Institute Nacional de Estatfstica for the years 1980 on for the Mainland (excluding the archipelagos of Azores and Madeira).
For the years 1952, 1954, 1956, 1958 in Loureiro (n/d) and 1970 in Caramona, Concei<;ao, Amorim (1972) some estimates were computed, again just for the Mainland.
In our Ph. D. Thesis, Nunes (1989), we tried to estimate regional (actually 18 distritos of the Mainland, Azores and Madeira) GDP for the years of 1938 and 1947-1980 using labour force data and the assumption of equal produc-tivity througout the country in each branch of acproduc-tivity. To compute per capita figures we used our annual estimates of regional resident population also avail-able in Nunes (1989). Our choice for our estimates is explained in face of the relative homogeneity and length of the series and because they concern the whole country. Nevertheless, we also computed data from the other sources mentioned to wide the time scope and to check our results. Whenever rel-evant we include in the tables figures and statistical results of regressions using these data.
To run cross-section regressions using regional literacy rates of 1878, we had to get a unique figure of per capita GDP (or GAV) for the area covered by the two distritos of Lisboa and Setubal for the reason explained above, in this appendix. That figure is the weighted average of the two original values.
8-Sources
Loureiro (n/d).
Caramona, Conceic;ao, Amorim (1972). Nunes (1989).
Nunes, Mata, Valerio (1990). Valerio (1993).
FIGURE 1 Literacy gap correlogram
.9 .a .7 § 5 ~ ~ 0 0 .3 .2 .I ~~oo---~~o---~~o---®---~2o---+o----~~----~----~oo----~oo---4,oo gop
TABLE A
Economic growth and literacy in Portugal: basic data
Year 1833 ··· 1834 ··· 1835 ··· 1836 ··· 1837 ··· 1838 ··· 1839 ··· 1840 ··· 1841 ··· 1842 ··· 1843 ··· 1844 ··· 1845 ··· 1846 ... . 1847 ··· 1849 ... : ... . 1850 ··· 1851 ··· 1852 ··· 1853 ··· 1854 ··· 1855 ··· 1856 ··· 1857 ··· 1858 ··· 1859 ··· 1860 ··· 1861 ··· 1862 ··· 1863 ··· 1864 ··· 1865 ··· 1866 ··· 1867 ··· 1868 ··· 1869 ··· 1870 ··· 1871 ··· 1872 ··· 1873 ... . 1874 ··· 1875 ··· 1876 ··· 1877 ··· 1878 ··· 1879 ··· 1880 ··· 1881 ··· 1882 ··· Per capita GDP
1914 prices Literacy rate escudos 116 104 85 88 106 98 93 86 101 109 124 122 99 103 114 107 95 102 109 89 75 82 71 87 97 86 88 88 93 98 100 103 97 95 102 107 115 115 121 123 126 133 133 120 120 121 129 131 131 18 18 18 18 19 Adult literacy rate (literates aged 10 or more)
Year 1883 ··· 1884 ··· 1885 ... . 1886 ··· 1887 ··· 1888 ··· 1889 ··· 1890 ··· 1891 ··· 1892 ··· 1893 ··· 1894 ··· 1895 ··· 1896 ··· 1897 ··· 1898 ··· 1899 ··· 1900 ··· 1901 ··· 1902 ··· 1903 ··· 1904 ··· 1905 ··· 1906 ··· 1907 ··· 1908 ··· 1909 ··· 1910 ··· 1911 ··· 1912 ... .. 1913 ··· 1914 ··· .1915 ··· 1916 ··· 1917 ··· 1918 ··· 1919 ··· 1920 ··· 1921 ··· 1922 ··· 1923 ··· 1924 ··· 1925 ··· 1926 ··· 1927 ··· 1928 ··· 1929 ··· 1930 ··· 1931 ··· 1932 ··· 1933 ··· 1934 ··· 1935 ··· 1936 ··· Per capita GDP
1914 prices Literacy rate escudos 135 149 158 162 167 176 168 151 154 153 151 150 166 169 158 152 157 164 160 165 163 156 157 158 162 164 163 170 152 159 157 142 145 148 136 102 113 103 90 123 126 121 137 148 145 174 187 189 199 204 206 209 209 204 19 19 19 20 20 20 21 21 21 21 21 21 21 21 21 21 21 21 22 22 22 23 23 23 24 24 24 25 25 25 26 26 27 27 28 28 29 29 29 30 30 30 31 31 31 32 32 32 33 34 35 36 36 37 Adult literacy rate {literates aged 10 or more) 24 24 24 25 25 25 25 26 26 26 27 27 27 28 28 29 29 29 30 30 31 31 31 32 32 33 33 34 34 34 35 35 36 36 37 37 38 38 39 39 40 41 41 42 43 44 45
Year 1937 ··· 1938 ··· 1939 ··· 1940 ··· 1941 ... . 1942 ... . 1943 ... . 1944 ... . 1945 ··· 1946 ... . 1947 ... . 1948 ... . 1949 ··· 1950 ... . 1951 ... . 1952 ... . 1953 ... . 1954 ... . 1955 ··· 1956 ... . 1957 ... . 1958 ... . 1959 ... . 1960 ··· 1961 ... . 1962 ··· 1963 ... . 1964 ··· 1965 ... . 1966 ... . 1967 ··· 1968 ... . 1969 ...•... 1970 ··· 1971 ... . 1972 ... . 1973 ... . 1974 ... . 1975 ··· 1976 ··· 1977 ... . 1978 ··· 1979 ... . 1980 ... . 1981 ... . 1982 ··· 1983 ... . 1984 ... . 1985 ... . 1986 ... . 1987 ... . 1988 ··· 1989 ... . 1990 ··· Per capita GDP
1914 prices Literacy rate escudos 204 216 227 225 242 236 228 214 205 209 223 224 225 237 244 244 260 274 282 293 306 320 336 355 373 394 417 441 476 505 549 596 619 685 733 795 894 870 782 813 872 898 952 983 994 1014 1013 994 1024 1066 1121 1166 1224 1275 38 39 40 41 42 43 44 45 46 47 48 49 50 51 . 52 53 54 55 55 56 57 58 59 60 60 61 62 62 63 64 64 65 66 66 67 68 68 69 70 70 71 72 72 73 74 Adult literacy rate (literates aged 10 or more) 45 46 47 48 49 49 51 52 53 54 55 56 57 58 59 60 61 62 63 63 64 65 66 67 68 68 69 70 71 71 72 73 74 74 75 76 76 77 78 78 79 79 80 81 81
TABLE B
Statistical results of time-serie regressions
Gap (years)
I - Real per capita gross domestic product as a function of the literacy rate
0 ... 103 .850 .720 265 16.3 5 ... 103 .889 .788 383 19.6 10 ... 102 .919 .842 546 23.4 15 ··· 97 .942 .885 750 27.4 20 ... 92 .961 .923 1 107 33.3 25 ··· 87 .975 .949 1 626 40.3 30 ... 82 .981 .961 2 023 45.0 35 ··· 77 .981 .963 1 987 44.6 40 ··· 72 .979 .958 1 633 40.4 45 ··· 67 .977 .954 1 397 37.4 50 ··· 62 .980 .959 1 448 38.1 55 ... 57 .985 .971 1 880 43.4 60 ··· 52 .981 .963 1 331 36.5 65 ... 47 .972 .944 789 28.1 70 ··· 42 .957 .914 450 21.2 75 ··· 37 .956 .912 384 19.6 80 ··· 32 .972 .943 532 23.1 85 ... 27 .987 .972 950 30.8 90 ··· 22 .931 .860 136 11.7 95 ··· 17 .884 .767 57 7.6 100 ... 12 .941 .875 85 9.2 105 ... 7 .972 .935 102 10.1
II - Literacy rate as a function of real per capita gross domestic product
- 5 ... 103 .817 .664 204 14.3 -10 ... 103 .815 .660 201 14.2 -15 ... 103 .846 .713 257 16.0 -20 ... 103 .859 .735 286 16.9 -25 ... 103 .841 .704 246 15.7 -30 ... 103 .805 .645 188 13.7 -35 ... 103 .768 .587 147 12.1 -40 ... 103 .745 .551 127 11.3 -45 ... 102 .714 .505 105 10.2 -50 ... 97 .670 .443 78 8.8 -55 ... 92 .643 .407 64 8.0 -60 ... 87 .716 .507 90 9.5 -65 ... 82 .884 .778 289 17.0 -70 ... 77 .903 .813 336 18.3 -75 ... 72 .885 .780 256 16.0 -80 ... 67 .842 .705 161 12.7 -85 ... 62 .779 .600 94 9.7 -90 ... 57 .694 .472 52 7.2 -95 ... 52 .575 .317 25 5.0 -100 ... 47 .415 .154 10 3.1 -105 ... 42 .220 .025 2 1.4 -110 ... 37 .100 -.017 4E-1 .6 -115 ... 32 .248 .031 2 1.4 -120 ... 27 .361 .097 4 2.0 -125 ... 22 .302 .047 2 1.4 -130 ... 17 .160 -.035 4E-1 .6 -135 ... 12 .420 .102 2 1.5 -140 ... 7 .588 .237 3 1.8 Coefficient <P,l .858 1.073 1.307 1.459 1.638 1.849 2.107 2.443 2.884 3.460 4.210 5.144 6.060 6.907 8.021 9.769 11.661 12.648 10.437 7.786 7.806 1.555 1.037 1.488 2.345 3.251 3.852 4.190 4.322 4.471 4.812 5.013 5.079 5.450 6.522 6.432 6.262 5.910 5.465 4.988 4.742 3.873 .025 -.012 -.036 -.069 -.077 0.44 .175 .270
1\)
0 TABLE C
0
Regional literacy rates in Portugal
Region 11878 1890 1900 1911 1920 1930 1940 1950 1960 1970 1981 1 15.1 17.2 21.2 25.0 30.5 33.0 43.8 54.9 61.4 69.1 76.1 12.9 15.5 14.8 16.1 19.1 21.0 27.0 36.5 49.8 55.5 60.8 18.9 19.6 22.2 24.0 26.1 28.2 35.7 45.2 54.7 63.0 72.6 14.8 15.4 16.6 18.3 21.4 24.3 34.5 45.8 54.3 60.3 67.5 11.0 12.7 13.5 15.6 17.7 19.7 29.2 42.0 53.2 58.1 64.2 12.5 15.1 16.9 20.9 25.9 30.2 40.6 51.4 59.6 65.3 72.9 15.9 18.6 17.7 19.8 22.9 26.6 35.0 45.2 55.7 60.7 66.6 14.3 14.8 16.6 17.9 22.2 26.5 37.7 46.8 57.1 61.1 68.6 13.8 16.9 16.3 19.8 24.1 26.6 37.6 48.1 55.7 61.0 68.3 11.1 13.2 13.5 16.6 20.3 23.7 34.7 46.7 56.2 62.9 70.7 29.3 38.8 41.1 44.3 48.8 52.4 59.5 67.1 71.9 75.4 80.4 13.6 17.2 16.8 18.2 21.7 26.8 33.3 42.9 54.4 57.9 63.9 23.9 28.0 29.4 32.9 37.5 39.9 46.8 56.7 63.0 70.3 77.4 13.7 16.8 17.9 20.1 23.5 29.0 36.2 48.5 56.1 63.8 71.0 21.3 22.4 23.0 25.0 30.5 36.1 48.4 59.7 68.2 75.1 20.1 23.2 23.2 24.2 27.6 29.3 38.3 48.7 56.3 63.5 70.1 21.6 24.4 23.1 24.8 28.9 29.1 35.5 46.1 53.6 60.3 68.5 14.4 15.8 14.6 19.5 24.1 26.9 34.7 47.1 56.6 62.2 68.9 17.9 23.0 17.6 28.3 34.5 33.3 42.9 53.0 60.2 65.7 69.6 9.9 15.5 10.0 17.2 21.7 22.7 29.8 43.1 54.3 58.0 64.6
TABLED
Regional per capita gross domestic product in Portugal
Region 1938 1947 1950 1955 1960 Aveiro ... 1 587 4284 4494 5 611 7 570 Beja ... 1 387 3628 3 992 4 908 6336 Braga ... 1 666 4577 4 754 5 593 6 669 Braganga ... 1 257 3129 3 342 4 191 5 536 Castelo Branco ... 1 388 3678 3 908 4 918 6175 Coimbra ... 1 492 3 835 4 097 5 077 6 839 Evora ... 1 489 3 949 4324 5 290 6 989 Faro ... 1 499 4 239 4594 5 753 8 110 Guarda ... 1 265 3 266 3 464 4246 5 455 Leiria ... 1 372 3 703 3 919 4 983 6 972 Lisboa ... 2399 5 763 6 203 7 911 11 761 Portalegre ... 1 516 4 082 4464 5 307 6 822 Porto ... 1 987 5 337 5 595 6 920 9 207 Santarem ... 1 525 4088 4 412 5 381 7037 Setubal ... 1 797 5127 5 591 7 016 10 109 Viana do Castelo ... 1 578 3 853 3 968 4 828 6 060 Vila Real ... 1 346 3 381 3 629 4347 5443 Viseu ... 1 340 3 416 3 615 4 351 5 527 Agores ... 1 279 3 491 3843 4 688 6 108 Madeira ... 1 339 3405 3 607 4490 5 953 Region 1963 1965 1966 1968 1970 Aveiro ... 9 213 11 510 12 771 15 597 19 343 Beja ... 7 571 9 200 10 106 12 501 15 517 Braga ... 8 072 10 029 10 994 13 326 16 504 Braganga ... 6 375 7 507 8 059 9 724 11 764 Castelo Branco ... 7 393 9 015 9 888 11 987 14 831 Coimbra ... 8 323 9 973 11 027 13 531 16 835 Evora ... 8 626 10 617 11 794 14 760 18 658 Faro ... 9 691 11 526 13 026 16 006 19 656 Guarda ... 6 517 7 912 8 589 10 508 13 037 Leiria ... 8 452 10 315 11 334 13 876 17 227 Lisboa ... 13 934 16 196 17 858 21 380 26 141 Portalegre ... 8 293 10 078 11 060 13 740 17198 Porto ... 11 036 13 401 14 869 17 907 22 040 Santarem ... 8486 10 303 11 335 13 812 17 116 Setubal ... 12424 15 076 16 892 20 738 25 823 Viana do Castelo ... 7 361 8 942 9 886 12 201 15 133 Vila Real ... 6 303 7 439 8 006 9 636 11 656 Viseu ... 6542 7 879 8 570 10 477 12 876 Agores ... 7325 8 604 9 541 11 666 14 345 Madeira ... 7 490 9 311 10 411 13 022 16 655 Region 1971 1975 1980 1980 (*) 1985
n
Aveiro ... 21 546 39 687 122 652 133 600 348 200 Beja ... 16 943 130 016 90431 101 600 260 700 Braga ... 18 480 33 830 112 020 109 000 316 000 Braganga ... 13 020 24 716 79 211 75 800 234100 Castelo Branco ... 16 484 30 024 98 109 94 000 297 700 Coimbra ... 18 704 34 202 112 317 118 900 331 500Region Evora ... Faro ... Guarda ... Leiria ... Lisboa ... Portalegre ... Porto ... Santarem ... Setubal ... Viana do Castelo ... Vila Rea~ ... Viseu ... Agores ... Madeira ...
(•) Gross added value.
Unit: escudo. 1971 20 524 21 543 14 561 19443 28 522 18 656 24249 19 005 28166 16 876 13 002 14413 15 761 18 611 1975 1980 1980 (•) 36 738 111 235 131 200 37 098 124 335 127100 27 584 91 561 77 300 36 580 112 468 118 600 49 047 152 622 204 100 32104 96 420 120 200 41 952 132 738 141 700 34 882 110 256 124 000 47 996 134 288 168 100 31 073 97 697 76 200 25248 83154 73400 27 862 91 295 79 700 28 451 90 567
.
33137 111 933.
TABLE EStatistical results of cross-section regressions: Portugal
Literacy GOP 1878 ··· 1938 1878 ··· 1963 1878 ··· 1968 1890 ··· 1938 1890 ... 1950 1900 ··· 1938 1900 ··· 1955 1900 ··· 1960 1911 ... 1938 1911 ··· 1947 1911 ··· 1966 1911 ··· 1971 1920 ··· 1947 1920 ··· 1950 1920 ··· 1955 1920 ··· 1975 1920 ··· 1980 1930 ··· 1955 1930 ··· 1960 1930 ··· 1965 1940 ··· 1960 1940 ··· 1965 1940 ... 1970 1940 ··· 1975 1950 ··· 1975 1950 ... 1980 1960 ... 1980 GOP- gross domestic product.
r - correlation coefficient Gap 60 85 90 48 60 38 55 60 27 36 55 60 27 30 35 55 60 25 30 35 20 25 30 35 25 30 20 1'2
- adjusted coefficient of determination
F- F statistic. t - t statistic. dw-Durbin-Watson statistic. r r'' F .767 .564 24.261 .586 .343 8.894 .505 .255 5.824 .798 .617 31.628 .675 .425 15.049 .894 .789 71.890 .776 .580 27.249 .747 .534 22.737 .817 .649 36.153 .713 .481 18.590 .602 .327 10.212 .543 .295 7.514 .653 .394 13.365 .639 .376 12.436 .641 .378 12.560 .508 .217 6.271 .550 .264 7.825 .752 .541 23.370 .752 .542 23.490 .692 .450 16.558 .691 .448 16.437 .627 .359 11.656 .561 .276 8.253 .583 .303 9.272 .595 .318 9.868 .647 .386 12.934 .758 .551 24.277 1985 (.) 324 300 328 100 238 400 320 800 579 900 337 000 393 700 321 500 461 900 222 700 208 200 215 600
.
.
t dw 4.926 1.497 2.982 1.210 2.413 1.204 5.624 1.628 3.879 1.593 8.479 1.961 5.220 1.854 4.768 1.866 6.013 1.529 4.312 1.639 3.196 1.687 2.741 1.661 3.656 1.569 3.527 1.523 3.544 1.559 2.504 1.667 2.997 1.840 4.834 1.908 4.847 2.003 4.069 1.917 4.054 2.034 3.414 1.927 2.873 1.870 3.045 1.911 3.141 1.857 3.596 2.031 4.927 1.979TABLE F
Statistical results of cross-section regressions: Mainland
Literacy GOP 1878 ... 1938 1878 ··· 1963 1878 ··· 1968 1890 ··· 1938 1890 ··· 1950 1900 ··· 1938 1900 ··· 1955 1900 ··· 1960 1900 ··· (*) 1985 1911 ··· 1938 1911 ··· 1947 1911 ... 1966 1911 ··· 1971 1920 ··· 1947 1920 ··· 1950 1920 ··· 1955 1920 ... 1975 1920 ··· 1980 1920 ... (*) 1980 1930 ··· 1955 1930 ... 1960 1930 ··· 1965 1930 ··· (*) 1985 1940 ... 1960 1940 ··· 1965 1940 ... 1970 1940 ··· 1975 1950 ··· 1975 1950 ... 1980 1950 ··· (*) 1980 1950 ··· (*) 1985 1960 ··· 1980 1960 ... (*) 1980 1960 ··· (*) 1985 GDP- gross domestic product.
r - correlation coefficient Gap 60 85 90 48 60 38 55 60 85 27 36 55 60 27 30 35 55 60 60 25 30 35 55 20 25 30 35 25 30 30 35 20 20 25
1'2 - adjusted coefficient of determination F - F statistic.
t - t statistic.
dro-Durbin-Watson statistic.
(') Gross added value.
r
,.,
F .805 .625 27.685 .603 .321 8.567 .539 .243 6.146 .856 .715 43.681 .704 .464 15.714 .910 .818 77.151 .769 .565 23.084 .744 .526 19.889 .693 .448 14.812 .897 .793 65.980 .769 .566 23.181 .653 .390 11.868 .605 .326 9.221 .731 .506 18.380 .703 .462 15.602 .707 .468 15.946 .595 .314 8.771 .659 .399 12.274 .606 .327 9.272 .779 .583 24.762 .780 .583 24.801 .731 .505 18.346 .747 .531 20.223 .725 .496 17.709 .676 .423 13.439 .619 .344 9.934 .652 .389 9.934 .656 .395 12.119 .733 .508 18.525 .644 .379 11.359 .688 .441 14.389 .834 .676 36.484 .777 .578 24.313 .813 .640 31.242 t dw 5.262 1.396 2.927 1.174 2.479 1.143 8.784 1.880 3.964 1.790 8.784 1.880 4.805 1.863 4.460 1.877 3.849 1.519 8.123 1.808 4.815 1.917 3.445 1.782 3.037 1.715 4.287 1.891 3.950 1.817 3.993 1.834 2.962 1.763 3.503 1.831 3.045 1.000 4.976 2.136 4.980 2.180 4.283 2.043 4.497 1.775 4.208 2.201 3.666 2.057 3.152 1.963 3.152 1.963 3.481 1.973 4.304 2.100 3.370 1.814 3.793 1.852 6.040 2.045 4.931 1.879 5.589 1.870REFERENCES
BOWEN, W. G., «Assessing the Economic Contribution of Education••, in Blaug, M. (ed.),
Eco-nomics of Education 1, Harmondsworth, Penguin Books, 1968.
BOWMAN, M. J. e ANDERSON, C. A., «Concerning the Role of Education in Development» in
Geertz, C., ed.: Old Societies and New States: The Ouest for Modernity in Africa and Asia, Glencoe (Ill.), The Free Press, 1963.
BOWMAN, M. J., «Education and Economic Growth: an Overview» in King, Thimothy (ed.),
Edu-cation and Income, Washington, World Bank Staff Working Paper, July 1980.
CAMERON, R., «A New View of European Industrialization» in Economic History Review, vol. 38, no. 1, February 1985.
CARAMONA, M. H., CONCEIQAO, M. L. e AMORIM, J., Repartir;ao Regional do Pfoduto: Um
Ensaio Para 1970, Lisboa, INE, 1972.
CARVALf-10, R., Hist6ria do Ensino em Portugal, Lisboa, FCG, 1986
DENISON, E. F., Why Growth Rates Differ. Postwar Experience in Nine Western Countries,
Washington D. C., Brookings, 1967,
EASTERLIN, R., «Why Isn't the Whole World Developed» in Journal of Economic History,
vol. 41, no.1, March 1981.
GODINHO, V. M., Prix et monnaies aux Portugal: 1750-1850, Paris, Armin Colin, 1955.
HANLEY, S. B., «The Relationship of Education and Economic Growth: The case of Japan» in Tortella ed.(1990).
JUSTINO, D., «A evoiUI;:ao do produto nacional bruto em Portugal, 1850-1910 - Algumas
estimativas provis6rias», in Analise Social, vol. XXIII, n.Q 97, 1987. - - A Formar;ao do Espar;o Econ6mico Nacional, Lisboa, Vega,1988 (2 vols.).
- - «Pregos e salarios em Portugal (1850-1912)» in Hist6ria Econ6mica, n.Q 2, Lisboa, Banco de Portugal, 1989.
KUZNETS, S., «International Differences in Income Levels» in Economic Change (selected
es-says on business cycles national income and economic growth), London, William Heinman, ltd., 1954.
- - Modern Economic Growth. Rate, Structure and Spread, New Haven, Yale University Press, 1987.
LAINS, P., «A evoluc;ao da agricultura e da industria em Portugal (1850-1913): uma interpretac;ao quantitativa» in Hist6ria Econ6mica, n.Q 1, Lisboa, Banco de Portugal, 1990.
--«Foreign Trade and Economic Growth in the European Periphery: Portugal, 1851-1913», Ph. D. thesis presented at the European University Institute, Florence, 1992.
LOUREIRO, M. Santos, «As assimetrias espaciais de crescimento no continente portugues», Estudos, n.Q 4/5, n/d.
MADDISON, Angus, Dynamic Forces in Capitalist Development - a long run comparative view,
Oxford University Press, 1991.
MATA, E., «As Financ;as publicas portuguesas da Regenerac;ao
a
Primeira Guerra Mundial», Ph.D. Thesis presented at the Institute of Economics, Technical University of Lisbon, 1985. - - Cambios e Polftica Cambial na Economia Portuguesa 1891-1931, Lisboa, Sa da Costa, 1987. MATA, E. e VALERIO N., «Finances publiques et structure de I'Etat au Portugal, 1851-1988» paper presented at C 48 section at the International Economic History Congress, Leuven, 1990. MIRONOV, B. N., «The Effect of Education on Economic Growth: The Russian Variant, 19th-20th
centuries» in Tortella, Gabriel, ed. (1990).
MONICA, M. Filomena, Educar;ao e Sociedade no Portugal de Salazar (A Escola Primaria
Salazarista 1926-1939), Lisboa, GIS/Presenc;a, 1978.
NUNES, A. B.; MATA, E. e VALERIO, N., «Portuguese economic growth 1833-1985», in The
Jour-nal of European Economic History, vol. 18, no. 2, 1989.
NUNES, A. B., «Populac;ao activa e actividade econ6mica em Portugal dos finais do sEkulo XIX
a
actualidade - Uma contribuic;ao para o estudo do crescimento econ6mico portugues», Ph.
D. Thesis presented at the Institute of Economics, Technical University of Lisbon, 1989.
- - «A evoluc;ao da estrutura sexual da populac;ao activa em Portugal - Urn indicador do
crescimento econ6mico (1890-1981)». in Analise Social, vol. xxv1, n.Q 112-113, 1991. NUNEZ, C.- E., «Literacy and Economic Growth in Spain,1860-1977» in Tortella ed.(1990).