First-Year Evaluation of Mexico
’
s Tax on
Nonessential Energy-Dense Foods: An
Observational Study
Carolina Batis1,2, Juan A. Rivera1, Barry M. Popkin3, Lindsey Smith Taillie3*
1Center for Nutrition and Health Research, National Institute of Public Health, Cuernavaca, Morelos, Mexico,2National Council for Science and Technology CONACYT, Mexico City, Mexico,3Department of Nutrition, Gillings School of Global Public Health, Carolina Population Center, University of North Carolina, Chapel Hill, Chapel Hill, North Carolina, United States of America
Abstract
Background
In an effort to prevent continued increases in obesity and diabetes, in January 2014, the Mexican government implemented an 8% tax on nonessential foods with energy density
275 kcal/100 g and a peso-per-liter tax on sugar-sweetened beverages (SSBs). Limited rigorous evaluations of food taxes exist worldwide. The objective of this study was to exam-ine changes in volume of taxed and untaxed packaged food purchases in response to these taxes in the entire sample and stratified by socioeconomic status (SES).
Methods and Findings
This study uses data on household packaged food purchases representative of the Mexican urban population from The Nielsen Company’s Mexico Consumer Panel Services (CPS). We included 6,248 households that participated in the Nielsen CPS in at least 2 mo during 2012–2014; average household follow-up was 32.7 mo. We analyzed the volume of pur-chases of taxed and untaxed foods from January 2012 to December 2014, using a longitudi-nal, fixed-effects model that adjusted for preexisting trends to test whether the observed post-tax trend was significantly different from the one expected based on the pre-tax trend. We controlled for household characteristics and contextual factors like minimum salary and unemployment rate. The mean volume of purchases of taxed foods in 2014 changed by -25 g (95% confidence interval = -46, -11) per capita per month, or a 5.1% change beyond what would have been expected based on pre-tax (2012–2013) trends, with no corresponding change in purchases of untaxed foods. Low SES households purchased on average 10.2% less taxed foods than expected (-44 [–72,–16] g per capita per month); medium SES households purchased 5.8% less taxed foods than expected (-28 [–46,–11] g per capita per month), whereas high SES households’purchases did not change. The main limitations of our findings are the inability to infer causality because the taxes were implemented at the national level (lack of control group), our sample is only representative of urban areas, we a11111
OPEN ACCESS
Citation:Batis C, Rivera JA, Popkin BM, Taillie LS (2016) First-Year Evaluation of Mexico’s Tax on Nonessential Energy-Dense Foods: An Observational Study. PLoS Med 13(7): e1002057. doi:10.1371/ journal.pmed.1002057
Academic Editor:Nicholas J Wareham, University of Cambridge, UNITED KINGDOM
Received:January 18, 2016
Accepted:May 19, 2016
Published:July 5, 2016
Copyright:© 2016 Batis et al. This is an open access article distributed under the terms of the
Creative Commons Attribution License, which permits unrestricted use, distribution, and reproduction in any medium, provided the original author and source are credited.
Data Availability Statement:The data used in this study is proprietary data purchased from The Nielsen Company. This dataset cannot be shared without permission of the vendor per our contractual agreement. The request for data can be directed to
http://www.nielsen.com/us/en/contact-us.html. We complement our analysis by using data from the National Institute of Statistics, Geography and Informatics (INEGI) monthly manufacturer’s industry survey and Euromonitor International’s Passport Global Market. INEGI is a publicly available data set:
only have 2 y of data prior to the tax, and, as with any consumer panel survey, we did not capture all foods purchased by the household.
Conclusions
Household purchases of nonessential energy-dense foods declined in the first year after the implementation of Mexico’s SSB and nonessential foods taxes. Future studies should evaluate the impact of the taxes on overall energy intake, dietary quality, and food purchase patterns (seeS1 Abstractin Spanish).
Author Summary
• Why Was This Study Done?
In January 2014, Mexico passed an 8% tax on nonessential foods with energy density
275 kcal/100 g, including salty snacks, chips, cakes, pastries, and frozen desserts; and a 1 peso/liter (~10%) tax on sugar-sweetened beverages.
To date, there has been very limited research as to how larger health-related food/ beverage taxes change household food purchases, or whether low socioeconomic sta-tus (SES) households are more responsive to such taxes.
• What Did the Researchers Do and Find?
Using a dataset that follows household food purchases over time, we examined whether the volume of taxed foods showed greater declines in the post-tax period than we would have expected based on trends in the volume of taxed food purchases prior to the tax. We also examined whether post-tax changes in the volume of taxed food purchases was greater among low SES households.
We found that the mean volume of purchases of taxed foods in 2014 declined by 25 g per capita per month, or a 5.1% change beyond what would have been expected based on pre-tax (2012–2013) trends.
There were no changes in the purchase of untaxed foods in the post-tax period.
Low SES households’purchases of taxed foods declined by 10.2% and medium SES households by 5.8%, whereas high SES did not change.
• What Do These Findings Mean?
These findings show that in the post-tax period, purchases of taxed foods declined more than we would expect if pre-tax trends had simply continued, particularly among low and medium SES households. Future research should explore how these shifts are linked to changes in the nutritional quality of the overall diet.
accessed only by subscribers, but many universities and many other institutions worldwide have access to it. These descriptive tables can be accessed in Supporting Information filesS4 TableandS5 Table.
Funding:This support comes primarily from Bloomberg Philanthropies (grants to UNC and CINsY INSP), with support from the NIH R01DK108148, Robert Wood Johnson Foundation (Grant 71698), and the Carolina Population Center and its NIH Center grant (P2C HD0550924). The funders had no role in the study design or the analysis and interpretation of the data. All authors and their institutions reserve intellectual freedom from the funders.
Competing Interests:CB, BMP, and LST have declared that no competing interests exist. JAR reported that he has received personal fees from a private company (Tres Montes Lucchetti) for a role as an advisor on the design, implementation and evaluation of an obesity prevention program in primary schools conducted by two Universities in Guadalajara (ITESO and UDG) in the State of Jalisco. JAR also received a research grant from Danone Mexico to study the intake of milk and dairy in Mexico, but received no honorarium.
Introduction
Currently, the prevalence of overweight and obesity in Mexico is over 33% for children and about 70% for adults [1,2], and, in 2006, the prevalence of type 2 diabetes in adults was 14.4% [3]. Concurrent with the rise in obesity and diabetes were large increases in sugar-sweetened beverage (SSB) and nonessential energy-dense food (often termed“junk food”) intake [4–7]. Worldwide, Mexico is the fourth largest per-capita consumer of energy-dense, ultraprocessed food and drinks, including SSBs, sweet and savory snacks, breakfast cereals, confectionery, ice cream, biscuits, spreads, sauces, and ready-meals [8]. To prevent contin-ued increases in obesity and diabetes, in January 2014, the Mexican government imple-mented a 1 peso-per-liter tax on SSBs (equivalent to approximately 10% tax) and an 8% tax on nonessential foods with energy density275 kcal/100 g. In Mexico, total prices including the tax price are included on the shelf label, so the price consumers see includes the tax. The law defined nonessential foods in the following categories: chips and snacks, candies and sweets, chocolate, puddings, peanut and hazelnut butters, ice cream and ice pops, and cereal-based products with substantial added sugar. Based on the 2012 National Health and Nutrition Survey (ENSANUT), the intake of non-basic foods high in sugar or fat (a food classification similar to the tax) contributes 11% to 18% of daily caloric intake across age groups [9].
Worldwide, there is very limited empirical evidence on the effect of food/nutrient taxes [10,11]. While analysis of Mexican food and beverage taxes revealed that during 2014 pur-chases of taxed beverages declined 6% beyond what was expected compared to pre-existing trends, it is unclear whether taxed food purchases also declined, or whether households of lower socioeconomic status (SES) were more or less responsive.
Because both the nonessential energy-dense food and the SSB taxes were implemented con-currently, we cannot evaluate the independent effect of each. Therefore, the objective of the current work was to longitudinally examine changes in the volume of taxed and untaxed food purchases after both taxes were implemented, relative to the counterfactual (i.e., expected vol-ume of taxed and untaxed food purchases if the taxes had not been implemented), overall and by SES subgroups.
Methods
Participants
This study uses data on volume of household food purchases from January 2012 to December 2014 from The Nielsen Company’s Mexico Consumer Panel Services (CPS). The analysis used de-identified data and was granted an exemption from the University of Chapel Hill and National Institute of Public Health (INSP) institutional review boards. Enumerators visit par-ticipating households every 2 wk to collect diaries of purchases and receipts and register pur-chases by checking the pantry and a designated bin where the household members keep empty product packages. All items available with a barcode are scanned by the enumerator. The data for each purchase includes number of units, volume, price paid, and date of purchase.
Nielsen CPS samples households from 53 cities with>50,000 inhabitants and estimates weights for each household so that the sample is representative of the urban Mexican population.
Covariates
SES categories were based on those provided by The Nielsen Company, which are defined with a score system that classifies households in seven categories as proposed by the Mexican Asso-ciation of Market Intelligence and Opinion. This measure of SES was validated and is the stan-dard one used in market research in Mexico. The score considers the education level of the member with the largest household income contribution and seven household assets: number of rooms, type of floor, number of bathrooms, shower, gas range, number of light bulbs, and number of cars. The cutoff points for the seven categories are defined a priori to capture spe-cific household characteristics and are not based on a population distribution; therefore, the sample in each category is not equal (e.g., the extreme categories combined have<10% of the sample). We classified SES as low (lower two categories), medium (middle three categories), and high (higher two categories). Additional variables include household composition (nine variables, each with the number of household members that were within each gender/age group [as presented inS1 Table]) and contextual measures (state-quarter unemployment rates [12] and minimum salary [13] adjusted by state-quarter consumer price index). SeeS1 Table
for descriptive statistics on the sample.
Food Categories
In this paper, we focus on volumes of overall taxed and untaxed foods and on subcategories of each. Classification of foods into untaxed and taxed categories was conducted by a team of reg-istered dietitians from Mexico. In the case of law ambiguities for food classification, we con-sulted with the Ministry of Finances for clarification. For further description of each subcategory and the food classification process, seeS2 Table.
Our analysis does not cover all food categories that households purchase; we did not include categories for which Nielsen CPS does not collect data or did not collect data consistently throughout the 36 months of the analysis. Examples of food categories not analyzed are choco-lates, candies, and sweet bread from bakeries (taxed if energy density275 kcal/100 g, though small bakeries were exempt from the tax in 2014), and unpackaged produce, tortillas, and unsweetened bread from bakeries (mainly untaxed).
Statistical Analysis
All analyses were conducted in Stata, version 13 (College Station, TX). We first describe unad-justed, mean per capita volume purchases of taxed and untaxed foods (g/capita/month) from January 2012 to December 2014. Because the tax was implemented at one point in time across the entire country and, hence, we did not have a control population, we compared the pur-chases before and after the tax. Our pre-specified analytical strategy was based on the approach used by Colchero et al. in evaluating Mexico’s SSB tax [14] and in other research using longitu-dinal food purchase data to evaluate the effects of retailer- and industry-led initiatives, such as the United States Healthy Weight Commitment effort to reduce calories in the food supply [15,16]. Specifically, to account for the ongoing 2012–2013 trend, and to avoid assuming a decrease in purchases in 2014 was attributable to the tax if there was already a downward trend, we extrapolated with model predictions the 2012–2013 trend through 2014 and used it as our counterfactual (i.e., what was expected to happen without a tax in 2014 based on the 2012–2013 trend). We used a fixed effects model to predict the mean adjusted volume pur-chased in each month pre-tax, post-tax observed, and post-tax counterfactual. More detail about this pre-specified analytical strategy and deviations from this strategy are summarized in
The model specification was as follows:
Foodhmy¼aþbTTmyþbSSmyþbTSðTmy S
myÞ þbyYyþUHhyþCmyþlhþmhmy Equation 1
The unit of analysis (g/capita/month) was the per capita volume ofFoodpurchases in householdh, monthm, and yeary.Tis the post-tax period (0 = 2012–2013; 1 = 2014),Sis 2nd semester (0 = Jan–Jun; 1 = Jul–Dec),Yis year (a continuous measure, 0 = 2012; 1 = 2013; 2 = 2014),Hdenotes the vector of year-specific household characteristics (SES and household composition),Cdenotes the vector of contextual measures (unemployment rates and mini-mum salary), andλandμare the error terms. The year slope reflects the change between 2012 and 2013 (not the change from 2012 through 2014, because the model is adjusting by post-tax period). Likewise, the post-tax coefficient estimates the change in 2014 beyond what was pre-dicted in 2014 given the 2012–2013 slope. To assess changes within the year, we included a semester effect. We tried 2-, 3-, and 4-month periods, but due to high month-to-month varia-tion and an unclear cyclic annual pattern in 2012’s and 2013’s purchases using shorter periods, we used a semester period (the second semester was always higher than the first in 2012 and 2013 for both taxed and untaxed foods). Regardless of the period length used in the model, the annual change remained unchanged. TheTSinteraction term allowed the semester effect to vary before and after the tax. Additionally, we controlled for the aforementioned household and contextual covariates.
Using this model, we predicted the mean adjusted volume purchased in each month pre-tax (2012–2013), post-tax observed (2014), and post-tax counterfactual (2014 but as ifT= 0) to determine the absolute and relative differences over time. We present the predictions in the results section and regression coefficients inS3 Table.
Because the food purchase data had a skewed distribution, we tested a generalized linear model with log-link, which gives unbiased estimates [17]. Results from either a generalized lin-ear model with log-link or a linlin-ear regression model were similar; hence, we used a linlin-ear regression to be able to use a fixed effects estimator. Fixed effects are advantageous because they control for unobservable time-invariant characteristics. We conducted this analysis sepa-rately for the taxed and untaxed categories in the entire sample.
We then performed analyses stratified by SES (low, medium, high) using the same specifica-tion asEq 1but without SES as a predictor variable. Stratified models allowed us to compare not only the tax effect, but also the absolute amount of purchases in each SES category. The SES coefficients inEq 1estimate the difference in the amount of purchases if a household changes SES category (intra-household), whereas our interest was on the difference in the amount of purchases across households with different levels of SES (inter-household).
Nearly all households purchased some food from untaxed (99.7% of households) and taxed (96%) foods each month. However, for subcategories, there was a large proportion of non-con-sumers. As a result, we used a two-part model [18] using probit and linear regression models with the same specification as above, except that the fixed effects estimator was not used.
The two-part model was as follows: Total amount of food subcategory purchase (g/capita/ month) = [Probability of food subcategory purchase (probability/month)][Amount of food subcategory if purchased (g/capita/month)]
FoodSubhmy¼PrðFoodSubhmy>0Þ ½FoodSubhmyjPrðFoodSubhmy>0Þ
PrðFoodSubhmy>0Þ ¼aþbTTmyþbsSmyþbTSðTmySmyÞ þbyYyþUHhyþCmyþmhmy
FoodSubhmyjPrðFoodSubhmy>0Þ ¼aþbTTmyþbsSmyþbTSðTmySmyÞ þbyYyþUHhyþCmyþmhmy
In all analyses, we used the household weights provided by Nielsen and estimated standard errors via bootstrapping by drawing 1,000 random samples with replacement with selection at the household level.
Results
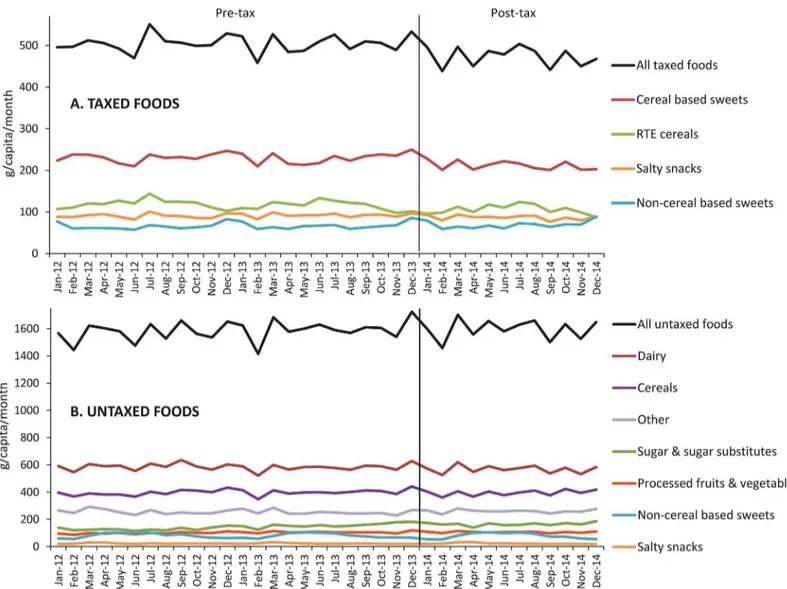
Fig 1shows the unadjusted mean volume trends for total taxed and untaxed food purchases and by subcategory. The 2012–2013 average of total volume of taxed food purchases was 505 g/ capita/month, whereas the 2014 average was 474 g/capita/month, while the averages of total untaxed foods were 1,585 g/capita/month in 2012–2013 and 1,596 g/capita/month in 2014. As can be seen, purchases have high month-to-month variation.
Table 1shows the adjusted absolute and relative differences between the counterfactual and observed volumes purchased in the post-tax period. On average, the total volume of taxed pur-chases had an absolute decline of 25 g per capita per month (p<0.05), or a -5.1% relative change beyond what would have been expected based on pre-tax trends. The decline in volume
Fig 1. Monthly trends in unadjusted volume purchased (g/capita/month) of (A) taxed and (B) untaxed foods. Source: Authors’own analyses and
calculations based on data from Nielsen through its Mexico Consumer Panel Service (CPS) for the food and beverage categories for January 2012–
December 2014.
of taxed purchases was 3.4% in the first semester of 2014 but growing to 6.7% in the second semester.
As can be seen inFig 2, the effect during the second semester was larger because, based on previous trends, the purchases were expected to increase in the second semester, but they remained stable throughout 2014. No differences were detected for untaxed purchases.
Overall, low SES households bought less taxed food before and after the tax compared to their higher SES counterparts but showed the greatest response to the tax (Table 1,S1 Fig). On average, in 2014, low SES households purchased 10.2% less taxed foods than expected
(p<0.05), whereas medium SES households purchased 5.8% less taxed foods (p<0.05), and high-income households’purchases did not change.Table 2(S2andS3Figs) shows the Table 1. Monthly average of predicted volume purchased (g/per capita) for taxed and untaxed food purchases.
Taxed Untaxed Post-Tax Counterfactual (g/ capita/month) Post-Tax Observed (g/ capita/month) Observed vs. Counterfactual Post-Tax Counterfactual (g/ capita/month) Post-Tax Observed (g/ capita/month) Observed vs. Counterfactual Absolute Difference (g/ capita/month) % Difference Absolute Difference (g/ capita/month) % Difference
Mean (95% Confidence Interval) All
Jan–
Jun 2014 484 (467, 501) 467 (453, 482)
-16 (-30, -3) -3.4% 1553 (1508, 1598) 1559 (1520,
1599) 6 (-27, 40) 0.4%
Jul–
Dec 2014 500 (482, 517) 466 (452, 480)
-34 (-48, -19) -6.7% 1585 (1539, 1631) 1568 (1527,
1609) -17 (-53, 20) -1% All
2014 492 (475, 509) 467 (453, 480)
-25 (-38, -12) -5.1% 1569 (1524, 1614) 1564 (1525,
1602) -5 (-38, 27) -0.3% Low SES
Jan–
Jun 2014 430 (394, 466) 392 (367, 416)
-38 (-66, -10) -8.9% 1248 (1163, 1332) 1245 (1177,
1312) -3 (-63, 57) -0.2% Jul–
Dec 2014 437 (401, 474) 387 (361, 413)
-50 (-80, -20) -11.5% 1289 (1202, 1375) 1251 (1178,
1323) -38 (-103, 28) -2.9% All
2014 434 (398, 469) 389 (365, 413)
-44 (-72, -16) -10.2% 1268 (1184, 1353) 1248 (1180,
1315) -20 (-79, 38) -1.6% Medium
SES Jan–
Jun 2014 480 (457, 504) 461 (442, 480)
-19 (-37, -2) -4.1% 1557 (1493, 1620) 1533 (1483,
1583) -24 (-73, 26) -1.5% Jul–
Dec 2014 503 (477, 528) 465 (447, 483)
-37 (-58, -17) -7.5% 1591 (1527, 1654) 1542 (1488,
1596) -49 (-101, 4) -3.1% All
2014 491 (467, 515) 463 (446, 480)
-28 (-46, -11) -5.8% 1574 (1511, 1636) 1537 (1488,
1587) -36 (-83, 11) -2.3% High SES
Jan–
Jun 2014 564 (527, 602) 560 (530, 590) -4 (-31, 23) -0.8% 1902 (1813, 1991) 1946 (1865,2027) 44 (-32, 120) 2.3% Jul–
Dec 2014 573 (533, 613) 551 (521, 580) -22 (-51, 6) -3.9% 1919 (1827, 2011) 1957 (1876,2038) 38 (-43, 120) 2% All
2014 569 (531, 607) 555 (527, 584) -13 (-39, 12) -2.3% 1911 (1821, 2000) 1952 (1874,2029) 41 (-32, 115) 2.2% Source: Authors’own analyses and calculations based on data from Nielsen through its Mexico Consumer Panel Service (CPS) for the food and beverage
categories for January 2012–December 2014.
Bold numbers:p<0.05
subcategories of taxed and untaxed food purchases from the two-part model. The total amount purchased is estimated by multiplying the probability of any purchase during a month by the amount purchased in months with purchases higher than zero. InTable 2, we present the pre-dicted probability, amount, and total, whereas inS2andS3Figs, we only present the total. The greatest changes in total purchases were observed among taxed salty snacks (-6.3% beyond expected,p<0.05) and taxed cereal-based sweets (-5.2% beyond expected,p<0.05), while taxed non-cereal-based sweets and ready-to-eat cereals did not change. Interestingly, in the case of taxed salty snacks, what drove the overall change was a change in the probability of purchasing.
Among untaxed foods, there were only significant declines in the volume of sugar and sugar substitutes purchased compared to what was expected based on the pre-tax trend (-8.9%,
Table 2. Monthly average of predicted volume purchased (g/per capita) for the post-tax taxed and untaxed food subcategories.
Probability Amount Total
Post-Tax Counterfactual (Probability/ Month) Post-Tax Observed (Probability/ Month)
Observed vs. Conterfactual Post-Tax Counterfactual (g/ capita/month) Post-Tax Observed (g/ capita/ month) Observed vs. Conterfactual Post-Tax Counterfactual (g/ capita/month) Post-Tax Observed (g/ capita/ month) Observed vs. Conterfactual Absolute Difference (Probability/ Month) Percent Difference Absolute Difference (g/ capita/ month) Percent Difference Absolute Difference (g/ capita/ month) Percent Difference
Mean (95% Confidence Interval)
Taxed
Salty snacks 0.78 (0.76, 0.79) 0.72 (0.71, 0.74)
-0.05 (-0.06, -0.04)
-6.5% 123 (116, 130) 124 (118, 129)
0 (-5, 6) 0.4% 94 (88, 100) 88 (84, 93) -6 (-11, -1) -6.3%
Cereal-based sweets
0.87 (0.86, 0.88) 0.84 (0.84, 0.85)
-0.02 (-0.03, -0.01)
-2.7% 267 (254, 279) 260 (251, 269)
-7 (-16, 3) -2.5% 230 (219, 242) 218 (210, 227)
-12 (-21, -3) -5.2%
Ready-to-eat cereals
0.56 (0.54, 0.58) 0.54 (0.53, 0.55)
-0.02 (-0.04, -0.01)
-4% 210 (200, 219) 215 (208, 222)
5 (-4, 14) 2.5% 119 (112, 126) 117 (112, 122)
-2 (-8, 4) -1.6%
Non-cereal-based sweets
0.52 (0.5, 0.54) 0.49 (0.48, 0.51)
-0.03 (-0.04, -0.01)
-5.1% 138 (131, 145) 143 (138, 149)
6 (-1, 12) 4.2% 71 (66, 75) 70 (67, 73) -1 (-5, 3) -1.2% Untaxed
Sugar and sugar substitutes
0.37 (0.35, 0.39) 0.35 (0.34,
0.36) -0.02 (-0.04,0.00)
-5.9% 496 (464, 528) 481 (455,
507) -15 (-50, 20) -3.1% 182 (167, 198) 166 (154,178) -16 (-31, -1) -8.9% Cereals 0.94 (0.93, 0.94) 0.94 (0.93,
0.94)
0.00 (-0.01, 0.01)
0.0% 439 (423, 455) 436 (424, 447)
-4 (-17, 10) -0.8% 410 (394, 426) 406 (395, 418)
-3 (-16, 10) -0.8% Dairy 0.96 (0.95, 0.96) 0.95 (0.95,
0.96)
0.00 (-0.01, 0.00)
-0.5% 595 (572, 618) 603 (586, 620)
8 (-10, 27) 1.4% 569 (545, 592) 574 (557, 591)
5 (-13, 24) 0.9% Processed
fruits and vegetables
0.46 (0.44, 0.48) 0.47 (0.45, 0.48)
0.01 (-0.01, 0.02)
1.8% 245 (227, 263) 247 (236, 259)
2 (-11, 15) 0.9% 116 (105, 127) 119 (111, 127)
3 (-5, 11) 2.6%
Salty snacks 0.33 (0.32, 0.35) 0.32 (0.31, 0.33)
-0.02 (-0.03, 0.00)
-5.0% 68 (63, 73) 73 (70, 76) 5 (1, 10) 7.7% 22 (20, 24) 23 (21, 24) 1 (-1, 2) 2.7%
Non-cereal-based sweets
0.39 (0.37, 0.41) 0.39 (0.38, 0.4)
0.00 (-0.01, 0.02)
0.5% 203 (187, 219) 217 (206, 227)
14 (-2, 29) 6.7% 80 (73, 88) 86 (81, 91) 6 (-2, 13) 7.2% Other 0.85 (0.84, 0.86) 0.86 (0.85,
0.86)
0.01 (-0.01, 0.02)
0.6% 290 (279, 301) 311 (302, 320)
21 (11, 30) 7.2% 245 (234, 255) 264 (256, 272)
19 (11, 28) 8.0%
Bold numbersp<0.05
Source: Authors’own analyses and calculations based on data from Nielsen through its Mexico Consumer Panel Service (CPS) for the food and beverage categories for January 2012–December 2014.
in 2014, but was smaller than expected (seeS3 Fig). Purchases of the food group“other”
increased by 8.0% (p<0.05).
Discussion
For the first full year after Mexico’s taxes on SSBs and nonessential energy-dense food taxes, we find significant changes in the observed per capita volume of household purchases of taxed foods compared to the counterfactual (i.e., what was expected based on pre-tax trends). Over-all, we find that taxed foods declined by 25 g/capita/month (-5.1%), whereas untaxed food pur-chases did not change (-0.3%). Moreover, we find much larger declines for lower SES
households (-10.2%), whereas medium SES households changed by 5.8% and high SES house-holds did not change.
Empirical evidence on the effect of food and nutrient taxes is limited. With regards to Den-mark’s short-lived saturated fat tax, one study of household food purchases found a 10%–15% reduction in purchases of butter, blends, margarines, and oils in the first 9 mo of implementa-tion, when the increase in price of these products was 8%–22% [10]. A recent evaluation using cruder expenditure data from an income and expenditure national survey of the Hungarian tax on foods high in salt, sugar, or caffeine found a 3.4% decrease in the volume purchased of pro-cessed foods after the tax, with no corresponding change in unpropro-cessed foods [11], though these processed food categories were not necessarily reflective of taxed versus untaxed foods. The present results show that, at least in Mexico, a relatively modest tax can, in the short run, result in a substantial decline in volume purchased of taxed foods. However, it is important to consider that taxes could affect purchases with other mechanisms in addition to the increase of price. Press coverage or public discussion of the tax can help discourage the consumption of the taxed products in the population; but, for the nonessential energy-dense tax in Mexico, the coverage has been small relative to the SSB tax [19,20]. On the other hand, the presence of the SSB tax could have had an effect on the purchases of nonessential energy dense foods, because these items might be complementary and consumed together. Previous estimations of SSB own and cross-price elasticities in Mexico reported that for a 1% increase in the price of SSB, the purchase of candies and snacks would decrease 0.44% and 0.23%, respectively, and that for a 1% increase in the price of candies and snacks, these would decrease 1.15% and 0.98%, respec-tively [21]. Therefore, it is likely that the decrease we found in taxed foods is due to both the SSB and the nonessential energy-dense food taxes.
The reduction of 25 g/capita/month represents 70 to 110 kcal (energy density is at least 275 kcal/100 g, but based on the ENSANUT 2012, the mean energy density for the intake of taxed foods is 430 kcal/100 g). Although in absolute terms this reduction is small, the purchases cap-tured in Nielsen only represent a fraction of all household purchases, and real absolute change in energy intake from taxed food might be larger.
The changes in taxed foods were for salty snacks and cereal-based sweets. Interestingly, for salty snacks, all the change was due to changes in probability of purchasing, suggesting that, for this item, people prefer to decrease the frequency of purchases rather than the amount. More-over, we saw smaller-than-expected increases in the volume of sugar and sugar substitutes, sug-gesting that households are not necessarily substituting sugary home-prepared foods or beverages for pre-packaged taxed sweets.
their income. In other countries such as the US, where obesity prevalence is highest among people with low SES, a similar response to such a tax could lead to decreased disparities in diet and obesity. Long-term effects must be monitored, as we expect the industry to develop strate-gies in response to the tax, including product reformulation. For example, in the jam and spreads categories, we found that in 2014, a number of products were reformulated to fall under the 275 kcal/100 g threshold. The authors of the evaluation of Hungary’s junk food tax also reported that a sizable proportion (40%) of Hungary’s food manufacturers reported refor-mulating products to avoid taxation [11].
A great complexity of implementing a food tax is to define the characteristics of the foods subject to it. If only selected unhealthy foods are taxed, individuals can substitute with other unhealthy untaxed foods; on the other hand, if the tax categorization is too broad, many rela-tively healthy products will also be affected, increasing the cost of food without the public health benefit [24,25]. Overall, this tax successfully targeted unhealthy foods, as it focused on processed foods and did not disincentive traditional cooking ingredients such as sugar and fats (a criticism the Danish fat tax has received) [26]. However, the use of a single energy-dense cut-point in the Mexican tax without other nutritional attributes left out foods that are other-wise considered unhealthy (e.g., most ice creams were untaxed), whereas foods like peanuts and nuts were taxed. Moreover, sorting products out into“essential”versus“nonessential”is an iterative process, and throughout 2014 there were clarifications on the initial law ambigui-ties, representing about 2.3% of all products (seeS2 Table). In contrast, new Chilean controls on food marketing that will go into effect July 1, 2016, uses as a cutoff not only energy but also sodium, saturated fat, and total sugar for foods and beverages separately [27]. An additional complexity of analyzing the Mexican tax is that each producer interprets the law and deter-mines the total amount they have to pay (without reporting for which products they are pay-ing). Thus, we cannot be certain which exact products were actually taxed.
This work had several important limitations. First, we were unable to capture and analyze all foods that households purchased, including unpackaged produce, chocolates, candies, torti-lla, and bread from bakeries. However, even for foods that were collected consistently in the Nielsen CPS, we captured only 474 g/capita/month of taxed foods in 2014. This is lower than what we would expect an average person to purchase, particularly if we compare to Euromoni-tor retail sales of 1,236 g/capita/month (excluding chocolates and bread from bakeries) or to the National Institute of Statistics and Geography’s (INEGI’s) manufacturer’s industry survey of 1245 g/capita/month (excluding chocolate) (S4andS5Tables). Similar to other consumer panel surveys, it is expected that purchases from Nielsen CPS would be lower, because INEGI’s data is of total sales (including food services and exports), and also because Euromonitor and INEGI use aggregate food categories that include untaxed items. Still, we are missing some amount of food purchases, most likely items purchased and consumed away from home. It is possible that the items not captured in the Nielsen dataset have a different trend than that found in our results. However, as can be seen inS4andS5Tables, INEGI’s and Euromonitor’s sales also display a decrease of 4.2% to 6.2% compared to 2013 for taxed foods and no change or slight increase for untaxed foods.
interest; however, we do not have data before 2012 to use as a comparison and to be able to assess this. Finally, our sample was only representative of urban Mexican households in cities with more than 50,000 inhabitants. This sample represents 63% of the Mexican population and 75% of food and beverage expenditures [29], but we do not know if rural households responded differently to these taxes. Regardless, this study provides the first snapshot of overall trends in food purchasing a year after the nonessential food tax was passed. Future work will extend this analysis by examining changes in the nutrient profile of nonessential foods in response to this tax, including sugar, saturated fat, energy density, and sodium.
Conclusion
This evaluation of Mexico’s nonessential food and SSB taxes shows that the volume of taxed food purchases declined over what was expected, and that these results were similar in direc-tion and magnitude to declines in SSBs in response to the SSB tax. Declines after the tax were statically significant among low and medium SES households and for selected food subcatego-ries (salty snacks and cereal-based sweets). Our results can orient Mexican policymakers, who every year decide on the continuation of the tax, as well as policymakers from others countries currently considering the implementation of foods taxes. However, the impact of this tax on overall energy intake, dietary quality, and food purchase patterns, as well as how these changes relate to weight status, remains to be studied.
Supporting Information
S1 Abstract. Spanish abstract. (DOCX)S1 Fig. Monthly trends in predicted volume purchased (g/capita/month) of (A) taxed and (B)
untaxed foods comparing to post-tax counterfactual by SES. (DOCX)
S2 Fig. Monthly trends in predicted total volume purchased (g/capita/month) of taxed food
subcategories: (A) salty snacks, (B) cereal-based sweets, (C) ready-to-eat cereals, (D) non-cereal-based sweets.
(DOCX)
S3 Fig. Monthly trends in predicted total volume purchased (g/capita/month) of untaxed food
subcategories: (A) sugar and sugar substitutes, (B) cereals, (C) dairy, (D) processed fruits and vegetables, (E) salty snacks, (F) non-cereal-based sweets, (G) other.
(DOCX)
S1 Protocol. Summary of the pre-specified analysis plan and deviations. (DOCX)
S1 Table. Weighted sample characteristics of Mexico Nielsen Consumer Panel Service by year.
(DOCX)
S2 Table. Examples of food items for each food subcategory and details on food classifica-tion process.
(DOCX)
S4 Table. National sales of mainly taxed foods in 2014 and percent change in sales from previous years reported by INEGI and Euromonitor.
(DOCX)
S5 Table. National sales of mainly untaxed foods in 2014 and percent change in sales from previous years reported by INEGI and Euromonitor.
(DOCX)
Acknowledgments
We thank Donna Miles for exceptional data management and programming support; Denise Ammons for graphics support; Tania Aburto, Lilia Pedraza, Juan Carlos Salgado, Nancy López Olmedo, and Emily Ford Yoon for excellent research assistance; and Frances L. Dancy for administrative assistance. We thank Shu Wen Ng and Arantxa Colchero for their insight and feedback on the study design and analysis. We also thank and recognize the invaluable contri-butions and reviews by members of our independent evaluation advisory committee.
All tables and figures were produced by authors; the data are owned by The Nielsen Com-pany, 2016. The Nielsen Company is not responsible for and had no role in preparing the results reported herein.
Author Contributions
Conceived and designed the experiments: CB JAR BMP LST. Performed the experiments: CB JAR BMP LST. Analyzed the data: CB LST. Wrote the first draft of the manuscript: CB LST. Contributed to the writing of the manuscript: CB JAR BMP LST. Agree with the manuscript’s results and conclusions: CB JAR BMP LST. All authors have read, and confirm that they meet, ICMJE criteria for authorship.
References
1. Rivera JA, de Cossio TG, Pedraza LS, Aburto TC, Sanchez TG, Martorell R. Childhood and adolescent overweight and obesity in Latin America: a systematic review. Lancet Diabetes Endocrinol. 2014; 2 (4):321–32. doi:10.1016/S2213-8587(13)70173-6PMID:24703050
2. Barquera S, Campos-Nonato I, Hernández-Barrera L, Pedroza A, Rivera-Dommarco JA. Prevalence of obesity in Mexican adults 2000–2012. Salud publica de Mexico. 2013; 55:S151–S60. PMID:24626691
3. Villalpando S, de la Cruz V, Rojas R, Shamah-Levy T, Ávila MA, Gaona B, et al. Prevalence and distri-bution of type 2 diabetes mellitus in Mexican adult population: a probabilistic survey. Salud Pública de Méx. 2010; 52:S19–S26.
4. Stern D, Piernas C, Barquera S, Rivera JA, Popkin BM. Caloric Beverages Were Major Sources of Energy among Children and Adults in Mexico, 1999–2012. J Nutr. 2014; 144(6):949–956. doi:10.3945/ jn.114.190652PMID:24744311
5. Barquera S, Campirano F, Bonvecchio A, Hernández L, Rivera J, Popkin B. Caloric beverage con-sumption patterns in Mexican children. Nutr J. 2010; 9:47–56. doi:10.1186/1475-2891-9-47PMID: 20964842
6. Barquera S, Hernandez-Barrera L, Tolentino ML, Espinosa J, Ng SW, Rivera JA, et al. Energy intake from beverages is increasing among Mexican adolescents and adults. J Nutr. 2008; 138(12):2454–61.
doi:10.3945/jn.108.092163PMID:19022972
7. Hawkes C. Uneven dietary development: linking the policies and processes of globalization with the nutrition transition, obesity and diet-related chronic diseases. Global Health. 2006; 2(1):4.
8. Pan American Health Organization. Ultra-processed food and drink products in Latin America: Trends, impact on obesity, policy implications. 2015.http://www.paho.org/hq/index.php?option=com_ content&view=article&id=11153%3Aultra-processed-food-and-drink-products&catid=4999%3Aactive-living-documents&lang=en
10. Jensen JD, Smed S. The Danish tax on saturated fat–Short run effects on consumption, substitution patterns and consumer prices of fats. Food Policy. 2013; 42(0):18–31.
11. Bíró A. Did the junk food tax make the Hungarians eat healthier? Food Policy. 2015; 54:107–15. 12. Instituto Nacional de Estadística y Geografia, empleo Endoy. Indicadores Estratégicos 2014 [cited July
2015].http://www3.inegi.org.mx/sistemas/temas/default.aspx?s=est&c=25433&t=1.
13. Comisión Nacional de los Salarios Mínimos. Tabla de Salarios Mínimos Generales y Profesionales por áreas geográficas [cited July 2015].http://www.conasami.gob.mx/t_sal_mini_prof.html.
14. Colchero A, Rivera JA, Popkin BM, Ng SW. Beverage purchases from stores in Mexico under the excise tax on sugar sweetened beverages: observational study. BMJ. 2016; 352(h6704).
15. Ng SW, Popkin BM. The Healthy Weight Commitment Foundation Pledge. Am J Prev Med. 47(4):520–
30. doi:10.1016/j.amepre.2014.05.030PMID:25240968
16. Taillie L, Ng S, Popkin B. Gains made by Walmart’s healthier food initiative mirror preexisting trends. Health Affair. 2015; 34(11):1869–76.
17. Manning WG, Mullahy J. Estimating log models: to transform or not to transform? Journal of health eco-nomics. 2001; 20(4):461–94. PMID:11469231
18. Belotti F, Deb P, Manning WG, Norton EC. twopm: Two-part models. Stata Journal. 2015; 15(1):3–20.
19. Donaldson E. Advocating for sugar-sweetened beverage taxation: a case study of Mexico 2015 [Sep-tember 1, 2015].http://www.jhsph.edu/departments/health-behavior-and-society/_pdf/Advocating_ For_Sugar_Sweetened_Beverage_Taxation.pdf.
20. Cooper B. How soda is drawing fire from food in Mexico obesity battle. Just Food. August 24, 2015. [cited 2016 March 25]. http://www.just-food.com/analysis/how-soda-is-drawing-fire-from-food-in-mexico-obesity-battle_id130918.aspx.
21. Colchero M, Salgado J, Unar M, Hernández-Ávila M, Rivera-Dommarco J. Price elasticity of the demand for sugar sweetened beverages and soft drinks in Mexico. Economics & Human Biology. 2015; 19:129–37.
22. Colchero A, Rivera JA, Popkin BM, Ng SW. Beverage purchases from stores since the start of the Mex-ican Sugar-Sweetened Beverage excise tax: A year out. BMJ. 2015;In press.
23. Rivera Dommarco JA, Campos-Nonato I, Barquera Cervera S, Gonzalez de Cossio T. Epidemiología de la obesidad en México: magnitud, distribución, tendencias y factores de riesgo. Obesidad en México: recomendaciones para una política de Estado. Mexico: Universidad Nacional Autónoma de México; 2012.
24. Cash S, Lacanilao RD. Taxing food to improve health: economic evidence and arguments. J Agr Resour Econ. 2007; 36(2):174.
25. Andreyeva T, Long MW, Brownell KD. The impact of food prices on consumption: A systematic review of research on the price elasticity of demand for food. Am J Public Health. 2009; 100(2):216–22. doi:
10.2105/AJPH.2008.151415PMID:20019319
26. Brunner-Brown JA.“Fat Taxes”Fighting Globesity Ignore Food Demand Inelasticities. Ann Surv Int'l & Comp L. 2015; 20(1):13.
27. Popkin BM, Hawkes C. The sweetening of the global diet, particularly beverages: patterns, trends and implications for diabetes prevention. Lancet Diabetes Endocrinol. 2015; 4(2):174–86. doi:10.1016/ S2213-8587(15)00419-2
28. Secretaría de Salud. Estrategia Nacional para la Prevención y el Control del Sobrepeso, la Obesidad y la Diabetes. [National Strategy for the Prevention and Control of Overweight, Obesity and Diabetes] Mexico, D.F.; 2013.
29. Instituto Nacional de Estadística y Geografia. Encuesta Nacional de Ingreso y Gastos de los Hogares. [National Household Income and Expenditure Survey]. 2008, 2010, 1012, 1014 [cited 2015 July 1].