A Work Project, presented as part of the requirements for the Award of a Master’s degree in Economics / Finance / Management from the Nova School of Business and Economics.
COMMERCIAL OPEN SOURCE SOFTWARE COMPANIES: WHAT DRIVES THE POPULARITY OF OPEN SOURCE PROJECTS?
THOMAS TAISTRA
Work project carried out under the supervision of: Francisco Queiró
1 COMMERCIAL OPEN SOURCE SOFTWARE COMPANIES:
WHAT DRIVES THE POPULARITY OF OPEN SOURCE PROJECTS?
This thesis identifies issues regarding the commercialization of open source software. Moreover, the largest open source software platform GitHub is scanned for recently created projects as some have the potential to be commercially successful. More than 15.000 projects were obtained and analyzed using regressions and simple machine learning models to determine variables that influence popularity. Additionally, projects created by individuals and organizations are compared. Furthermore, patterns of popularity growth of the most popular projects are shown. The results should provide valuable information for venture capitalists seeking for investment opportunities in the software market.
Venture Capital, Commercial Open Source Software, GitHub, Popularity
This work used infrastructure and resources funded by Fundação para a Ciência e a Tecnologia (UID/ECO/00124/2013, UID/ECO/00124/2019 and Social Sciences DataLab, Project 22209), POR Lisboa (LISBOA-01-0145-FEDER-007722 and Social Sciences DataLab, Project 22209) and POR Norte (Social Sciences DataLab, Project 22209).
2 I. Introduction
The number of open source software companies is increasing and companies like Microsoft acquire them for billions of dollars. But how are high valuations possible when open source software is relying on volunteering developers who have access to the source code? And how is commercialization possible when open source software is considered to be free of charge? Does open source software not implicate monetization is impossible? But if not, where can venture capitalist find open source software projects and what are the crucial factors that need to be considered? These questions will be answered in this thesis.
II. Literature Review
Open Source was started by Enthusiastic Hackers
Open Source is a unique Approach to Software Development
In 1983 Richard Stallman founded the GNU project as an answer to the emerging commercialized software market. He created it with the intention to offer a completely free operating system as a counterpart to other commercial operating systems. Several years later Linus Torvalds built Linux which is known as the largest Open Source1 Project as of today (OS). However, no guidelines or rules existed that defined Open Source Software (OSS). To end this disorganization Eric Raymond and Bruce Perens started the Open Source Initiative, which defined software as OSS if it meets their strict definition. This led to an universal understanding of OSS which is valid to this day. OSS allows access to and usage of the source code as they are programs (D. Wheeler, 2015, Introduction, para. 1) “which licenses give users the freedom to run the
program for any purpose, to study and modify the program, and to redistribute copies of either the
1
3
original or modified program (without having to pay royalties to previous developers).” Raymond
also recognized two major development methods of software in general. One is the cathedral, which is an organized approach with central planning and a defined decision making process. Here, the company that created the software employs the developers. Moreover, the source code is treated as trade secret. Proprietary software often uses this method. In contrast, the bazaar is decentralized and provides different approaches and frequent improvements from a large volunteering developer community with different ideas, backgrounds, qualifications, nationalities and incentives. Here, the source code is publicly available. This method has positive effects on transparency and innovation of software. It is now widely used in the OS sector (E. Raymond, 1997).
Projects are the Engineering Driven Part of Open Source Software
There is a substantial difference between OS Projects and Products. The OS Project is developed and managed by the community and unites volunteering developers with the intention to create free software solutions. Projects are bound to different license models which allow OSS to be freely used, modified, and shared (G. Guosios et al., 2011, p.21). Projects usually start with a small team of up to three developers. Over time, a community is formed and through communication, social capital is built between developers and the community (C. Schweik, R. English, 2012, p.75). According to Wasserman at least four different types of OS Projects exist. First, with volunteering developers who participate in their spare time. Second, governed by a non-profit organization. Third, a combination of community and commercial characteristics, where paid developers as well as volunteers contribute to the project. Fourth, started and managed by a company, which commercializes the OS Project. This approach is more coordinated than the others as there is an organizational structure with a defined roadmap and testing processes (T. Wasserman, 2009, p.2). OS Projects are interesting for software startups as they have low development costs
4 and are an opportunity to create a first prototype, as the developers often do not program for financial compensation. Nevertheless, only a minority of OS Projects is created with the intention to be commercialized. An example for a successful project is Git, which was initially created by Linus Torvalds, the founder of Linux. Git offers distributed version control of files and was released in 2005. It allows developers to work on a software project simultaneously, regardless of their location.
The most successful Open Source Project is Linux
Measures for success support managers in evaluating OS projects (K. Crowston et al., 2003, p.2). Lee evaluated OSS Success with the help of DeLones’ Information Success Model (W. Delone, E. McLean, 1992) stating successful software is easy to use, user friendly and functional. In addition, he emphasized the importance of community service quality of OSS which (S. Lee et al., 2009, p.428) “can be defined as an individual’s perception about the reliability,
responsiveness, assurance, and empathy of the service provided by the OSS development community.” According to Weber the measure for success of OSS should be market share.
Therefore, OSS is successful when its product is dominating the market by offering better software quality than the competitors (S. Weber, 2004, p.116).
Products are the Business-Driven Part of Open Source
Products are created utilizing the prior created projects by offering additional proprietary software features to customers. Successful products show proficient up-front research activities and have a clear definition of the target market and its customers (R. Cooper, E. Kleinschmidt, 1987, p.181). Indicators for software product success are code quality and documentation quality (K. Crowston et al., 2006, p.8). However, measuring code quality of any software is difficult, even if it is publicly available as it is with OSS. Then again, Raymond writes, “given enough eyeballs,
5
all bugs are shallow”, which is an indicator for the high quality of OSS in general (E. Raymond,
1997, p.30). Therefore, a higher number of developers leads to a better overall code quality. An example for a commercial approach is offered by GitHub which is a company commercializing the OS Project Git. GitHub offers additional features to their customers. It is currently the largest version control platform and was recently acquired by Microsoft for $7.5bn US-Dollar.
New Business Models for the Monetization of Open Source Software
Software Companies are selling the Right to Use the Software
Any business model depends on the target customer needs. As a software company, it is possible to combine multiple models i.e. by offering sales and services as well as a community platform. The standard business model is selling not the proprietary software product but the right to use it. Here, the creator owns the code that is intellectual property protected by copyrights and patents (F. Hecker, 1998, The standard software business model, para. 4). The most successful software companies (S. Turner, 2015, p.1) “have revenue models that generate cash flow with high
margins, typically based on licensing fees and services.”
Open Source is a Business Strategy
Commercial OSS Companies (COSS) should look for a hybrid approach to maximize profits. “Those companies wishing to succeed with an OSS model should consider a combination of
revenue models that enable them to capture value from the software itself, as well as drive in additional revenue streams” (S. Turner, 2015, p.19). Yet, OS is not a business model (451 Group,
2008, p.23) but a business strategy where the OS License “has a strong influence on development,
6 Examples for Successful Monetization of Open Source Software
Financial data of successful COSS Companies is rare, because only a limited number provides financials to the public. However, a company index exists and is continuously updated. The company OSS Capital supports the Commercial Open Source Software Index (COSSI). It lists COSS Companies with estimated annual revenue of > $100m when their business relies completely in on OSS. Currently it consists of around 40 companies such as Elastic, Pivotal, Cloudera or Hortonworks.
Support and Services is used by the Company with the highest Valuation
Support and Services sells additional services to customers. Red Hat, the largest supplier of OS IT solutions, uses this model to offer enterprise versions of Linux. The company was an early adopter of OSS founded in 1993. In 2018 IBM acquired Red Hat for $32bn, making it one of the biggest acquisitions of a software company. However, for venture capitalists it was not an ideal target. The time span between the founding of Red Hat and its acquisition by IBM took 25 years. Typically, a venture capital fund has a shorter lifecycle and is looking for higher annual growth rates. Red Hats business model (P. Levine, 2014, It started (and ended) with Red Hat, para. 13)
“simply does not enable adequate funding of ongoing investments. The consequence of the model is minimal product differentiation resulting in limited pricing power and corresponding lack of revenue.”
Majority of successful Companies use Open Core as a Business Model
Most companies that are listed in the COSSI use different license agreements for the project and their product. This allows a distribution of software under different terms and conditions. The user has the possibility to download the source code of the core OS Project and uses the software with its limited features for free. Moreover, a commercially licensed OS Product, which offers
7 advanced features, is created and sold. Here, the license protects the company’s intellectual property. Thus, only the owner of the company that offers a product controls it and generates revenue. The crucial point when using the Open Core (OC) business model is (S. Turner, 2015, p.4) “to have a powerful core that people will value while also adding enough features to the
proprietary version to create incentives for the customer to pay for licensing.” Moreover, Turner
states development efforts in the core project need to be continuous, innovative and remain OS. Yet, there must be a clear distinction between the project and the product. According to one of the most successful investors in COSS Companies, the core project is crucial for operations and innovation, therefore it should not be disadvantaged or abandoned (P. Fenton, 2011, p.8). OC is interesting for startups as it gives them an opportunity to profit from free software development and user creation. After the foundation of a project with a large community, they can validate venture capital funding and pivot to additional proprietary product features as they already have a community that can become the first customers.
Software as a Service is another promising Business Model
Here, the software and the IT infrastructure are operated by an external IT service provider and used by the customer as a service. In OS, this model combines a software platform with an OC to provide a server-based service offering free features next to other features, which are obliged to pay. An example is again GitHub. Here, the customers do not perceive the OC which is Git, as it is not required for the use of GitHubs chargeable service. Most customers do not participate in project development but are only purchasing the commercial product and features.
Independent Companies are the most promising Investment Targets
MongoDB or Elastic are examples for achieving commercial success without being backed by another institution or foundation. MongoDB raised $1.6bn in an IPO in 2017 and ElasticSearch
8 raised $2.5bn in a 2018 IPO. These companies created the OS Projects MongoDB and ElasticSearch on their own and commercialized them in addition. This gives them advantages as they have control over the community, the OC, and the commercialization of the OC through additional products. However, this approach needs sufficient capital for building a community of developers and users as well as for the creation of a strong brand. In contrast, GitHub did not create Git and therefore has no control of the community and the OC. However, it still became a commercial success story.
Venture Capitalist focus on the Business-Driven Part of Open Source Software
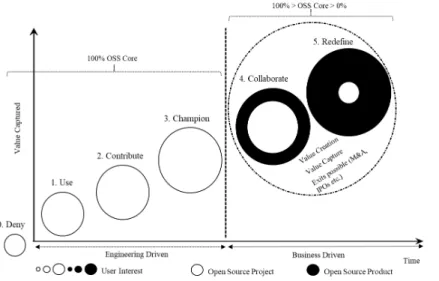
The Eclipse Foundation published a theoretical model of OSS participation levels (I. Skerrett, 2013). This model has been extended in this thesis in relation to the OC business model to represent the lifespan of successful COSS companies. The Commercial Open Source Software Company Life Span describes the increase in captured value over time. The first part is the engineering-driven part, where the focus is exclusively on creating a non-commercial OS Project and its improvement. The software is completely OS and the users are mainly developers. The user interest is indicated by the size of the circles. The OS Product marks the start of the commercial part. Once OSS is business driven and monetization starts, the user interest in the OS Project, which is
9 engineering driven, decreases. With time, companies improve their product until the product's features are so advanced that the initial project is often used as demo version only. However, a COSS Company should not abandon the OS Project at any point as the volunteering developers are generating new concepts and ideas which can be implemented into the commercial solution by the company.
Open Source Software is responsible for many Software Innovations
Major Players recognize the Value of Open Source Software
A large stake of venture capital investments is made in software startups. Some professionals explain: “Why Software Is Eating the World.” (M. Andreessen, 2011, para. 1). Others go even further and say OSS is eating the world (IBM, 2019). This development is emphasized by the importance OSS has behind most of software innovations. Although OSS started as a counter movement to commercial software it is now responsible for many commercial software solutions i.e. operation of web browsers like Firefox, databases like MongoDB, operating system for computers and servers like Linux, and smartphone operating systems like Android. The progress is not likely to stop as the projected revenue of the OS Services Market will reach the amount of $30bn in 2022 whereas in 2017, total revenue reached an amount of $11.4bn (S. Liu, 2018).
Venture Capitalists recognize the potential of Open Source Software
Collectively, COSS Companies have raised over $10bn in venture capital with a trend in the last 10 years towards larger deals whereas around 75% of the companies and 80% of the capital raised have come about after 2005 (P. Levine, 2019).
0 10 20 30 40 0 2 4 6 8 10 1991 1994 1997 2000 2003 2006 2009 2012 2015 2018
Total of Venture Deal Size Venture Deals
11,4 14,1 17,4 21,6 26,6 32,95
2017 2018 2019 2020 2021 2022
10 Open Source Software disrupts Proprietary Software Markets
According to Xing, COSS Companies can obtain profits although competitors offer proprietary software with higher usability or a comparable free OSS alternative is available. However, COSS companies, which offer software with higher functionality, still have lower profits than competitors offering comparable proprietary software. In addition, pricing and profits for COSS companies do not increase with software functionality. Yet, there is an indicator for the potential to disrupt markets. COSS decreases the pricing of proprietary software competitors (M. Xing, 2013, p.1). COSS Companies can therefore challenge and outcompete competitors by offering similar or better products, which are lower priced and easier to adopt (M. Xing, 2014, p.1194). Additionally, OSS can minimize the initial development costs if a community of volunteers creates the OS Project and no costs for intellectual property protection occur through the nature of OSS.
Productivity increases with the Usage of Open Source Software
Companies that contribute to OSS have an increase in the value-added productivity output of the usage of the specific OSS (K. Senz, 2018). OSS is therefore contrary to proprietary software when it comes to its development. The general law of diminishing returns in economics is comparable to Brook’s Law which is applicable to software development. One key statement (F. Brooks, 1975, p.25) of it is that: “Adding manpower to a late software project makes it later.” However, this is not the case for OSS as the productivity increases with contribution to OSS.
Single Vendors are the most attractive Investment Opportunity
Single vendors create one OS Product that commercializes one OS Project. Here, the project founders are also responsible for the monetization of the product. Examples are companies like Talend Inc. that created the project Talend Data Integration, or MuleSoft, a company which created the project MuleESB. Nevertheless, it is also possible that multiple companies commercialize the
11 same project, i.e. Apache Hadoop. Apache Hadoop is a free framework written in Java for scalable, distributed software. The companies Cloudera and Hortonworks use the Apache Hadoop project and add their products subject to a charge. This makes value capturing more competitive which decreases profits of each company and distributes market shares. Consequently, single vendors are more attractive, as they can capture the market completely and have a higher engagement with the developer community as they are responsible for the initial project creation.
Risks when investing in Commercial Open Source Software Companies
Competitors can copy the entire Source Code of a Project
Software licenses define the rights and restrictions of OSS and are applied to the source code. They are crucial as they outline if the OSS can be used for commercialization or not. According to Laurent (A, St. Laurent, 2008, p.4) the “fundamental purpose of open source licensing is to deny
anybody the right to exclusively exploit a work.” Licenses can be a risk factor for
commercialization, especially as competitors can copy the entire source code of an OS Project to capture its value without any contributions to the community. Using OS Projects for personal financial gain is called strip-mining. An example for strip-mining is Amazon, which offers a service using the OS Project Elasticsearch, which was initially created by the company Elastic. A reaction to the threat is moving to licenses that prohibit commercial use of the projects by large cloud vendors like Amazon Web Service unless they purchase a commercial license, which was done by MongoDB or Elastic in 2019.
Losing the Support of the Community is a substantial Disadvantage
There is a connection between success and the relationship with the community. This is crucial for every COSS Company (P. Fenton, 2011, p.11), as “misalignment between a business model
12 having more than one supplier of the technology. Moreover, without a community that is willing to use their spare time the COSS company is most likely to become less innovative. Competitors with a healthy community would then have a strong competitive advantage.
III. Empirical Analysis
Introduction
The largest platform for OS Projects is GitHub which is uniting more than 31m developers, 2.1m organizations and more than 100m repositories to host and create own projects. In this analysis nine questions will be addressed regarding their popularity measured by their number of stars. These questions are of interest for venture capitalists as most COSS Companies start with the creation of an OS Project. The questions are following:
Q1: Are stars exponentially distributed?
Q2: Does popularity vary between open source software licenses? Q3: Does popularity vary between programming languages?
Q4: Are projects using a primary programming language and an additional secondary
language more popular than projects with only one language?
Q5: Are projects with a personal website more popular than those without? Q6: Does popularity vary between project owners?
Q7: Do stars of popular repositories follow specific patterns?
Q8: What is the impact of project size, forks, watchers, releases, milestones, pull requests on
project popularity?
13 Only a small number of studies exists that focus on the popularity of GitHub projects. Prior studies focused on analyzing popular projects with thousands of users, describing i.e. correlations and growth patterns (Hudson Borges, 2018). However, here this study includes both, popular and unpopular projects on a large scale which others did not. This has an advantage as with this data the results can be more reliably derived on the entirety of GitHub data.
Dataset
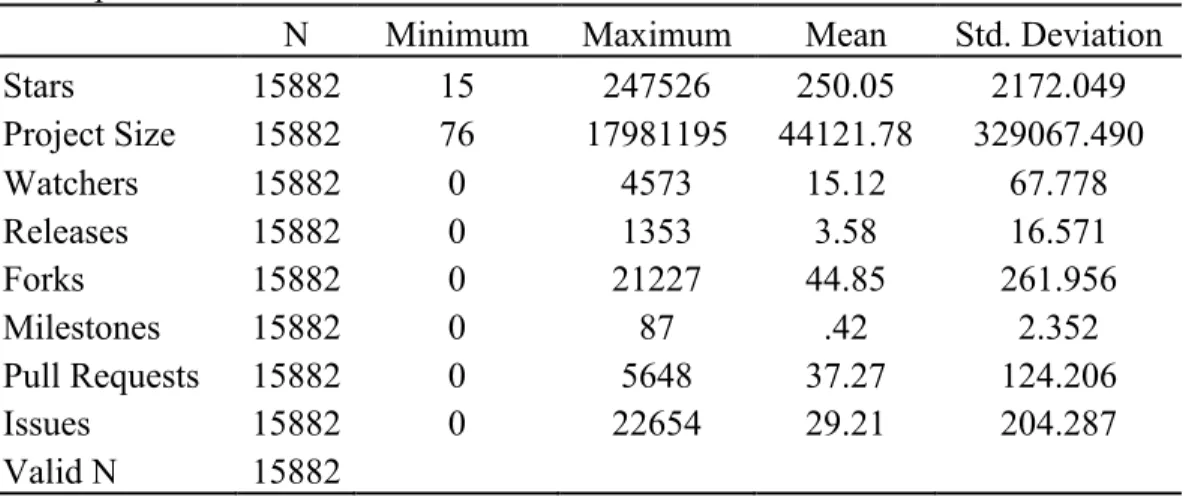
A software code was written using GraphQL, a data retrieval language and runtime system (Figure 3). The created dataset (Table 1) consists of cross section data obtained in September 2019.
The number of projects is 15.882 which were actively maintained and created within 01. September 2018 and 01. September 2019. Moreover, the dataset contains information about the projects including their name, size, forks, stars, pull requests, issues, milestones and watchers (Table 2). All relevant statistical tables can be found in the appendix.
Table 1 Descriptive Statistics Descriptive Statistics
N Minimum Maximum Mean Std. Deviation
Stars 15882 15 247526 250.05 2172.049 Project Size 15882 76 17981195 44121.78 329067.490 Watchers 15882 0 4573 15.12 67.778 Releases 15882 0 1353 3.58 16.571 Forks 15882 0 21227 44.85 261.956 Milestones 15882 0 87 .42 2.352 Pull Requests 15882 0 5648 37.27 124.206 Issues 15882 0 22654 29.21 204.287 Valid N 15882
14 Results
Q1: Are stars exponentially distributed?
The number of stars stretches from projects with 15 to the largest project with 247.526 stars (996.ICU). The mean is 250.05 and figure 3 shows the distribution of stars. The cumulative distribution function and the complementary cumulative display the exponential distribution of stars. The charts indicate a distribution of stars close to power law.
Q2: Does popularity vary between open source software licenses?
As displayed in figure 5 the MIT License is the most used license (33.9%, 5377 repositories), followed by the Apache 2.0 License (13.6%, 2166 repositories) and the GNU General Public License v3.0 (7.0%, 1110 repositories). The MIT License is unproblematic for the GitHub community as the license is one of the most permissive OS licenses, so there are few restrictions or obligations for users. However, the license with the highest median is the BSD 2-Clause “Simplified” License. This license is used significantly less than the MIT License. It is concluded
Figure 4 Exponential Distribution of Stars (x)
15 that the popularity varies between repositories with different software licenses. A Kruskal-Wallis test (Table 5) for the comparison of several samples is significant (p <.001). The null hypothesis stating that the distribution of stars is the same across different licenses is rejected. Therefore, the software license affects the number of stars.
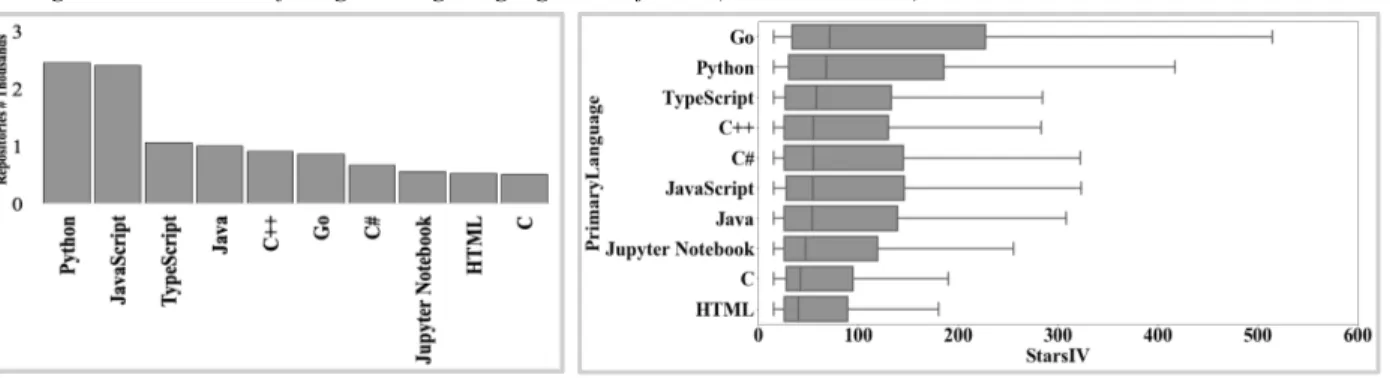
Q3: Does popularity vary between programming languages?
In figure 6 the distribution of stars between the ten most programming languages is shown. The most used programming language is Python (15.4% 2450 repositories) which is a free of charge cross-platform programming language. It is easy to use, fast and powerful. This language is therefore particularly interesting for OSS developers as they tend to look for the most efficient solutions. As a Python code is easy to read, it makes code improvement and bug fixing very easy. In addition, cross-platform development is the ideal way to combine GitHub contributors using different operating systems. Another language is JavaScript which is also used often (15.1%, 2402 repositories) followed by TypeScript (6.7%, 1062 repositories). Nevertheless, Go has the highest median. This is not surprising as Go was specifically developed to simplify software development with many contributing developers and large code bases. The Kruskal-Wallis test (Table 6) shows significance (p <.001), therefore it is concluded that the programming language also influences repository popularity. The null hypothesis saying that the distribution of stars is the same across the programming languages is rejected.
16 Q4: Are projects using a primary programming language and an additional secondary language
more popular than projects with only one language?
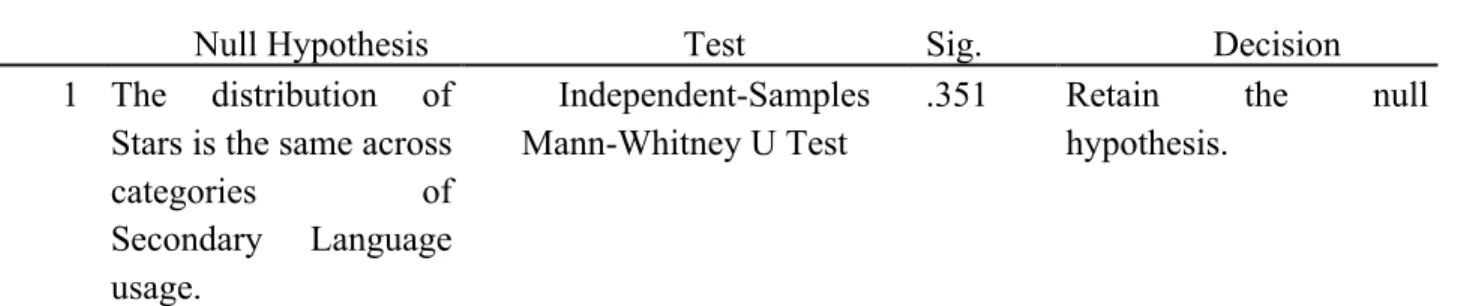
Developers on GitHub are not obligated to use only one language. The results of a Mann-Whitney test (p = .351) show that the null hypothesis is retained stating that the popularity is the same between projects with one programming language and projects using two programming languages (Table 7). Therefore, the results show that a secondary language does not seem to impact the number of stars.
Q5: Are projects with a personal website more popular than those without?
Project owners often create a website so users and contributors can get additional information such as tutorials or contact data etc. This may explain why the results (Table 8) of a Mann-Whitney test show that the null hypotheses stating that the popularity is the same is rejected (p < .001). Thus, projects with a personal website are more popular than those without.
Q6: Does popularity vary per project owner?
On one hand, projects can be created by individual users. An example for a successful user project within the dataset successful user is CorentinJ/Real-Time-Voice-Cloning (8.881 stars) which uses deep learning methods to replicate a voice from a five second voice record. On the other hand, projects can be created by organizations such as Facebooks libra/libra (12.921 stars) which is a digital currency and is planned to be available in 2020. The Mann-Whitney test is significant (p =.016). Therefore, the null hypothesis stating that the popularity is the same between projects owned by an organization and those owned by an individual user is rejected (Table 9). Thus, projects owned by an organization are more popular. These may come from additional
17 financial resources which can be used for the development of the project or for marketing through i.e. social media which increases the total reach of the repository. Moreover, developers might be incentivized by signaling effects they want to create i.e. if the repository owner is a company, it could employ the most talented volunteers as some might look for new career opportunities.
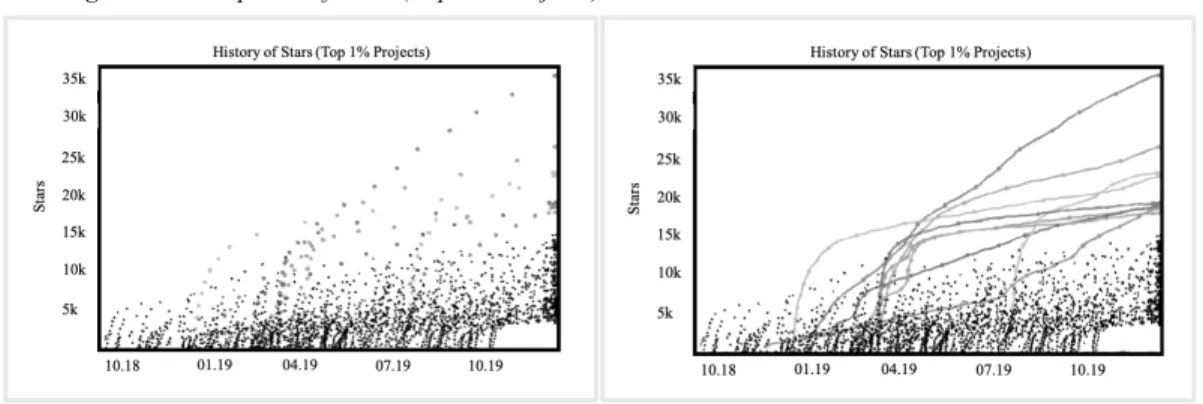
Q7: Do stars of popular repositories follow specific patterns?
To distinguish patterns of star development historical data needed to be investigated. This was combined with the GitHub repository timqian/star-history, which collects GitHub metadata. The project allows the input of one repository name at a time and creates a chart that shows the historic development of the number of stars. To automate this process a bot was developed using JupyterNotebook and Selenium to emulate a web browser. The bot has access to each project in the prior created dataset. From the saved GitHub links, the bot can recognize the names of the projects, copy them, and then paste them into timqian/star-history, which then creates a graphical representation. This was created for the top 1% of projects in the dataset. Here, it is obvious that many successful projects receive sudden growth of stars after the initial project creation. Similar patterns of results were obtained in the past (H. Borges et al., 2016).
18 Q8: What is the impact of project size, forks, watchers, releases, milestones, pull requests on
project popularity?
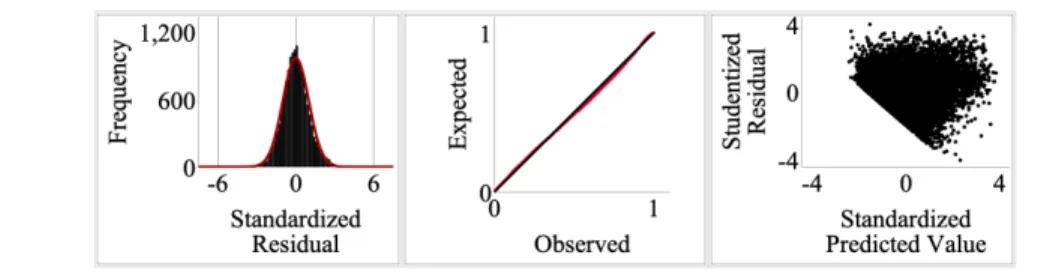
A multiple regression on the natural logarithmic transformed dataset is used to understand whether the publicly available independent variables which are the total issues, forks, total pull requests, milestones, releases and watchers have a positive or negative influence on the number of stars. Collinearity statistics were in an accepted range, as the tolerance level must be > .1 and/or VIF < 10 for all independent variables (Table 12).
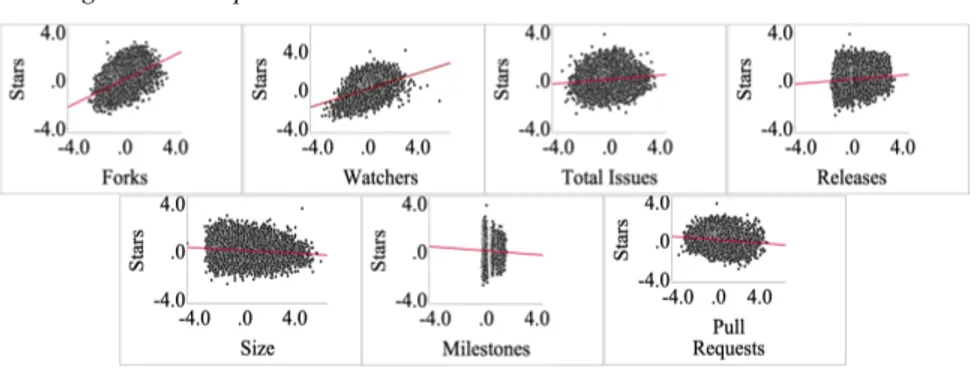
The sample size was reduced to 14.534 by dismissing extreme outliers. However, the plot of studentized residuals against unstandardized residuals indicates that heteroscedasticity is given (Figure 8). To be able continue the analysis the parameters should be estimates using robust standard errors with the HC3 method (A. Hayes, 2007). A significant regression was found F (7, 14.533) = 3036.366, p < .001, R2 = .594). Here, forks (B =.515, p < .001), watchers (B = .381, p < .001), total issues (B = .087, p < .001) and releases (B = .088, p < .001) have a positive effect on stars. Therefore, in these cases projects with more forks, watchers, total issues and releases are also more popular. In contrast project size (B = -.058, p < .001), milestones (B = -.080, p = .008), and pull requests (B = -.080, p < .001) have a negative influence of project stars.Projects with a large size have a smaller number of stars. Therefore, projects tend to be less popular when the source code becomes too large and complex. In addition, projects with many milestones are less popular. A reason for that might be that the developer community is interested in problem solving through
19 coding. Once the software is advanced and reached their goals, they lose interest and unstar the project. Moreover, projects with many pull requests are less popular. They are requests made by the community to adapt the source code. An explanation could be that some contributors become frustrated when the project owner needs to be reminded frequently to improve the code. The figure below shows plots that display the effect of each variable on stars (Figure 8).
Q9: Can simple machine learning methods predict the number of stars?
To answer this question three decision tree based approaches are used with the support of Python, JupyterNotebook, Pandas, the machine learning library Scikit and the OS GitHub repository Doodies/Github-Stars-Predictor. These three models should increase the accuracy and predictive power as they can determine linear and nonlinear relationships between variables. Therefore, untransformed data is used, as possible complex non-linear relationships would be lost after a transformation. The first method is Gradient Boost that combines several decision trees where patterns are recognized. The second method is Random Forest which also uses algorithms to create multiple decision trees. The third method is Neural Network which is used to detect relationships between the tested variables. The left bar charts display the R2 of the models with the same independent variables as in the multiple regression which was conducted before (Figure 12). Machine learning combined with the publicly available GitHub data increases the power of the model significantly. Random Forest provides the strongest model (R2 = .73), together with Gradient
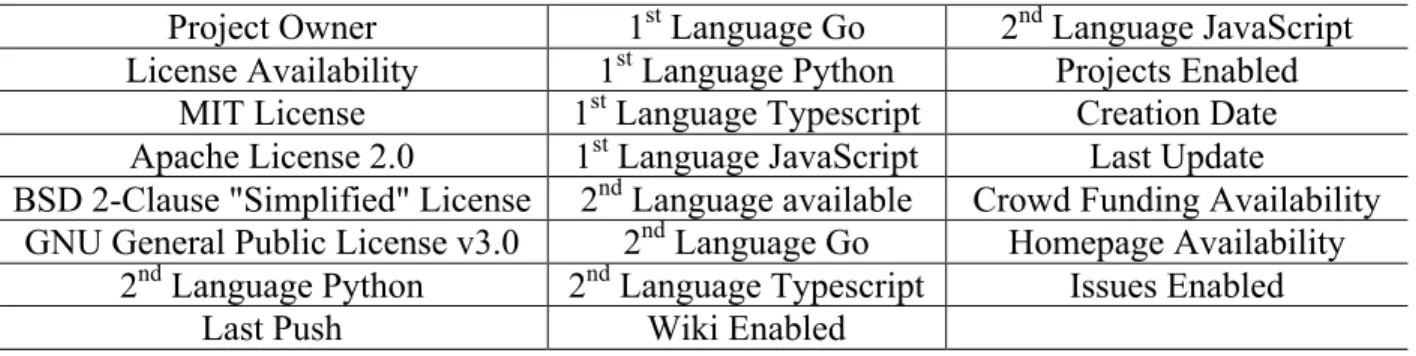
20 Boost (R2 = .73) followed by Neural Network (R2 = .62). Moreover, 23 additional variables (Table
16) were added in a second testing round and the results are displayed below. The addition of new variables led to an increase of R2 in all cases.
Table 16 Additional Variables obtained with GraphQL
Random Forest had the best result (R2 = .79), followed by Gradient Boost (R2 = .78) and Neural Network (R2 = .64). Therefore, are not only repository statistics significant predictors of stars. Variables that define i.e. the availability of a homepage, the project owner type or the availability of crowd funding increase the power of the model significantly and are also more applicable.
Project Owner 1st Language Go 2nd Language JavaScript
License Availability 1st Language Python Projects Enabled MIT License 1st Language Typescript Creation Date Apache License 2.0 1st Language JavaScript Last Update
BSD 2-Clause "Simplified" License 2nd Language available Crowd Funding Availability
GNU General Public License v3.0 2nd Language Go Homepage Availability 2nd Language Python 2nd Language Typescript Issues Enabled
Last Push Wiki Enabled
0,88 0,97 0,69 0,73 0,73 0,62 0 0,5 1
Gradient Boost Random Forest Neural Network
Using GitHub Statistics
Train Score Test Score
0,89 0,97 0,69 0,78 0,79 0,64 0 0,5 1
Gradient Boost Random Forest Neural Network
Using GitHub Statistics and 23 extra Variables
Train Score Test Score Figure 10 R2 of Gradient Boost, Random Forest, Neural Network
21 IV. Limitations
Regarding the limitations of the analyzed data, it could be argued that the data is not a perfect representation of reality. However, it is an approximation. There is missing information about projects with no stars or with stars < 15. Moreover, the number of contributors was not included as GraphQL is not yet capable of capturing it on a large scale. When comparing the results to those of older studies, it must be pointed out that Doodies/Github-Stars-Predictor had comparable results but used 54 variables whereas this study only used 30 variables. Nevertheless, our examined dataset was significantly smaller.
V. Conclusion
What started as a counter movement against commercial software by committed hackers led to a new type of software company that combines free features with fee-based features. However, OS is not a consortium of enthusiastic programmers anymore. It uses the internet to combine people with different backgrounds, interest, ideas, incentives and nationalities to work on a project without receiving financial compensation. Despite the risk of being copied by competitors, developers are willing to share their code and thus improve their product. Venture capitalists need to understand the potential of millions of projects with innovative ideas, because some of the project creators are looking for a solution to be commercialized. After an extensive analysis of more than 15.000 OS Projects, it was determined that certain software licenses appear more frequently such as the MIT License or the Apache 2.0 License. Moreover, some licenses are associated with significantly higher project popularity than others. Similar results were also determined for programming languages. Python and JavaScript are the most used programming languages. However, the language with the highest median of stars is Go. After a comparison of projects, it was determined
22 that projects with a personal homepage are more popular than those without. In addition, projects founded by organizations such as foundations or companies are more popular than projects created by individual users. Yet, the project with the highest number of stars was 996.ICU, a user project. GitHub variables that influence popularity are forks, watchers, releases and issues. Milestones, pull requests and the project size have negative effects on popularity. The regression shows that 59.4% of the variance of stars can be explained using GitHub statistics. This number would have been certainly higher if the number of contributors had been tangible. Yet, simple machine learning techniques can explain the variance much better. After additional variables were added, the significance of all models increased significantly. Venture capitalists should conduct own researches using this knowledge and thus start to develop predictive models. It is certainly possible to have a competitive advantage over competitors if these models are perfected as it was proven that additional variables increase the predictive power. Do not forget, this is open source and therefore the data can be obtained for free.
VI. List of References
Andreessen, M. (2011). Why Software Is Eating the World - Andreessen Horowitz. Retrieved 3 August 2019, from https://a16z.com/2011/08/20/why-software-is-eating-the-world/
Androutsellis-Theotoki, S., Spinellis, D., Kechagia, M., & Gousios, G. (2011). Open Source Software: A Survey from 10,000 Feet. Retrieved 9 September 2019, from
http://www.gousios.gr/pub/oos-10000-feet.pdf
Borges, H., Hora, A., & Tulio Valente, M. (2016). Predicting the Popularity of GitHub Repositories. Retrieved 15 November 2019, from https://arxiv.org/pdf/1607.04342.pdf Borges, H., Tulio Valente, M. (2018). What’s in a GitHub Star? Understanding Repository Starring Practices in a Social Coding Platform. Retrieved 16 October 2019, from
https://arxiv.org/abs/1811.07643
23 Cooper, R., & Kleinschmidt, E. (1987). New Products: What Separates Winners from Losers?.
Journal Of Product Innovation Management, 4(3), 169-184. doi: 10.1111/1540-5885.430169
Crowston, K., Annabi, H., & Howison, J. (2003). Defining Open Source Software Project Success. Retrieved 17 September 2019, from https://docplayer.net/10489605-Defining-open- source-software-project-success-kevin-crowston-hala-annabi-and-james-howison-school-of-information-studies-syracuse-university.html
Crowston, K., Annabi, H., & Howison, J (2006). Information Systems Success in Free and Open Source Software Development: Theory and Measures. Retrieved 7 October 2019, from
https://crowston.syr.edu/sites/crowston.syr.edu/files/InformationSystemsSuccessInFree.pdf DeLone, W., & McLean, E. (1992). Information Systems Success: The Quest for the Dependent Variable. Retrieved 28 October 2019, from https://www.semanticscholar.org/paper/Information-
Systems-Success%3A-The-Quest-for-the-DeLone-McLean/a04145f1ca06c61f5985ab22a2346b788f343392
Disrupt Your Industry with Open Source. (2019). Retrieved 2 September 2019, from https://www.eclipse.org/org/value/public/pdf/business_of_open_source_ebook.pdf
Fenton, P. How to Operationalize an OSS Company. Retrieved 29 November 2019, from
https://www.eiseverywhere.com/file_uploads/902bc023db99d0680411f899cbe97d15_OSBC201 1_Big_Innovation_T1030_Bearden_Fenton.pdf
Ghapanchi, A., Aurum, A. and Low, G. (2011). A taxonomy for measuring the success of open
source software projects. [online] Firstmonday.org. Available at:
https://firstmonday.org/ojs/index.php/fm/article/view/3558/3033 [Accessed 2 Aug. 2019]. Hayes, A. (2007). Using heteroskedasticity-consistent standard error estimators in OLS
regression: An introduction and software implementation (39th ed., pp. 709-722).
Hecker, F. (1998). Setting Up Shop: The Business of Open-Source Software. Retrieved 18 November 2019, from http://hecker.org/writings/setting-up-shop
IBM. (2019). How open source software is eating the world. Retrieved 3 August 2019, from https://developer.ibm.com/blogs/how-open-source-software-is-eating-the-world/
Kerzner, H. (2003). Project management. Hoboken, N.J.: J. Wiley.
Lee, S., Kim, H., & Gupta, S. (2009). Measuring open source software success. Retrieved 8 July 2019, from http://web.yonsei.ac.kr/dslab/Journal/OMEGA%202009.pdf
Lerner, J., & Tirole, J. (2003). Some Simple Economics of Open Source. The Journal Of
24 Levine, P. (2014). Why There Will Never Be Another Red Hat: The Economics of Open Source - Andreessen Horowitz. Retrieved 31 September 2019, from https://a16z.com/2014/02/14/why-there-will-never-be-another-redhat-the-economics-of-open-source/
Levine, P. (2019). Open Source: From Community to Commercialization. Retrieved 3 December 2019, from https://a16z.com/2019/10/04/commercializing-open-source/
Liu, S. (2018). Open source services market revenue worldwide 2017-2022 | Statista. Retrieved 18 October 2019, from https://www.statista.com/statistics/270805/projected-revenue-of-open-source-software-since-2008/
Mason, R. (1978). Measuring information output: A communication systems approach.
Information & Management, 1(4), 219-234. doi: 10.1016/0378-7206(78)90028-9
Michlmayr, M. (2007). From the Cathedral to the Bazaar: An Empirical Study of the Lifecycle. Retrieved 7 August 2019, from https://www.cyrius.com/publications/capiluppi_michlmayr-cathedral_to_bazaar/
Raymond, E. (1999). The Cathedral and the Bazaar. Retrieved 17 November 2019, from http://www.catb.org/esr/writings/cathedral-bazaar/
Schweik, C., & English, R. (2012). Internet success. Cambridge, Mass.: MIT Press.
Senz, K. (2018). The Hidden Benefit of Giving Back to Open Source Software. Retrieved 22 August 2019, from https://hbswk.hbs.edu/item/the-hidden-benefit-of-giving-back-to-open-source-software
Skerrett, I. (2013). Why Open Source Governance Matters. Retrieved 13 July 2019, from https://de.slideshare.net/IanSkerrett/why-open-source-governance-matters
Software- GNU Project - Free Software Foundation. (2019). Retrieved 24 September 2019, from https://www.gnu.org/software/software.en.html
St. Laurent, A. (2008). Understanding Open Source and Free Software Licensing (p. 4). Sebastopol: O'Reilly Media, Inc.
Turner, S. (2015). Open-source software business models that create value. Retrieved 12 December 2019, from http://www.aabri.com/manuscripts/152159.pdf
VMware. The Minimum Viable Open Source Project - Inspiration from VMware's OSTC - VMware Open Source Blog. (2018). Retrieved 15 December 2019, from
https://blogs.vmware.com/opensource/2018/06/05/minimum-viable-open-source-project Wasserman, T. (2009). Building a Business on Open Source Software. Retrieved 24 July 2019, from https://www.semanticscholar.org/paper/Building-a-Business-on-Open-Source-Software-Wasserman/61ee5b39c6f7532115b9b284607491ea6ff4cb77
25 Weber, S. (2009). Success of Open Source (p. 116). Cambridge: Harvard University Press.
St. Laurent, A. (2004). Understanding open source and free software licensing. Beijing: O'Reilly. Wheeler, D. (2015). Why Open Source Software / Free Software (OSS/FS, FOSS, or FLOSS)? Look at the Numbers!. Retrieved 2 October 2019, from https://dwheeler.com/oss_fs_why.html Wheeler, D. (2007). The Free-Libre / Open Source Software (FLOSS) License Slide. Retrieved 17 October 2019, from https://dwheeler.com/essays/floss-license-slide.html
Xing, M. (2015). The effect of competition from open source software on the quality of
proprietary software in the presence of network externalities. Journal Of Industrial Engineering
And Management, 8(3). doi: 10.3926/jiem.1362
Xing, M. (2014). The impact of commercial open source software on proprietary software producers and social welfare. Journal Of Industrial Engineering And Management, 7(5), 1183-1196. doi: 10.3926/jiem.1260
Xing, M. (2013). Competition between Free Open Source, Commercial Open Source and Proprietary Software. Retrieved 11 September 2019, from
https://www.semanticscholar.org/paper/Competition-between-Free-Open-Source%2C-Commercial-Xing/6f5e59754d6722f6c3918ab543e1ee6d2a75562f
451 Group. (2008). Open Source Not A Business Model (p. 23). 451 Group. Retrieved 19 September 2019, from
https://www.google.com/url?sa=t&rct=j&q=&esrc=s&source=web&cd=9&ved=2ahUKEwjzgJD pnefmAhVJ4aQKHQ2YC_cQFjAIegQIBxAC&url=http%3A%2F%2Fmarktarver.com%2Fosnb m.pdf&usg=AOvVaw2a0zyQRgvhsZaIPUaHfvZe
26 VII. Additional Appendices
Table 2 Repository Information retrieved using the GraphQL Query
Variable Description
Repository Name Name of the project
Individual GitHub URL URL which gives access to project Number of Stars Indicator for the popularity
Number of Releases A Release marks a specific point in the history of the project Achieved Milestones Milestones track the progress of the project
Issues Issues are used to collect user feedback, bugs, and organizes task completion
Primary Programming Language
Most used programming language that is used by developers Creation Date Creation date of the project
Archived Repository or not
Status of the project; actively maintained or abandoned Project Size Overall size of the project in kB
Number of Forks Number of copies of the project made by other users
Pull Requests Used to inform other users about the changes that have been made to the project
Data of last recorded Push
Activity Last recorded transfers of a commit to the project Short Repository
Description
Overview about the projects goal, purpose etc. Owner: Organization or
individual User
Project creator; user or organization
Number of Watchers User who want to be notified of any project activity Software License Software license that is used if any
Secondary Programming Language
Second programming language that is used for development Date of last Update
27
Table 3 Code used to query public GitHub Repositories with the GraphQL API query { search( #after:"Y3Vyc29yOjEwMDA=" type:REPOSITORY, query: """ forks:>=1 pushed:>=2019-09-01 created:>=2018-09-01 """, last: 100 ) { pageInfo{ hasNextPage endCursor } repos: edges { repo: node { ... on Repository { name createdAt description url isArchived owner{__typename} stargazers{stars: totalCount} diskUsage watchers{watchers: totalCount} releases {releases: totalCount} forks: forkCount
licenseInfo{name} milestones{totalCount}
openpullRequests:pullRequests(states:OPEN){totalCount} pullRequests {pullRequests: totalCount}
openIssues: issues(states:OPEN){totalCount} totalIssues: issues {totalIssues: totalCount} primaryLanguage {primaryLanguage: name} languages(first: 1) { nodes {name} }
pushedAt updatedAt } } } } }
28
Table 4 Python Code used to obtain Charts about Historic Star Development from selenium import webdriver
import time import pandas as pd
from selenium.webdriver.common.by import By import datetime, time, sys, argparse
from time import strftime
from selenium.webdriver.common.keys import Keys
from selenium.webdriver.firefox.firefox_binary import FirefoxBinary
from selenium.webdriver.support.ui import WebDriverWait # available since 2.4.0 from selenium.webdriver.support import expected_conditions as EC
usr = pd.read_csv(' insert file path.csv ') usrlist = usr.values.tolist()
flatusrlist = [] for sublist in usrlist: for item in sublist: flatusrlist.append(item)
org = pd.read_csv("insert file path.csv") orglist = org.values.tolist()
flatorglist = [] for sublist in orglist: for item in sublist: flatorglist.append(item)
driver = webdriver.Chrome('enter chromedriver location ') driver.get('https://star-history.t9t.io/')
time.sleep(5)
key = driver.find_element_by_id('addTokenBtn') key.click()
tokeninput = driver.find_element_by_id('tokenInput') tokeninput.send_keys(' insert individual GitHub access token') time.sleep(2) tokenbutton = driver.find_element_by_id('saveTokenBtn') tokenbutton.click() time.sleep(3) for i in flatusrlist: search_field = driver.find_element_by_name('repo') search_field.send_keys(i)
element = WebDriverWait(driver, 3).until(EC.presence_of_element_located((By.ID, "theBtn"))) search_button = driver.find_element_by_id('theBtn') search_button.click() time.sleep(10) search_field.clear() time.sleep(2)
29
Table 5 Kruskal-Wallis Test: Licenses & Stars Hypothesis Test Summary
Null Hypothesis Test Sig. Decision
1 The distribution of Stars is the same across categories of Licenses.
Independent-Samples Kruskal-Wallis Test
.000 Reject the null hypothesis.
Asymptotic significances are displayed. The significance level is .050.
Table 6 Kruskal-Wallis Test: Languages & Stars Hypothesis Test Summary
Null Hypothesis Test Sig. Decision
1 The distribution of Stars is the same across categories of Primary Language.
Independent-Samples Kruskal-Wallis Test
.000 Reject the null hypothesis.
Asymptotic significances are displayed. The significance level is .050.
Table 7 Mann-Whitney U Test: Secondary Language Hypothesis Test Summary
Null Hypothesis Test Sig. Decision
1 The distribution of Stars is the same across
categories of
Secondary Language usage.
Independent-Samples Mann-Whitney U Test
.351 Retain the null hypothesis.
Asymptotic significances are displayed. The significance level is .050.
Table 8 Mann-Whitney U Test: Homepage Hypothesis Test Summary
Null Hypothesis Test Sig. Decision
1 The distribution of Stars is the same across categories of Homepage.
Independent-Samples Mann-Whitney U Test
.000 Reject the null hypothesis.
30
Table 9 Mann-Whitney U Test: Owner Type Hypothesis Test Summary
Null Hypothesis Test Sig. Decision
1 The distribution of Stars is the same across categories of
Owner Type.
Independent-Samples Mann-Whitney U Test
.016 Reject the null hypothesis.
Asymptotic significances are displayed. The significance level is .050.
Table 10 Model Summary
Model Summaryb Model R R Square Adjusted R Square Std. Error of the Estimate Durbin-Watson 1 .771a .594 .594 .7073 1.176
a. Predictors: (Constant), Total Issues Ln, Project Size Ln, Milestones Ln, Releases Ln, Forks Ln, Total Pull Requests Ln, Watchers Ln
b. Dependent Variable: Stars Ln
Table 11 ANOVA Table
ANOVAa
Model Sum of Squares df Mean Square F Sig.
1 Regression 10634.540 7 1519.220 3036.366 .000b
Residual 7267.960 14526 .500
Total 17902.500 14533
a. Dependent Variable: Stars Ln
b. Predictors: (Constant), Total Issues Ln, Project Size Ln, Milestones Ln, Releases Ln, Forks Ln, Total Pull Requests Ln, Watchers Ln
31
32
Table 13 Residual Statistics Residuals Statisticsa
Minimum
Maximum Mean Std. Deviation N
Predicted Value 2.108 7.458 4.173 .8554 14534 Std. Predicted Value -2.414 3.839 .000 1.000 14534 Standard Error of Predicted Value .007 .044 .016 .005 14534 Adjusted Predicted Value 2.107 7.457 4.173 .8554 14534 Residual -2.8620 3.7686 .000 .7072 14534 Std. Residual -4.046 5.328 .000 1.000 14534 Stud. Residual -4.048 5.330 .000 1.000 14534 Deleted Residual -2.8651 3.7718 .000 .7076 14534 Stud. Deleted Residual -4.050 5.335 .000 1.000 14534 Mahal. Distance .367 53.988 7.000 5.449 14534 Cook's Distance .000 .003 .000 .000 14534 Centered Leverage Value .000 .004 .000 .000 14534
33
Table 14 Tests of Between-Subjects Effects
Table 15 Parameter Estimates with Robust Standard Errors HC3 Tests of Between-Subjects Effects
Dependent Variable: Stars Ln Source
Type III Sum
of Squares df Mean Square F Sig.
Corrected Model 10634.540a 7 1519.220 3036.366 .000 Intercept 2877.527 1 2877.527 5751.127 .000 ProjectSizeln 133.707 1 133.707 267.232 .000 Watchersln 884.152 1 884.152 1767.098 .000 Releasesln 86.371 1 86.371 172.624 .000 Forksln 2757.158 1 2757.158 5510.553 .000 Milestonesln 4.795 1 4.795 9.584 .002 TotalPullRequestsln 147.342 1 147.342 294.484 .000 TotalIssuesln 112.100 1 112.100 224.047 .000 Error 7267.960 14526 .500 Total 271056.849 14534 Corrected Total 17902.500 14533 a. R Squared = .594 (Adjusted R Squared = .594)
Parameter Estimates with Robust Standard Errors
Dependent Variable: Stars Ln
Parameter B
Robust
Std. Errora t Sig.
95% Confidence Interval Lower Bound Upper Bound
Intercept 2.533 .033 77.053 .000 2.469 2.597 ProjectSizeln -.058 .003 -16.660 .000 -.065 -.051 Watchersln .381 .009 40.391 .000 .363 .400 Releasesln .088 .007 12.109 .000 .074 .102 Forksln .515 .007 73.312 .000 .501 .528 Milestonesln -.080 .030 -2.667 .008 -.140 -.021 TotalPull Requestsln -.080 .005 -16.446 .000 -.089 -.070 TotalIssuesln .087 .006 14.925 .000 .075 .098 a. HC3 method
34 VIII. List of Figures
Figure 1 Commercial Open Source Software Company Life Span (COSSCLS) ... 8
Figure 2 Venture Deals and Open Source Services Market (in $bn) ... 9
Figure 3 Methodology to obtain GitHub Data ... 13
Figure 4 Exponential Distribution of Stars (x) ... 14
Figure 5 Distribution of Stars per License (Without Outliers) ... 14
Figure 6 Distribution of Programming Languages and of Stars (Outliers excluded) ... 15
Figure 7 Development of Stars (Top 1% Projects) ... 17
Figure 8 Regression Assumptions ... 18
Figure 9 Scatterplots ... 19
Figure 10 R2 of Gradient Boost, Random Forest, Neural Network ... 20
IX. List of Tables Table 1 Descriptive Statistics ... 13
Table 2 Repository Information retrieved using the GraphQL Query ... 26
Table 3 Code used to query public GitHub Repositories with the GraphQL API ... 27
Table 4 Python Code used to obtain Charts about Historic Star Development ... 28
Table 5 Kruskal-Wallis Test: Licenses & Stars ... 29
Table 6 Kruskal-Wallis Test: Languages & Stars ... 29
Table 7 Mann-Whitney U Test: Secondary Language ... 29
Table 8 Mann-Whitney U Test: Homepage ... 29
Table 9 Mann-Whitney U Test: Owner Type ... 30
35
Table 11 ANOVA Table ... 30
Table 12 Collinearity Diagnostics & Coefficients ... 31
Table 13 Residual Statistics ... 32
Table 14 Tests of Between-Subjects Effects ... 33
36 X. Table of Contents
I. Introduction 2
II. Literature Review 2
Open Source was started by Enthusiastic Hackers 2
New Business Models for the Monetization of Open Source Software 5
Open Source Software is responsible for many Software Innovations 9
Risks when investing in Commercial Open Source Software Companies 11
III. Empirical Analysis 12
IV. Limitations 21
V. Conclusion 21
VI. List of References 22
VII. Additional Appendices 26
VIII. List of Figures 34
IX. List of Tables 34
X. Table of Contents 36
37 XI. List of Abbreviations
COSS Commercial Open Source Software
OC Open Core
OS Open Source
OSS Open Source Software