Occupation Study of a Surgery Service
through a Queues Model
M. A. M. Ferreira1 and J. A. Filipe
Instituto Universitário de Lisboa (ISCTE – IUL), BRU - IUL, ISTAR-IUL Lisboa, Portugal
Copyright © 2015 M. A. M. Ferreira and J. A. Filipe. This article is distributed under the Creative Commons Attribution License, which permits unrestricted use, distribution, and reproduction in any medium, provided the original work is properly cited.
Abstract
A method to study and evaluate the occupation of a Hospital Surgery Service, with some specificity in its activity, is outlined in this work. Its application is exemplified with real data and it is shown that it is simple, practical and useful and allows a practical management of the service occupation.
Keywords: Surgery service, queues, occupation, Erlang loss formula
1 Introduction
It is proposed in this work a method, based on a queues model, to study and evaluate the occupation of a Hospital (H) Surgery Service (SS), with particular characteristics quite frequent in this kind of services. The model here presented and developed is applied to real data about the activity of a H SS service in the
first three Quarters in a determined year2.
In section 2 the problem, joint with the SS characteristics, is described and Institutional data are presented. Then, in section 3, the queues model is described and the method - the main objective of this work - is outlined. In section 4 the model parameters are estimated; and in section 5 a discussion of the results is performed. The work ends with a Conclusions section.
1 Corresponding author
4792 M. A. M. Ferreira and J. A. Filipe
2 The Problem
A SS at H operates patients admitted directly from outside or transferred from the other H services.
Surgical patients stay in the service in the postoperative period and then are
discharged. There are no transferences from the SS to the other services of H. In
fact, the operated patients were either followed in other services, and
consequently transferred to the SS, or followed in the SS itself.
The SS politics is to hospitalize patients only when they have a scheduled surgery. Patients who will be operated in the SS, which surgery is not scheduled yet, wait for schedule either interned in the other H services or at home.
So patients arrivals at the service are conditioned by the operating room daily working time.
In SS there are 50 available beds for hospital patients. Here are not considered
the available beds for SS in Intensive Care Unit (IC) because when a patient is in IC his/her bed in SS is considered as occupied by him/her.
Some SS staff elements are convinced that the service is under occupied. Such a convincing is based in the fact that there is, in general, a lot of unoccupied beds in SS. And it is partially corroborated by the H inner statistic numbers that give occupation indexes for the 1st, 2nd and 3rd Quarters of the year under study of 76.08%, 68.66% and 77.46%, respectively, see Table 2.4. Note that these percentages were calculated as the ratio of the daily mean number occupied beds over the total number of 50 beds by quarter.
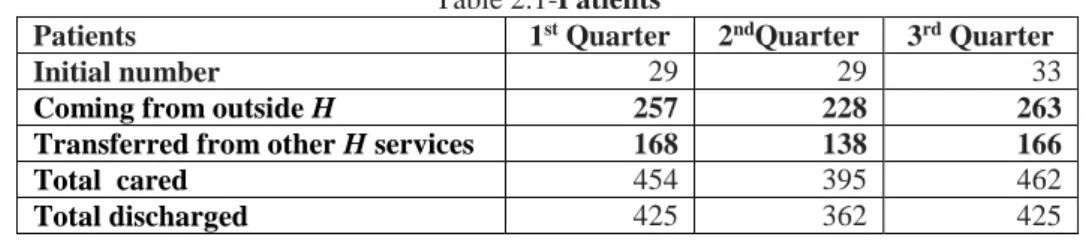
Table 2-Movement on inpatients at SS in the first three quarters of the year under study (available in H inner statistic numbers)
Table 2.1-Patients
Patients 1st Quarter 2ndQuarter 3rd Quarter
Initial number 29 29 33
Coming from outside H 257 228 263
Transferred from other H services 168 138 166
Total cared 454 395 462
Total discharged 425 362 425
Table 2.2-Deaths
Deaths 1st Quarter 2nd Quarter 3rd Quarter
Total 6 11 9
By cared patient (%) 1.32 2.78 1.94
By discharged patient (%) 1.41 3.04 2.11
Table 2.3-Hospital days
Hospital days 1st Quarter 2nd Quarter 3rd Quarter
Total 3323 2999 3421
By cared patient (%) 7.35 7.59 7.40
Table 2.4-Occupation indexes
Occupation indexes 1st Quarter 2nd Quarter 3rd Quarter
Cared patients by bed 8.85 7.54 8.85
Mean inoccupation by bed 2.46 3.78 2.34
Services occupation (%) 76.08 68.66 77.46
So, there having patients waiting for operation scheduling, those SS staff
members ask if
- In fact the service will not be working with less than 50 beds? And, if so,
with its hospital days capacity under used?
- Is it possible to increase the operating room daily time working, so
increasing the inpatients arrivals at the service in order to decrease the number of patients waiting for schedule and increasing the use of the whole SS capacity occupation?
For the moment, with the practiced schedule rhythm, there is never a lack of beds: there are no losses in the sense that there is no need of not scheduling an operation due to the lack of a bed to install the patient. That is: the observed probability of the total 50 beds occupation is insignificant. But, the surgeries rhythm increase, evidently, would increase that probability that must be kept in controllable levels. This means: such that those losses occur rarely, and may be overcome with rare SS internship capacity increases, using stretchers for instance.
3 The Model
In [1] it is suggested that it is possible to evaluate an existing service with a finite capacity in a hospital impact, modelling it as a network of queues, each one with finite servers (beds) except the one corresponding to the service with a finite capacity. This will be modelled as a Centre with finite servers with losses. The customers (patients) that arrive at this service find the whole beds occupied, are lost to the system and directed to another service.
So consider a hospital with n services 1,2, … , 𝑛. Call 𝑝𝑖𝑗 the probability that a
patient is transferred from service i to service j, 𝑖, 𝑗 = 1,2, … , 𝑛 and 𝜆𝑖 the patients
external arrivals rate at service i, 𝑖 = 1,2, … , 𝑛. The various external arrivals
processes are supposed to be Poisson processes.
Being 𝑃 = [
𝑝11 ⋯ 𝑝1𝑛
⋮ ⋱ ⋮
𝑝𝑛1 ⋯ 𝑝𝑛𝑛]the commutation matrix, see [3,4,5 and 8], that
describes the transitions among the various services, and [𝛾1 𝛾2… 𝛾𝑛] the total
4794 M. A. M. Ferreira and J. A. Filipe [𝛾1 𝛾2… 𝛾𝑛] = [𝜆1 𝜆2… 𝜆𝑛] + [𝛾1 𝛾2… 𝛾𝑛] [ 𝑝11 ⋯ 𝑝1𝑛 ⋮ ⋱ ⋮ 𝑝𝑛1 ⋯ 𝑝𝑛𝑛 ] (3.1). Suppose that the service 1 is the service with a finite capacity. That is: suppose
that this service has c servers: c beds. In [1]it is shown that in situations of
- Service times, that is: hospital days, exponentially distributed, see [6], or
- Service times with any distribution but without feedback, see[3 and 6]3,
the probability that the service 1 is fully occupied is given by the Erlang loss formula, see for instance [1 and 4]:
𝛼 = 𝜌𝑐 𝑐! ∑𝑐 𝜌𝑗!𝑗 𝑗=0 (3.2) where 𝜌 = 𝛾1 𝜇1 (3.3)
is the traffic intensity, being 𝛾1given by equation (3.1) and 𝜇1−1 the service mean
hospital days.
In the case of service times with any distribution with feedback, it is suggested in [1], as a result of computational simulations, that formula (3.2), although not exact, is a good approximation for the service 1 fully occupation probability. The authors emphasize that formula (3.2) is not exact due to the service 1 does not
behave as a 𝑀|𝐺|𝑐 queue with losses since, in these circumstances, there is no
guarantee that the total arrivals process is a Poisson process.
The problem under study in this work will not be approached in this way, because the patients that ask for hospital days in the SS flow is determined by the
operating room daily activity time instead of the external arrivals flows.
Consequently, formula (3.2) will be used as follows4:
- It is determined a value for 𝜌, called 𝜌𝑠 (𝜌 standard) after a situation where
losses are not observed (as it is the case at SS). It is possible to use for it the Little’s formula, see for instance [5], in the form
3 The feedback lack means the impossibility of a customer to come back to unity 1 after leaving it. 4 This is the method, based on a queues model, to study and evaluate the occupation of a Hospital
𝐸[𝑛] = 𝜌 (3.4) because it is assumed that there are no losses and it may be considered that SS behaves as an infinite servers queue,
- Using 𝜌𝑠 and 𝑐 = 50 in (3.2) it is determined a value 𝛼𝑠 (𝛼 standard) that
is taken as the value of 𝛼 to which in practice correspond no losses,
- After 𝛼𝑠 it is refereed a maximum value admissible for 𝛼. In the present
study it will be considered 10𝛼𝑠,
- It will be evaluated the really used hospital days capacity calculating the
value i such that 𝛼𝑖 < 10𝛼
𝑠, being 𝛼𝑖 = 𝜌𝑠50−𝑖 (50 − 𝑖)! ∑50−𝑖𝜌𝑗!𝑗 𝑗=0 , 𝑖 = 0,1,2, … (3.5). Note that 𝛼0 = 𝛼 𝑠,
- It will be evaluated the percentage in which it is possible to increase the
number of scheduled operations, calculating the value k such that 𝛼𝑘< 10𝛼𝑠,
where 𝛼𝑘 = (𝑘𝜌𝑠)50 50! ∑ (𝑘𝜌𝑠)𝑗 𝑗! 50 𝑗=0 , 𝑘 = 1; 1.05; 1.10; … (3.6). Note that 𝛼1 = 𝛼𝑠.
Note by its turn that, in accordance with [1], these formulae are exact if the number of scheduled operations by day in SS is a Poisson process. Even if this does not happen they are good approximations. Anyway, in this concrete situation, there are not enough data available to test the Poisson process hypothesis.
4 The Parameters Estimation
The estimation of 𝐸[𝑛] was performed calculating the ratio of the total
Hospital days, see Table 2.3, in the first three Quarters of the year over 274, the
first 9 months of the year number of days. It was obtained 𝜌𝑠 = 35.558394165.
In Table 4.1 the values of 𝛼𝑖⁄𝛼0, 𝑖 = 1,2, … ,10 are presented:
5 So directly observed values were used and the values calculated after the observed ones were
4796 M. A. M. Ferreira and J. A. Filipe Table 4.1-𝜶𝒊⁄𝜶𝟎, 𝒊 = 𝟏, 𝟐, … , 𝟏𝟎
In Table 4.2 the values of 𝛼𝑘⁄ , 𝑘 = 1; 1.05; … ; 1.40 are presented: 𝛼1
Table 4.2-𝜶𝒌⁄𝜶𝟏, 𝒌 = 𝟏; 𝟏. 𝟎𝟓; … ; 𝟏. 𝟒𝟎 k 𝛼𝑘 𝛼𝑘 𝛼1 ⁄ 1 0.43% 1 1.05 0.83% 1.93 1.10 1.47% 3.42 1.15 2.37% 5.51 1.20 3.54% 8.23(<10) 1.25 4.98% 11.58 1.30 6.65% 15.47 1.35 8.51% 19.79 1.40 10.51% 24.44
5 Discussion
It is clear, according to the chosen criterion, that
- From Table 4.1, with 42 beds (note the values in bold at Table 4.1), in the
present conditions, the SS performance should not be substantially different from the actual.
So, the SS real internship capacity should be estimated in 84%, greater than the 74% that is the SS weighted mean for the three first Quarters,
- From Table 4.2, an increase of 20% (note the values in bold at Table 4.2)
in the operating room working time6 should be accommodated with no problems
by SS.
6 Admitting that the number of hospital days is directly proportional to the operating room working
time. i 𝛼𝑖 𝛼𝑖 𝛼0 ⁄ 0 0.43% 1 1 0.60% 1.4 2 0.83% 1.93 3 1.13% 2.63 4 1.51% 3.51 5 1.99% 4.63 6 2.56% 5.95 7 3.26% 7.58 8 3.57% 8.30(<10) 9 5.01% 11.65 10 6.01% 14.19
This supports the staff opinion of SS under occupation. Really, with 42 beds
the calculated SS full occupation probability is 3.57%. So, there having had 12207
demands for hospital days in the first three Quarters of the year, this means that it should be expected the existence of problems in 44 cases (a monthly mean of 5).
Increasing the scheduling rhythm in 20%, there should have 1464 demands for hospital days in the same period. And the expected existence of problems should be in 52 cases (a monthly mean of 6).
So, eventually, 5 or 6 times per month an extra bed, a stretcher, should be necessary, in cases of reduction of the number of beds or a scheduling increase, respectively, considered.
Of course, the use of this model requires small values of 𝛼𝑠. In the situation
here studied it was 0.43%. If this does not happen the hypothesis of an observed situation with no losses must be discarded.
6 Conclusions
The method presented in this study is obviously simple, practical and useful. It relies on some credible assumptions about the queues used to model the Hospital
services behavior and on the admissible ranges for αi and αk, arbitrary as it was
pointed in the text, being determined after the manager experience and the risk judged admissible.
References
[1] J. C. Hershey, E. N. Weiss, M. A. Cohen, A stochastic service network
model with application to hospital facilities, Operations Research, 29 (1981), 1, 1-22. http://dx.doi.org/10.1287/opre.29.1.1
[2] J. A. Filipe, M. A. M. Ferreira, Infinite Servers Queue Systems Busy
Period - A Practical Case on Logistics Problems Solving, Applied Mathematical Sciences 9 (2015), 25, 1221-1228. http://dx.doi.org/10.12988/ams.2015.410808
[3] M. A. M. Ferreira, Redes de Filas de Espera, Master Thesis discussed in
IST-UTL, Lisboa (1987).
[4] M. A. M. Ferreira, Comportamento Transeunte e Período de Ocupação de
Sistemas de Filas de Espera sem Espera, PhD. Thesis discussed at ISCTE, Lisboa (1995).
[5] M. A. M. Ferreira, Modelling and differential costs evaluation of a two
echelons repair system through infinite servers nodes queuing networks, Applied Mathematical Sciences 7(2013), 112, 5567-5576.
4798 M. A. M. Ferreira and J. A. Filipe
http://dx.doi.org/10.12988/ams.2013.38478
[6] M. A. M. Ferreira, Stochastic processes in networks of queues with
exponential service times and only one class of customers, Applied Mathematical Sciences 8 (2014), 109-112, 5497-5505.
http://dx.doi.org/10.12988/ams.2014.47522
[7] M. A. M. Ferreira, M. Andrade, J. A. Filipe, Studying pensions funds
through an infinite servers nodes network: a theoretical problem. Journal of Physics: Conference Series 394 (2012), 1, Article number 012035.
http://dx.doi.org/10.1088/1742-6596/394/1/012035
[8] R. L. Disney, D. König, Queueing networks: a survey of their random
processes, SIAM Review, 27(1985), 3, 335-403. http://dx.doi.org/10.1137/1027109