* Portuguese Ministry of Economy, Lisbon, Portugal
** Instituto Universitário de Lisboa (ISCTE-IUL), DINÂMIA’CET-IUL, Lisboa, Portugal,
*** We thank Emanuel Leão, Filipa Sampaio, Ricardo Pinheiro Alves, Sérgio Nunes and Caldeira
Cabral for their useful comments, José Gonzaga Rosa for granting access to the EIM database, and Michael Overesh for the data on corporate taxes.
JEL CLASSIFICATION: F21, F23, H25, H32. ABSTRACT: European countries face ev-er-increasing competition for Foreign Direct Investment (FDI). This paper studies how corporate taxes affect the location of FDI in Europe. Using firm-level data, we start by analysing the impact of the level and volatility of three tax rates on FDI: effective, statutory, and marginal tax rates. Next, we investigate how economic and monetary integration influences the effect of taxes on FDI. Finally, we focus on how the impact of taxes varies by project characteristics and sector: expansion versus new investment, industry versus services, high-tech versus low-tech manufacturing industries, and high versus low capital intensity firms. We conclude that stable taxes play a significant
role in attracting FDI and, most important-ly, that lowering taxes fosters FDI especially when the country has a high tax rate or is outside the euro area. There are some nu-ances in this relationship that are relevant to policymakers. Tax cuts are particularly important in stimulating foreign firms al-ready in situ to expand their activities and in attracting industrial businesses. Finally, capital-intensive projects are less sensitive to taxes, but high-tech manufacturing proj-ects have the same reaction to tax rates as other manufacturing projects.
KEY WORDS: FDI, location decisions, corporate tax rate, economic and monetary integration, project characteristics.
https://doi.org/10.2298/EKA1817039S
Tomás Silva*
Sérgio Lagoa**
CORPORATE TAXES AND THE LOCATION
OF FDI IN EUROPE: THE IMPORTANCE
OF ECONOMIC INTEGRATION AND
1. INTRODUCTION
Foreign Direct Investment (FDI) has become increasingly important globally and notably in Europe since the second half of the 20th century, and especially since 1990. FDI inflows to European countries had an overall positive trend between 1990 and 2009, but with large oscillations (see Figure 1).
Europe is one of the most popular FDI destinations, receiving approximately 43% of global FDI inflow between 1990 and 2009. However, European countries are struggling to maintain their attractiveness in the face of increasing competition from emerging economies. The motives behind choosing a destination for FDI can be grouped into four categories: natural resource seeking, market seeking, efficiency seeking, and strategic asset or capability seeking (Dunning 1980). The most important FDI determinants resulting from these motives are market size, labour costs, economic growth, international trade, agglomeration effects, and corporate taxes.
Allegedly, corporate taxes are the policy instrument that has the most immediate effect on FDI, which is why corporate tax rates have fallen significantly in recent decades across the globe.1 Devereux et al. (2008) show that the average corporate tax rate of OECD countries in the early 1980s of nearly 50% had fallen to below 35% by 2001. According to the data used in this paper, the average corporate tax rate (measured by the statutory tax rate, i.e., the legally imposed rate) of 29 European countries fell from 33.4% in 1998 to 25.1% in 2006.
Although there is a generalised notion that corporate taxes may be an important determinant of FDI, the empirical literature presents diverse results. Devereux and Griffith (2002) state, “there is some evidence that taxes affect a firm’s location and investment decisions, although we do not have a very good idea about the size of this effect”. The different results essentially arise from diverse measures of tax rates, FDI data, and econometric methods.
1 Some authors study the relationship between the decline in tax rates and increasing capital market integration, and whether countries compete using corporate tax rates (for example Devereux et al. 2008 and Overesch and Rincke 2009). It is assumed that countries reduce their corporate tax rates in response to increasing capital market integration. However, the literature provides no clear explanation of why and how countries adjust their tax systems (Overesch and Rincke, 2008).
This paper estimates the impact of taxes on inward FDI flows to Europe using project-level data to study the interaction of taxes with both the macro characteristics of the host country and the micro elements of FDI projects. At the macro level we analyse countries that belong to favoured economic areas, the European Union and the European Monetary Union (EMU). At the micro level we examine the interaction between taxes and specific project characteristics, such as sector, technology, and capital intensity. The empirical analysis uses three measures of corporate taxation but focuses on the effective average tax rate, which in the literature is deemed to be the most appropriate for explaining FDI location decisions (Devereux and Griffith 1998).2
This paper contributes to the literature in three ways. First, it uses a nine-year (1998 to 2006) project-level dataset consisting of 20,886 real investment projects from around the world, hosted in 29 European countries. This contrasts with most studies in the literature, which use national aggregate statistics that often do not separate FDI related to real activity from pure financial transactions, and which are much more prone to suffer from endogeneity, as FDI can also affect macro explanatory variables. Even though some studies have used firm-level data to study the effect of taxes on FDI, our dataset allows direct control of project characteristics, which may differ from firm characteristics, notably in large conglomerates. Moreover, the use of micro data to study FDI is more recent in Europe than in the USA (Feld and Heckemeyer 2011). In addition, the period analysed is of interest because it comprises two periods of FDI expansion interrupted by contractions, with corporate tax rates showing a strong downward trend. Second, the paper analyses how the FDI response to taxes depends on specific project characteristics. Finally, this paper evaluates whether a country being in a favoured economic area affects the impact of corporate taxes on the location of FDI.
2 The EATR is an estimation of the tax rate a firm effectively faces, taking into account all the aspects of the tax code; for example, fiscal benefits and deductions.
Figure 1: FDI inflows to Europe
Source: Data from UNCTAD and authors’ graph.
Given that FDI has a positive effect on the host economy (Borensztein et al. 1998), our results should be of interest to policymakers. For instance, the huge success of Ireland and the Netherlands in attracting FDI, notably in services, was partly due to a strong fiscal stimulus. Our results will also be useful to multinational companies investing in Europe, as they represent a benchmark for multinationals’ behaviour.
The estimated conditional logit model allows us to conclude that if the host country’s effective tax rate falls by one percentage point (pp), the odds ratio of this country receiving a FDI project increases by about 3.1%.3 The effect of low taxes is greater when tax rates are stable and when the country already has a high tax rate or is outside the euro area. However, there are some nuances in this relationship that are relevant to policymakers. Tax cuts are particularly important when a country wants foreign firms already in situ to expand their activities, or wants to attract industrial firms. Finally, capital-intensive projects are less sensitive to taxes, but high-tech manufacturing projects have the same reaction to taxes as other manufacturing projects.
The remainder of this paper is structured as follows. Section 2 presents a review of the literature on corporate taxes and FDI. Section 3 describes the data used in the empirical work. Section 4 explains the econometric approach and Section 5 presents and discusses the empirical results. Finally, Section 6 concludes.
3 The odds ratio is equal to the probability of locating in a country, p, divided by the probability of not locating in that country, i.e., .p/ 1 p..
2. A REVISION OF SELECTED LITERATURE ON CORPORATE TAXES AND FDI
Hartman’s (1984) study was one of the first works on the effect of corporate taxes on FDI, and concludes that while taxes negatively affect investment based on retained earnings, they have no effect on FDI based on new transfers. Hartman’s research has some limitations and was soon followed by a series of studies seeking to confirm his findings, leading to a substantial growth of the literature (for an extensive survey see, for example, de Mooij and Ederveen 2003).
Slemrod (1990), using effective tax rates, concludes that corporate taxes do in indeed repel FDI, notably FDI based on the transfer of funds, contradicting Hartman’s findings. Slemrod adds that there is no evidence that the parent country’s system of dealing with double taxation (exemption or credit) is a relevant determinant of FDI.
These two papers were the first devoted to the study of inward FDI in the US and used aggregate data. These data have limitations, in particular, it includes investments such as mergers and acquisitions (M&A) that involve an ownership decision and are not real investment decisions. Auerbach and Hasset (1993) argue that real and financial investments may be differently affected by taxes, which is validated in later research.
Building on this notion, Swenson (2001) studies inward FDI in the US from 46 countries and distinguishes six types of FDI. She argues that in most of the countries the statutory tax rate negatively affects investment in new plants and plant expansion, while the effect on mergers and acquisitions is positive for all countries. Swenson also notes that investment in new plants is more sensitive to taxes than investment in plant expansion, probably because companies’ current choices may be constrained by their prior decisions.
In order to overcome the limitations of aggregated FDI data, some studies on the US have instead used data on property, plant, and equipment (PPE), which is thought to be a better measure of real investments (Grubert and Mutti 1991, Hines and Rice 1994, Hines 1996). Hines and Rice (1994) study nonbank companies and obtain a higher tax elasticity than Grubert and Mutti (1991), who only use data on manufacturing firms. This suggests that non-manufacturing firms (excluding banks) probably respond more to taxes than manufacturing firms. In general, the studies using PPE find a larger negative
effect of taxes on FDI than the previous studies that used aggregate data (Hines 1999).4
Another strand of the literature uses firm-level data, as is the case of Devereux and Griffith (1998), who analyse the decision of US multinational firms to invest in Europe using a nested multinomial logit model. The location decision, which is the last step in the authors’ model, is part of a conditional logit model, similar to that used in this paper. The authors find that an increase in the effective tax rate significantly reduces the probability of a country receiving FDI, while the statutory and marginal tax rates do not play a significant role.5 Devereux and Griffith also find that the effective tax rate becomes insignificant when only new entrants are considered.
Buettner and Ruf (2007) use a panel of non-financial subsidiaries of German multinationals between 1996 and 2003. Their approach also uses a discrete choice analysis with a fixed-effect logit model to test the relevance of alternative measures of taxation. The marginal effective tax rate has no effect on location decisions, as in Devereux and Griffith (1998). In addition, the statutory tax rate has a considerably stronger effect on FDI decisions than the effective average tax rate.
Barrios et al. (2012) use multinational firm-level data to add to the debate on whether multinational firms’ decision to invest in a country is affected by additional taxation in the parent country as well as the host-country tax rate. Stowhase (2002) uses data on German multinationals that invested in EU countries between 1991 and 1998, and distinguishes between investment for profit-shifting and investment in real activity. The author argues that while the former type of investment is affected by the statutory tax rate, the latter is more conditioned by the effective tax rate because it responds to a broader range of tax incentives that are best measured by this tax rate. Using count data, Stowhase confirms the hypothesis that investment in production activities is affected by the effective tax rate but not by the statutory rate, whereas
4 Hines’ (1996) study, which also uses data on PPE, is of particular interest because he introduces dummy variables in his model to capture state fixed-effects. In this way, he seeks to address one of the limitations of using cross sectional data, namely the possible correlation of taxes with unobserved state characteristics (Hines 1999).
investment related to profit shifting (services, finance, R&D) is more severely affected by the statutory tax rate.
The last result is not unexpected because, as Devereux (1992) suggests, multinationals may locate production in a country where pre-tax profits are maximised, and afterwards shift profits to a country with a lower statutory tax rate. Other studies have further explored the issue of profit-shifting – see, for example, Haufler and Schjelderup (1999 and 2000) and Huizinga and Laeven (2008).
Stowhase (2006) uses a panel of bilateral aggregate data on outward FDI – disaggregated by primary, secondary, and tertiary sectors – from Germany, the UK, and the Netherlands into eight European countries between 1995 and 1999. He finds that whereas the primary sector is unaffected by the effective tax rate, the secondary and tertiary sectors are, and that the latter are the most affected. Another study exploring the sectorial dimension uses a Poisson count model to examine the impact of taxes on the birth of industrial firms across US states (Papke 1991). He notes an overall significant impact of taxes on the location of manufacturing plants, but with substantial variation across different industries. The effective tax rate has a negative and significant effect (but with wide quantitative differences) on investments in apparel, furniture, and communication equipment industries, but has no effect on the electronic equipment industry.
The survey of de Mooij and Ederveen (2003) provides an extensive synthesis of the literature on the effect of taxation on FDI. They compare the results of 25 empirical studies and find a mean semi-elasticity of –3.3, suggesting that a 1 pp. decrease in the host country’s tax rate raises FDI by 3.3%. However, they indicate that the studies’ results vary substantially due to differences in data (both on taxes and FDI) and in the econometric specifications.
Feld and Heckemeyer (2011) conduct a meta-analysis and obtain a median tax semi-elasticity of FDI of –2.49. They also find that studies using aggregate data systematically obtain larger elasticities than firm-level data studies.
Several points emerge from the literature described above. First, the impact of taxes on FDI depends on the exact measure of the tax rate used (statutory, effective, or marginal). Second, the effect of taxes on FDI seems to differ across
sectors, and different definitions of the tax rate have different effects across sectors. Third, project’s characteristics, such as whether it is a new project or an expansion, are important in determining the effect of taxes. Our paper aims to contribute to these issues.
3. DATA 3.1. FDI
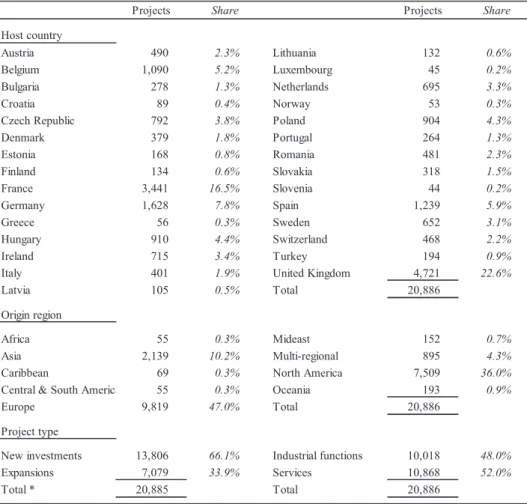
In this paper we use data on FDI projects from the European Investment Monitor (EIM) of Ernst & Young (EY), which includes announcements of FDI projects that involve real investment in manufacturing or services in Europe. Mergers and acquisitions and other financial flows not resulting in any real investments are excluded.6 The use of a firm-level dataset provides an exact picture of real investment decisions by directly studying factual location decisions conducted by multinational firms, and thus constitutes a valuable addition to the literature.
The dataset covers the period from 1998 to 2006 and includes 20,886 FDI projects originating in 95 countries and implemented in 29 European countries. A total of 15,547 multinationals implemented projects; 13,056 of them had only one project, 1,532 had two projects, and 959 had three or more projects. The dataset contains information on the country of origin, the company, the type of investment (new or expansion), the sector, the capital invested, and the number of jobs created. Table A. 2 in the Appendix shows descriptive statistics concerning mainly the geographical distribution of FDI projects.
3.2. Corporate taxes
The literature discusses extensively which is the best tax rate to explain FDI. The most common types of tax rate are the statutory tax rate (STR), effective average tax rate (EATR), and effective marginal tax rate (EMTR). The first has been shown to be relevant to FDI decisions and is viewed as particularly important in the profit-shifting decisions of multinational companies (Huizinga and Laeven 2008). A clear advantage of the STR is that it does not require laborious computation and is easier to use. Consequently, it is the correct rate to use when studying firms that do not make very sophisticated decisions. However, the STR
6 For further details of the methodology of the EIM database see, for example, Ernst & Young (2011).
omits important features of the tax burden on real investment, such as fiscal benefits, credits, deductions, depreciation allowances, and non-income taxes. The EATR estimates the level of taxes that companies actually face, taking into consideration several features of tax codes. Studies on FDI tend to support the view that the EATR is the most appropriate measure of corporate taxation. The EATR is a more complex measure of taxation than the STR and reflects all relevant income and non-income taxes and other important aspects of tax codes. Finally, calculation of the EMTR is based on the tax burden on a firm’s marginal investment. In the literature, the EMTR proves mostly insignificant regarding FDI location decisions because many location decisions are not marginal (Devereux and Griffith 2003).
Devereux and Griffith (1998) suggest that investors choose a location by comparing each location’s after-tax level of profit, and that the EATR is the relevant measure to use. Meanwhile, the EMTR determines the optimal level of production in each potential location, which affects the decision indirectly. Devereux and Griffith argue that although both tax measures can affect the location decision, the direct effect of the EATR outweighs the indirect effect of the EMTR.
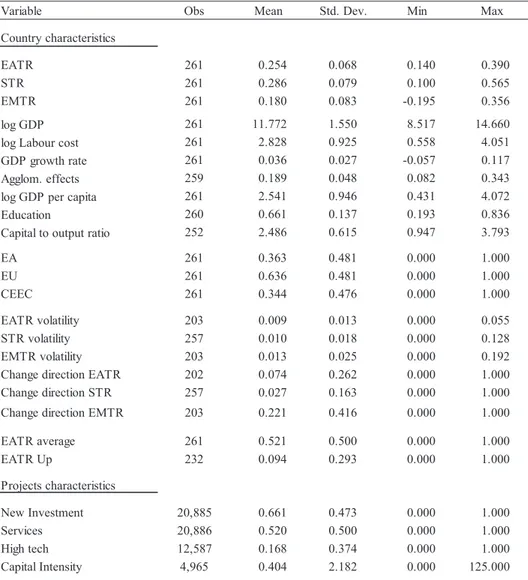
In the empirical work we use Overesch and Rincke’s (2008) data for the three measures of corporate taxation described above. They calculate STR as the headline tax rate on corporate income adjusted for surcharges and local income taxes. For the EATR and EMTR they use the methodology proposed by Devereux and Griffith (2003) and the European Commission (2001) assumptions. In essence, this method consists of determining the effective tax level of a hypothetical standardised investment project. This standardised investment project involves investment in buildings, machinery, intangible assets, inventories, and financial assets. The pre-tax rate of return is assumed to be 20%, in accordance with the European Commission (2001). Table A. 1 in the Appendix shows the relevant descriptive statistics for the tax data.
3.3. Other variables
We include seven control variables commonly mentioned in the literature as FDI determinants: gross domestic product (GDP) in nominal terms as a measure of market size; GDP per capita to measure the overall degree of development; yearly nominal compensation per employee as an indicator of labour costs; yearly real GDP growth rate as an indicator of economic
dynamism; gross value added (GVA) in manufacturing as a percentage of total GVA to measure agglomeration effects in the host country; the percentage of population between 15 and 64 years of age with secondary or tertiary education (ISCED levels 3 to 8) as a measure of the quality of human capital; and the net capital-to-output ratio of the total economy to capture investment saturation.7 The first three variables were used in logarithmic form. GDP, GDP growth rate, GVA in manufacturing, secondary and tertiary education, and GDP per capita were collected from Eurostat, and the yearly nominal compensation per employee and capital output ratio were obtained from the AMECO database. The rest of the variables will be described as they are introduced. Table A. 1 shows descriptive statistics for the control variables.
4. ECONOMETRIC APPROACH
To study empirically how multinational firms choose from among several possible locations for FDI, we adopt a version of the multinomial logit model developed by McFadden (1974) – the conditional logit model or “McFadden’s choice”. After deciding to undertake a project abroad, a multinational company has to choose where to locate its investment. Hence, a company realising project
i chooses the location j where it maximises profits. This choice can be described
as
1 2
1 e max e, , , e e ij ij i i im y if 0 ij y otherwise where e ij denotes the expected profit of project 1, , i in country n j . 1, ,m
The expected profit is a function of country characteristics, x , and of project ij
characteristics, z , and an unobserved random element, i ij:
' ' , 1, ,
e
ij ij i j ij j m
x z
The model allows country-specific variables for all alternatives, not just the chosen alternative. There is only one coefficient to be estimated for each country-specific variable, but there are j coefficients to be estimated for each
7 The capital output ratio and education variable are not available for Turkey, so our analysis is restricted to 28 countries.
project-specific variable. In the model the unobserved time-invariant country characteristics that impact the probability of attracting FDI projects are translated into country fixed effects. These characteristics include, for instance, geographical location, language, culture, and infrastructures. The introduction of country fixed effects eliminates the possibility of correlation between taxes and unobserved country characteristics (Bartik 1985, Phillips and Goss 1995, Hines 1996, Buettner and Ruf 2007). In addition, one of the coefficients j has
to be set equal to zero as only m - 1 of those coefficients are free to vary. As we discuss below, the country chosen for this normalisation was France.
A possible limitation of the conditional logit model is the assumption of independence of irrelevant alternatives (IIA), which implies that the ratio of the probabilities of any pair of alternatives is independent of the set of other alternatives (McFadden 1974). If that assumption is verified, the unobserved profit will have an error term that is uncorrelated across alternatives. A good discrete choice model will capture all the relevant observed characteristics affecting the location decision, leaving the error term uncorrelated.
The most used test for the IIA hypothesis is the Hausman test (Hausman and McFadden 1984). The model comprising all the alternatives, which generates an efficient estimator under the null, is compared with a model in which some alternatives are restricted, and that generates a consistent estimator. In practice, this test requires the computation of several models by restricting one alternative at a time, and the comparison of each one of these models against the model with all the alternatives.
5. EMPIRICAL RESULTS 5.1. Tax rate levels
We start by assessing each measure of taxation one at a time. Columns 1, 2, and 3 in Table 1 include the three measures of corporate taxation, EATR, STR, and EMTR, respectively (standard errors are robust to the presence of heteroskedasticity). Besides the seven control variables described above, a time trend for each country was introduced in order to measure FDI country-specific trends.
Table A. 3 in the Appendix shows the results of the Hausman test for the model with EATR – the base model of this paper.8 There is no evidence to reject the null hypothesis, which suggests that the difference in coefficients between the efficient and the consistent model is not systematic, supporting the assumption of IIA.9 These results ensure that the estimator based on the conditional logit model is consistent and efficient.
Of the control variables, only the GVA in manufacturing is not statistically significant. Overall, the impact of the control variables is as expected. In line with the literature, a larger market, stronger economic growth, better quality of human capital, lower labour costs, and lower capital-to-output ratio increase the probability of a country receiving FDI. The impact of the last variable means that FDI goes to countries with greater need of capital. GDP per capita has a negative effect on FDI, the reasons for which are not entirely clear, but are probably related to business costs not appropriately captured by the independent variables that are smaller in less developed countries; or with larger profit opportunities for foreign investors serving the internal market, due to lower competition or higher growth prospects.
Country fixed effects are normalised using France as the base alternative, as this country is among those that received most projects and belongs to both the EU and the euro area. Consequently, the more negative the estimated constant, the less attractive the country’s unobserved characteristics are for investors vis-à-vis France, and the opposite occurs when the constant is more positive. In all four specifications of the model these coefficients turn out to be significant for almost every country, the exceptions being Greece, Portugal, and Slovenia. Thus, these countries’ unobserved characteristics are equally attractive to those of France.10 The countries with unobserved characteristics that are more appealing to investors than those of France are Austria, Belgium, Denmark, Finland, Ireland, Luxembourg, Netherlands, Norway, Sweden, Switzerland, and the UK. Finally, the countries with characteristics less attractive for FDI are most of the Central and East European Countries (CEEC), Germany, Italy, and Spain.
8 See Table 1, column 1, for the estimation output of the base model.
9 Note that in one case the Hausman statistic is negative. Although it is theoretically impossible for a statistic distributed as a Chi-square to assume a negative value, the Hausman statistic may be negative in applications “due to lack of positive semidefiniteness in finite sample applications” (Hausman and McFadden 1984). In any case, a negative Hausman statistic is evidence in favour of the null.
Table 1: Base models
Note: The model includes a country-specific time trend not reported to save space. Robust
standard errors in parentheses. Following McFadden 1974, the Pseudo-R2 is defined as 1 - L1/L0, where L1 is the log likelihood of the full model and L0 is the log likelihood of the "constant only" model. ***, **, and * indicate significance at 1%, 5%, and 10%, respectively.
Rob. SE Rob. SE Rob. SE
EATR -3.181*** (0.793)
STR -1.227** (0.557)
EMTR -1.552*** (0.419)
log GDP 3.130*** (0.716) 2.907*** (0.215) 2.987*** (0.710)
log Labour cost -2.071*** (0.579) -1.816** (0.572) -1.876*** (0.569) GDP growth rate 6.147*** (1.201) 6.034*** (1.205) 5.922*** (1.196)
Agglom. effects 1.791 (1.774) 2.421 (1.772) 2.830 (1.720)
log GDP per capita -6.534*** (1.492) -7.352*** (1.486) -6.760*** (1.489)
Education 3.642*** (0.954) 4.179*** (0.956) 3.700*** (0.956)
Capital to output ratio -1.685*** (0.578) -1.997*** (0.573) -1.816*** (0.574)
Austria 5.498*** (1.500) 5.370*** (1.503) 5.276*** (1.497) Belgium 4.602*** (1.328) 4.254*** (1.325) 4.209*** (1.315) Bulgaria -13.478** (3.871) -16.240*** (3.810) -14.359*** (3.836) Croatia -6.130** (2.876) -8.081*** (2.825) -6.704** (2.847) Czech Republic -5.006*** (1.708) -6.103*** (1.683) -5.327*** (1.695) Denmark 4.630*** (1.763) 4.363*** (1.761) 4.359** (1.754) Estonia -4.411 (3.238) -6.736** (3.170) -5.205 (3.194) Finland 4.137** (1.700) 4.137** (1.700) 3.915** (1.693)
France - Base Alternative
----Germany -1.966*** (0.407) -1.776*** (0.407) -2.018*** (0.406) Greece -1.296 (1.169) -1.735 (1.164) -1.530 (1.164) Hungary -7.296*** (2.471) -8.934*** (2.440) -7.631*** (2.461) Ireland 5.482*** (1.948) 5.347*** (1.950) 5.414*** (1.942) Italy -2.158*** (0.262) -1.965*** (0.271) -2.499*** (0.280) Latvia -9.057** (3.609) -11.656*** (3.544) -9.920*** (3.570) Lithuania -8.984*** (3.201) -11.286*** (3.143) -9.693*** (3.166) Luxembourg 11.639*** (3.732) 11.115*** (3.730) 11.045*** (3.715) Netherlands 3.042*** (0.990) 2.886*** (0.988) 2.918*** (0.984) Norway 5.016** (2.163) 4.945** (2.166) 4.982** (2.159) Poland -11.135*** (2.576) -12.806*** (2.552) -11.624*** (2.564) Portugal -0.267 (1.354) -0.955 (1.339) -0.669 (1.331) Romania -15.973*** (3.801) -18.486*** (3.760) -16.730*** (3.777) Slovakia -7.582*** (2.741) -9.779*** (2.673) -8.738*** (2.700) Slovenia -1.543 (2.520) -3.016 (2.478) -2.195 (2.484) Spain -1.133* (0.595) -1.509** (0.586) -1.233** (0.590) Sweden 5.058*** (1.563) 5.345*** (1.569) 5.125*** (1.564) Switzerland 6.222*** (1.859) 6.478*** (1.865) 6.252*** (1.858) United Kingdom 0.505** (0.212) 0.812*** (0.191) 0.655*** (0.197) Log Likelihood Pseudo-R2 Nr of alternatives Nr of cases Nr of observations -51,950 0.18793 0.18784-51,955 0.18791-51,951 28 19,497 520,015 28 19,497 520,015 28 19,497 520,015
Even though all three tax measures show negative and statistically significant coefficients, the EATR clearly has the largest negative effect on FDI. Contrary to the results of Devereux and Griffith (1998), we find a significant negative impact for the EMTR, although less than that of the EATR. The STR has the smallest coefficient but is also statistically significant. Note that the STR’s coefficient is smaller in our results than in the study of Buettner and Ruf (2007). They suggest that STR has a greater impact than EATR because the location of subsidiaries by German multinationals may be partially driven by profit-shifting opportunities. The estimated coefficient of EATR indicates that a 1 pp. decrease in this tax rate raises the odds ratio by about 3.1%. The impact on the country’s location probability can also be obtained by computing the marginal effects (Cameron and Trivedi 2009):
1
ij ij ij ij p p p x (1)Therefore, as the marginal effects are non-linear across p, it becomes necessary
to estimate them for certain levels of probability. For instance, if we assume a country has a current location probability of 3.5%,11 if the tax rate decreases by 1 pp. the marginal effect on the probability is 0.1 pp. or roughly equivalent to a 3% increase. The impact on the location probability is non-linear across the level of probability, such that the closer the probability is to 50%, the smaller the percentage impact. For example, for the UK, which is the country with the highest probability of receiving a project (around 22.6%), a 1 pp. decrease in the tax rate increases the probability by 0.55 pp. (only a 2.4% increase).
Let us now compare our estimates with the two important studies mentioned above, using micro data. Devereux and Griffith (1998) do not find a statistically significant role for the STR, but their results indicate that a 1 pp. decrease in the EATR increases the odds ratio by about 6.8%, which is more than twice as much as our result. Buettner and Ruf (2007), using a measure of EATR similar to ours, find an impact on the odds ratio of only 1.3%, although not statistically significant at the 10% level. They also indicate that when the STR decreases by 1 pp. the odds ratio increases by 2.5%, more than three times our result for that rate.
11 Equivalent to all 28 countries having the same probability of receiving an FDI project, i.e., 100% / 28 3.5%
It is also interesting to compare the impact of the EATR with that of some of the control variables. For instance, on average, a 1 pp. decrease in the EATR has an effect on the odds ratio similar to a decrease in the labour costs (yearly nominal compensation per employee) of about 110 € per employee, or 1.53%. In turn, the GDP growth rate would have to increase by about 0.5 pp. This clearly suggests that corporate tax rates are an effective policy instrument for attracting FDI.
It is possible to conjecture that taxes repel FDI more strongly at higher values of the tax rate. Bellak and Leibracht (2009) suggest that reductions in corporate taxes only have an effect above a certain tax rate threshold. Moreover, Bénassy-Quéré et al. (2005) argue that larger tax differences between countries should have a bigger impact than smaller differences, because moving businesses to other countries is costly, several tax rules allow a partial reduction in taxes, and there is imperfect information about tax rules.
To evaluate the validity of that conjecture we test whether the tax rate has a larger effect for countries that have a tax rate in each year that is above the average for all countries. A binary variable indicating whether the country was in that situation (here called “average”) is multiplied by the EATR. The results indicate that in countries with an above-average tax rate, the tax rate has a smaller impact on FDI: the semi-elasticity is reduced by 0.387 pp. (Table 2, column 1). This result could be driven by the fact that the same pp. increase in the tax rate represents a smaller percentage increase of this rate when the country’s tax rate is above the average, which stems from the fact that we are using the tax rate semi-elasticity.
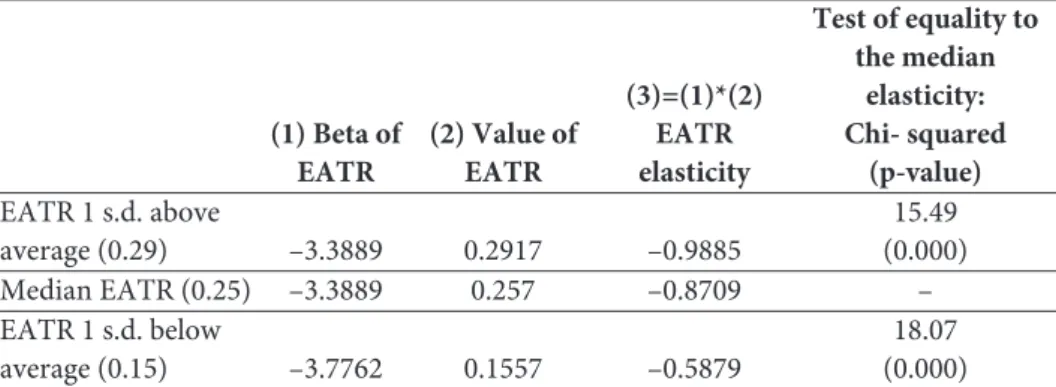
We then compute the tax rate elasticity by multiplying the coefficient of taxes by the tax rate. Since that elasticity changes with the tax rate, we compute its value for different values of this rate. Taking the year 2006 as an example, Table 3 indicates that, as expected, the tax rate elasticity is greater for countries with a tax rate above the average. A country with a tax rate one standard deviation above average (0.29) has an elasticity of –0.98, whereas a country with a tax rate one standard deviation below average (0.15) has an elasticity of –0.58.
Another possible non-linearity is that increases in taxes have a greater impact in repelling FDI than decreases in taxes do in attracting it. Bénassy-Quéré et al. (2005) conclude that FDI does not respond to lower taxes in the home country than abroad, but is negatively affected by higher taxes in the home country than
the host country. They argue that under a crediting system of double taxation, the tax rate of the host country affects the decision only when it is higher than the rate in the home country.12 Head et al. (1999) find a similar asymmetric effect in Japanese firms investing in the US: they are not attracted by low taxes but are discouraged by high tax rates.
This type of non-linearity was tested by creating a dummy variable, named “up”, to identify increases in tax rates, and multiplying it by the tax rate. Results indicate that for the EATR and EMTR, increases in taxes have a larger impact on FDI than decreases – 0.13 pp. more for the EATR (Table 2, column 2) and 0.16 more for the EMTR. No difference was found between increases and decreases for the STR.13
5.2. Tax rate volatility
Thus far the results reported in this paper suggest that the level of tax burden is a significant determinant of FDI. The volatility of taxes may also deter investors because frequent tax changes induce uncertainty regarding the future evolution of tax policy. This interferes with the agents’ projection of after-tax profits, and is especially harmful for more risk-averse investors and for projects having a greater degree of irreversibility. Interestingly, this aspect has not received much attention in the literature, except for Edmiston et al. (2005). In their study, Edmiston et al. conclude that uncertainty regarding the tax law repels FDI. More generally, some papers study the impact of legal structure and corporate governance on FDI (Bellos and Subasat 2012).
12 Under a crediting system, the tax rate of the home country is applied to profits, and a credit is granted for the taxes paid in the host country up to the tax rate of the home country. 13 Results for STR and EMTR are available upon request.
Table 2: Tax rate asymmetry and volatility
Note: the coefficients of the control variables, which are the same as used in Table 1, the constants
for each country, and a country-specific time trend are not reported to save space. Robust standard errors in parentheses. In (3) to (5) the cases for 1998 and 1999 were lost. ***, **, and * indicate significance at 1%, 5%, and 10%, respectively.
(1) Above
average (2) - Up (3) -EATR volatility (4) - STR volatility (5) - EMTR volatility
EATR -3.776*** (0.387) EATR* Average 0.387** (0168) EATR -1.545* (0.864) EATR*UP -0.137*** (0.035) EATR -3.362*** (1.298) Std. Dev. EATR 0.328 (1.470)
Change Direction EATR -0.048
(0.039) STR -1.013*** (1.008) Std. Dev. STR 2.424 (1.493) Change Direction STR -0.195*** (0.069) EMTR -1.996*** (0.627) Std. Dev. EMTR -1.536* (0.882)
Change Direction EMTR -0.058**
(0.026) Log Likelihood -51,947 -48,783 -43,571 -43,566 -43,571 Pseudo R2 0.18797 0.19083 0.18729 0.18739 0.18728 Nr of alternatives 28 28 28 28 28 Nr of cases 19,497 18,287 16,213 16,213 16,213 Nr of observations 520,015 494,605 442,755 442,755 442,755
In order to test the effect of tax rate volatility, we include as determinants of investment the standard deviations of tax rates (calculated for each country including the current and the two lagged observations of the respective tax rate – only variation across time was taken into account).14 We also introduce a dummy variable to capture the specific effect of changes in the tax rate in opposing directions (named “Change Direction EATR”).15
The volatility of EATR does not affect FDI, but the variability of EMTR and STR does.16 An increase of 0.02 in the standard deviation of EMTR reduces the odds ratio of the location probability by about 3%,17 and one change in the EMTR in the opposite direction to what it was previously reduces the odds ratio by 5.8% (Table 2, column 5). In turn, STR changing to a different direction is especially harmful, causing a fall in FDI of approximately 19.5%, but its standard deviation does not show statistical significance (Table 2, column 4).
Table 3: EATR Elasticity
(1) Beta of
EATR (2) Value of EATR
(3)=(1)*(2) EATR elasticity Test of equality to the median elasticity: Chi- squared (p-value) EATR 1 s.d. above average (0.29) –3.3889 0.2917 –0.9885 (0.000) 15.49 Median EATR (0.25) –3.3889 0.257 –0.8709 – EATR 1 s.d. below average (0.15) –3.7762 0.1557 –0.5879 (0.000) 18.07
Note: The year 2006 was used to compute the median, the average and the s.d. of the EATR.
14 Due to the use of lagged observations in the calculation of the standard deviation the regression with EATR embraces only the period 2000 to 2006, because data for the EATR are available only from 1998. But there are data for the STR from 1996, which permits the estimation of the equation with that variable for the period 1998 to 2006.
15 This dummy variable takes the value 1 if the tax rate experiences a decrease (larger than 0.5 pp.) after a period in which it remained constant or increased. The dummy also takes the value 1 if the tax rate undergoes an increase (larger than 0.5 pp.) after a period in which it remained constant or decreased.
16 Given the statistical nonsignificance of the standard deviations of EATR, we tested a different measure of the standard deviation that uses only current and past observations, but the nonsignificance of that variable remained.
17 An increase of 0.02 was chosen because it is close to the standard deviation of this variable, 0.025.
5.3. Euro area, European Union, and core/periphery
In the FDI literature some authors argue that EU or euro area membership facilitates the attraction of FDI. First, after the recent EU enlargement, new members witnessed gains in terms of FDI, which have been counterbalanced by losses in some earlier member states (Breuss 2001). Additionally, Petroulas (2007) suggests that countries that joined the EMU experienced an increase in inward FDI. This last result is in accordance with the theory of Optimum Currency Areas (OCA), which argues that the creation of a monetary union should lead to an increase in FDI, largely due to the elimination of exchange rate risk and the transaction costs associated with different currencies (Mundell 1961). We are interested in exploring whether the effect of taxes on FDI location is moderated by euro area or EU membership. Therefore, we evaluate whether countries within the EU or euro area are able to set higher taxes than those outside these areas without affecting FDI, as demonstrated theoretically by Baldwin and Krugman (2004).
To capture the importance of belonging to the euro area or the European Union we construct two dummy variables, which equal 1 if the country belongs to the group in question. We begin by introducing the euro area and EU dummies individually, and then add the interaction term of that variable to the EATR to assess the impact of EU and euro area on tax policy. There are two distinct specifications, one for the euro area and one for the EU. While the individual effect of the dummy captures the direct effect of the economic area on FDI, we are particularly interested in the interaction effect, which indicates whether the economic area is important in moderating the effect of taxes.
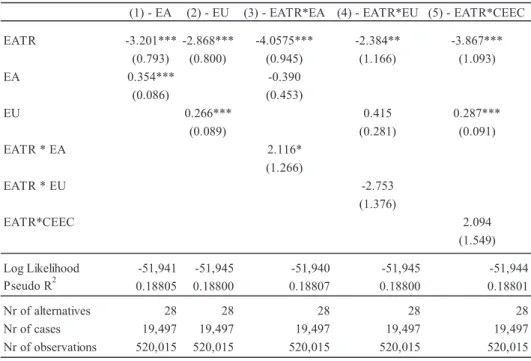
Table 4: Taxes and economic integration
Note: the coefficients of the control variables, which are the same as used in Table 1, the constants
for each country, and a country-specific time trend are not reported to save space. Robust standard errors in parentheses. In (3) to (5) the cases for 1998 and 1999 were lost. ***, **, and * indicate significance at 1%, 5%, and 10%, respectively.
The direct effect of economic integration is shown in Table 4, columns 1 and 2: both euro area and EU membership make countries more attractive for FDI. In addition, EU membership does not moderate the impact of taxes, while euro area membership has a visible impact at the 10% significance level: belonging to the euro area reduces the impact on the odds ratio of a 1 pp. increase in the EATR by approximately 2.1 pp. (Table 4, columns 3 and 4). Applying equation (1), the equivalent marginal effect for a current location probability of 3.5% drops from 0.1367 to 0.0655.
The irrelevance of the EU membership when interacting with tax rates is understandable because almost all countries that do not belong to the EU, if not all, have trade agreements either with the Union itself or with most of its countries. This eliminates the most obvious advantage of being part of the EU, the free movement of goods and services. Moreover, although the EU
(1) - EA (2) - EU (3) - EATR*EA (4) - EATR*EU (5) - EATR*CEEC
EATR -3.201*** -2.868*** -4.0575*** -2.384** -3.867*** (0.793) (0.800) (0.945) (1.166) (1.093) EA 0.354*** -0.390 (0.086) (0.453) EU 0.266*** 0.415 0.287*** (0.089) (0.281) (0.091) EATR * EA 2.116* (1.266) EATR * EU -2.753 (1.376) EATR*CEEC 2.094 (1.549) Log Likelihood -51,941 -51,945 -51,940 -51,945 -51,944 Pseudo R2 0.18805 0.18800 0.18807 0.18800 0.18801 Nr of alternatives 28 28 28 28 28 Nr of cases 19,497 19,497 19,497 19,497 19,497 Nr of observations 520,015 520,015 520,015 520,015 520,015
enlargement brought benefits for the new members, it caused losses in some earlier member states (Breuss 2001).
With respect to the euro area, the results suggest that investors do in fact see the elimination of currency risk as an advantage, probably because many of them intend to serve more than one euro area country. Another advantage of a strong currency like the euro is that it allows foreign investors to repatriate profits with a substantial exchange rate gain.
Breuss (2001) suggests that the new EU member countries have been the main winners in terms of FDI. They had large benefits from EU accession and from the transition process involving structural reforms (Penev and Rojec 2014). Therefore, it is possible that the EU has more impact on the corporate tax policy of those countries. To investigate this, we perform a regression like that in column 2, Table 4, but now the interaction term is with a dummy identifying the eight CEEC countries that joined the EU in 2004.18 The interaction between variables is not found to be statistically significant.19
More generally, CEEC countries have specific characteristics: they are net importers of capital and are in the process of transitioning to a market economy, with implications for macroeconomic stability, economic growth, and privatisations (Bellak et al. 2007). Thus, corporate tax rates may have a different effect for these countries. We assess this by creating a dummy variable called “CEEC” for all CEE countries including those that did not join the EU in 2004 (10 countries in total) for the entire period 1998–2006. The interaction of this dummy with the EATR was not statistically significant (Table 4, column 5), confirming the idea that CEE countries do not present significant specificities regarding the effect of taxes on FDI.
5.4. Impact of project characteristics and sector
In the following subsections we analyse how the response of FDI to taxes depends on project-specific characteristics: whether it is a new investment or an expansion, the sector, technological level, and capital intensity.
18 The dummy takes value 1 for those countries from 2004 onwards only. 19 Result available upon request.
Expansions vs. New investments
It can be argued that new investments and expansions react differently to variations in corporate tax rates. As seen above, Swenson (2001) concludes that FDI in new plants reacts more to taxes than FDI in plant expansions. However, this result has not been corroborated by other research. Devereux and Griffith (1998) find that when the sample is restricted to new entrants to Europe, the effective tax rate does not significantly affect FDI. Hartman (1984) and Young (1988) suggest that taxes negatively affect investments based on retained earnings but do not affect FDI based on new transfers. If we accept that new investments are mainly financed through new transfers while expansions are essentially financed by retained earnings, the evidence shows that new investments are less sensitive to taxes.
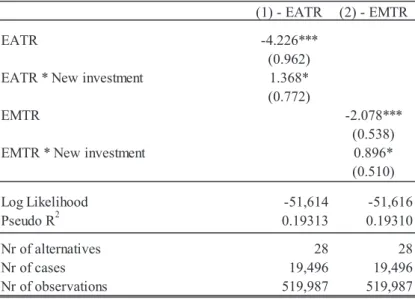
In order to clarify whether expansions or new investments are more sensitive to taxes, column 1 of Table 5 shows a specification of our model in which there is an interaction between EATR and a dummy variable (called “New Investment”) that equals 1 when the project is a new investment and zero if it is an expansion or a new co-location.20 The result suggests that at a significance level of 10%, new investments are less sensitive to the EATR than expansions: the EATR semi-elasticity is smaller by 1.36 pp. A similar result occurs for the EMTR (Column 2 of Table 5). The latter result should be understood in light of the fact that EMTR should be more important for marginal investments such as expansions.
In general, our results seem to confirm the findings of Devereux and Griffith (1998), Hartman (1984), and Young (1988). Moreover, Rolfe et al. (1993) use a survey of US business managers to show that new projects are more sensitive to tax incentives that reduce their initial expenses (equipment and material exemption), whereas expanding firms prefer tax incentives that increase after-tax profits. Taking this into account, the fact that both the EATR and the EMTR capture how a country taxes profit more than the tax incentives given to initial investment justifies our result.
20 We decided to consider the new co-location projects together with expansions because a new co-location project consists of a new activity that is co-located at or near an existing activity.
Table 5: Expansions vs. new investments
Note: the coefficients of the control variables, which are the same as used in Table 1, the constants
for each country, and a country-specific time trend are not reported to save space. Both specifications include the dummy for the type of investment (New investment) as a country-specific variable, not reported to save space. Robust standard errors (in parentheses). ***, **, and * indicate significance at 1%, 5%, and 10%, respectively. Project type data are missing for 1 case implying the loss of 1 additional case and 28 additional observations.
Industrial functions vs. services
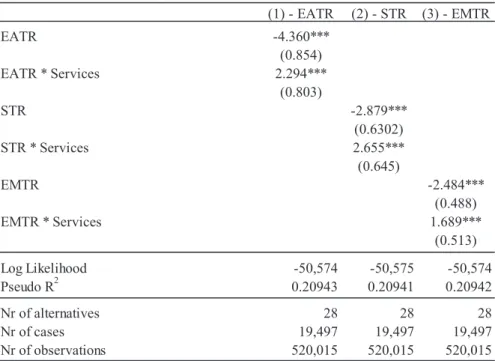
The literature reviewed above suggests that the influence of tax rates on FDI location decisions may vary by sector. In order to investigate these differences we create a specification of our model in which a dummy variable called “Services”, which equals 1 for services and zero for industrial functions, is interacted with each of the three tax measures.21 Two results are worth mentioning (Table 6).
Firstly, in line with Stowhase (2002), of all the tax measures the EATR has the greatest effect on industrial FDI. This suggests that as industrial investments involve higher tax-deductible expenses such as depreciations, they react to EATR more than to other tax measures.
21 Industrial functions include logistics, manufacturing, testing, and servicing; whereas services include contact centres, education and training, headquarters, internet data centres, research and development, sales and marketing, and shared services centres.
(1) - EATR (2) - EMTR
EATR -4.226***
(0.962) EATR * New investment 1.368* (0.772)
EMTR -2.078***
(0.538)
EMTR * New investment 0.896*
(0.510) Log Likelihood -51,614 -51,616 Pseudo R2 0.19313 0.19310 Nr of alternatives 28 28 Nr of cases 19,496 19,496 Nr of observations 519,987 519,987
Table 6: Industrial functions vs. services
Note: the coefficients of the control variables, which are the same as used in Table 1, the constants
for each country, and a country-specific time trend are not reported to save space. Both specifications include the dummy for services projects (Services) as a country-specific variable, not reported to save space. Robust standard errors in parentheses. ***, **, and * indicate significance at 1%, 5%, and 10%, respectively.
Secondly, services are less sensitive to all three taxes. The EATR semi-elasticity for services is 2.29 pp. smaller than for industry. While it was expected that EATR and EMTR would have a smaller effect on services than on industry, the reverse was expected for the STR. In fact, the literature concerning profit-shifting activities suggests that investment in services may be especially attracted by low statutory tax rates (Devereux 1992, Stowhase 2002).
These results indicate that industrial functions are more sensitive to corporate taxation than services, regardless of the tax measure used. The reason for this may be the greater mobility of industrial companies, making them more likely to compare taxes across locations (Wells 1986). In addition, some industrial companies operate with smaller margins than services companies, so taxes can affect the former's profits more severely than the latter's (Morisset and Pirnia
(1) - EATR (2) - STR (3) - EMTR EATR -4.360*** (0.854) EATR * Services 2.294*** (0.803) STR -2.879*** (0.6302) STR * Services 2.655*** (0.645) EMTR -2.484*** (0.488) EMTR * Services 1.689*** (0.513) Log Likelihood -50,574 -50,575 -50,574 Pseudo R2 0.20943 0.20941 0.20942 Nr of alternatives 28 28 28 Nr of cases 19,497 19,497 19,497 Nr of observations 520,015 520,015 520,015
1999). Finally, much FDI in the services sector is aimed at accessing a country’s market, so it is less sensitive to the tax rate.
High-tech manufacturing industries
High-tech manufacturing industries may react differently to taxes than other manufacturing industries. To our knowledge, this issue remains relatively unexplored in the literature, but there are some studies on FDI in high-tech firms in general. For instance, Liu et al. (2014) argue that high-tech manufacturing firms are more affected by government R&D expenditure and telecommunications infrastructure than low-tech firms, and confirm for China that telecommunications infrastructure attracts high-tech manufacturing companies. Lee and Hwang (2014) study inward FDI in Korea and detect significant differences in the location patterns of high- and low-tech industries. Notably, high-tech industries are more sensitive to labour force quality and less to labour cost. Finally, Lin (2010) concludes that network linkages are a key determinant of FDI in China by Taiwanese IT industry firms.
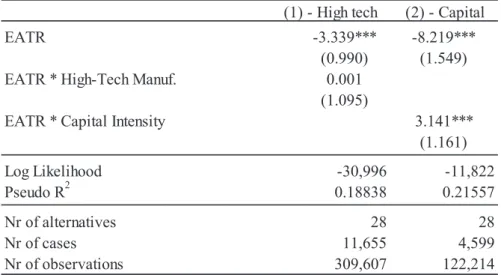
Table 7: High-tech manufacturing industries and capital intensity
Note: the coefficients of the control variables, which are the same as used in Table 1, the constants
for each country, and a country-specific time trend are not reported to save space. Model 1 includes the dummy for high-tech manufacturing as a country-specific variable, and model (2) the dummy for capital intensity, not reported to save space. In (1) only manufacturing projects were included, and in (2) only projects with data for both capital and employment were included. Robust standard errors in parentheses. ***, **, and * indicate significance at 1%, 5%, and 10%, respectively.
(1) - High tech (2) - Capital
EATR -3.339*** -8.219***
(0.990) (1.549)
EATR * High-Tech Manuf. 0.001
(1.095)
EATR * Capital Intensity 3.141***
(1.161) Log Likelihood -30,996 -11,822 Pseudo R2 0.18838 0.21557 Nr of alternatives 28 28 Nr of cases 11,655 4,599 Nr of observations 309,607 122,214
Our hypothesis is that high-tech industries are less sensitive to the tax burden. Firstly, this type of investment involves a larger amount of R&D, which tends to generate limited or even negative cash flows, at least in the first years, and consequently absence of taxable profit. Additionally, Lundvall and Christensen (2004:15) mention that low taxes do not stimulate innovation (and thus new investment), but only increase the survival of already existing firms that have a low probability of surviving. Contradicting our hypothesis, Grubert (2003) argues that R&D-intensive subsidiaries are located in countries with either very high or very low statutory tax rates, as they can easily move income across borders, notably through transactions between firms.
To perform this analysis, for the 12,587 manufacturing projects we created a dummy variable (called “High-Tech Manuf.”) that equals 1 if the project is for a high-tech manufacturing industry, and zero otherwise. The high-tech manufacturing industries are defined using the Eurostat and OECD classifications and include the following sectors: pharmaceuticals, computers, office machinery, electronics/communications, and scientific instruments. The results do not confirm our hypothesis, as high-tech projects have the same sensitivity to taxes as other projects (Table 7, column 1).
Capital intensity
The last issue concerning project characteristics is the level of capital intensity. Column 2 of Table 7 shows the results for a specification that interacts the EATR with a variable (called “Capital Intensity”) that measures the capital intensity of the project (capital invested in millions of US dollars per job created). The number of observations is reduced considerably as information on invested capital and jobs created is only available for 4,962 investment projects. The coefficient for the interaction term of EATR and capital intensity is positive and statistically significant, indicating that more capital-intensive projects are less sensitive to taxes. If the investment per job is very small, the EATR semi-elasticity is around –8.21%, and for each million US dollars per job created the EATR semi-elasticity falls in absolute terms by 3.14 pp. This finding may be justified by the fact that more capital-intensive projects induce greater depreciation costs, reducing the taxable profits and consequently the sensitivity to taxes. Firms that are more capital-intensive may also enjoy greater market power due to the barrier to entry created by large amounts of capital, and thus they will have wider margins and be less sensitive to tax rates. Finally, as Overesch and Wamser (2008) conclude that more immobile activities react less
to taxes, the above result may be driven by the fact that more capital-intensive firms are less mobile.
6. CONCLUSION
This paper investigates the role of corporate taxes in FDI location decisions, making use of a wide project-level dataset that enables an accurate representation of real investment decisions. We started by analysing the impact on FDI of the level and volatility of three measures of corporate taxation. We then analysed how economic and monetary integration determines the effect of taxes on FDI. Finally, we focused on how the tax impact depends on specific project characteristics.
We found that, of the three tax rates used, the effective average tax rate (EATR) has the largest impact on FDI. The main result indicates that a decrease in the EATR of 1 pp. increases the odds ratio of a country receiving a FDI project by about 3.1%. In addition to the tax rate level we found some evidence that the volatility of corporate tax rates (namely of the EMTR and STR) negatively affects FDI.
Regarding the impact of economic and monetary integration, we found that countries within the euro area can set higher taxes than other countries without an adverse effect on FDI. As a result, euro area countries are under less pressure to reduce corporate taxes to attract FDI.
Concerning project characteristics, the results indicate that the effective marginal tax rate (EMTR) is especially important for expansion projects, as suggested in the literature. Additionally, the EATR proves to be the tax measure with the greatest negative impact on industrial functions. On the other hand, we find that services are less sensitive to the statutory tax rate (STR) than industrial functions, contradicting Stowhase’s (2002) findings. Indeed, services are less sensitive than industry to all three tax measures. Our results also indicate that capital-intensive projects are less affected by corporate taxes, but that high-tech manufacturing projects react to taxes just like other manufacturing projects. The interactions between taxes and the level of both technology and capital intensity may require further analysis because they are not very well explored in the literature. As for tax rate volatility, more data on tax code changes is
required for a deeper analysis. The role of special non-tax incentives in FDI should also be explored in future research.
In summary, the results presented in this paper suggest that carefully setting lower and stable corporate taxes is instrumental to a country's ability to attract FDI, especially if the country already has a high tax rate. This study indicates that corporate taxation could even be used to attract specific types of foreign investment. Tax cuts are especially important when a country wants foreign firms already in situ to expand their activities or wants to attract industrial firms. Besides being important for policymakers these results may be of use to multinational companies, as they relate to their practice.
REFERENCES
Auerbach, A. J. & Hasset, K. (1993). Taxation and foreign direct investment in the United States: a reconsideration of the evidence. In A. Giovannini, R. G. Hubbard, and J. Slemrod (Eds.), Studies
in International Taxation (pp. 119-148). Chicago: University of Chicago Press.
Baldwin, R. & Krugman, P. (2004). Agglomeration, integration and tax harmonisation. European
Economic Review, 48 (1), pp. 1–23. DOI: 10.1016/S0014-2921(02)00318-5
Barrios, S., Huizinga, H., Laeven, L. & Nicodème, G. (2012). International taxation and multinational firm location decisions. Journal of Public Economics, 96 (11-12), pp. 946–958. DOI: 10.1016/j.jpubeco.2012.06.004
Bartik, T. J. (1985). Business location decisions in the United States: Estimates of the effects of unionization taxes, and other characteristics of states. Journal of Business & Economic Statistics, 3 (1), pp. 14– 22. DOI: 10.2307/1391685
Bellak, C., Leibrecht, M. & Romisch, R. (2007). On the appropriate measure of tax burden on Foreign Direct Investment to the CEECs. Applied Economics Letters, 14 (8), pp. 603–6. DOI: 10.1080/13504850500474202
Bellak, C. & Leibrecht, M. (2009). Do low corporate income tax rates attract FDI? Evidence from Central- and East European countries. Applied Economics, 41, pp. 2691–2703. DOI: 10.2139/ ssrn.869374
Bellos, S. & Subasat, T. (2012). Governance and foreign direct investment: A panel gravity model approach. International Review of Applied Economics, 26 (3), pp. 303-328. DOI: 10.1080/02692171.2011.587110
Bénassy-Quéré, A., Fontagné, L. & Lahrèche-Révil, A. (2005). How does FDI React to Corporate Taxation? International Tax and Public Policy, 12 (5), pp. 583–603.
Borensztein, E., Gregorio, J. De & Lee, J.-L. (1998). How does foreign direct investment affect economic growth? Journal of International Economics, 45 (1), pp. 115–135. DOI: 10.1016/S0022-1996(97)00033-0
Buettner, T. & Ruf, M. (2007). Tax incentives and the location of FDI: evidence from a panel of German multinationals. International Tax and Public Finance, 14 (2), pp. 151–164. DOI: 10.1007/ s10797-006-8721-5.
Breuss, F. (2001). Macroeconomic Effects of EU Enlargement for Old and New Members. (WIFO Working papers No. 143), WIFO.
Cameron, A.C. & Trivedi, P.K. (2009). Microeconometrics: Methods and Applications. New York: Cambridge University Press.
de Mooij, R.A. & Ederveen, S. (2003). Taxation and foreign direct investment: A synthesis of empirical research. International Tax and Public Finance, 10 (6), pp. 673–693. DOI: 10.1023/A:1026329920854
Devereux, M.P. (1992). The Ruding Committee Report: An Economic Assessment. Fiscal Studies, 13 (2), pp. 96–107. DOI: 10.1111/j.1475-5890.1992.tb00177.x
Devereux, M.P. & Griffith, R. (1998). Taxes and the location of production: evidence from a panel of US multinationals. Journal of Public Economics, 68 (3), pp. 335–367. DOI: 10.1016/S0047-2727(98)00014-0
Devereux, M.P. & Griffith, R. (2002). The Impact of Corporate Taxation on the Location of Capital: A Review. Swedish Economic Policy Review, 9 (1), pp. 79–102.
Devereux, M.P. & Griffith, R. (2003). Evaluating Tax Policy for Location Decisions. International
Tax and Public Finance, 10 (2), pp. 107–126. DOI: 10.1023/A:1023364421914
Devereux, M.P., Lockwood, B., & Redoano, M. (2008). Do countries compete over corporate tax rates? Journal of Public Economics, 92 (5–6), pp. 1210–1235. DOI: 10.1016/j.jpubeco.2007.09.005 Dunning, J. (1980). Towards an eclectic theory of international production: some empirical tests.
Journal of International Business Studies, 11 (1), pp. 9–31. DOI: 10.1057/palgrave.jibs.8490593
Edmiston, K, Mudd, S. & Valev, N. (2005). Tax Structures and FDI: The deterrent Effects of Complexity and Uncertainty. Fiscal Studies, 24 (3), pp. 341-359. DOI: 10.1111/j.1475-5890.2003. tb00087.x
Ernst & Young (2011). Restart: European attractiveness survey. Ernst & Young.
European Commission (2001). Company taxation in the internal market. (Commission staff working paper No. 582 final), Luxembourg : European Commission.
Feld, L. P. & Heckemeyer, J. H. (2011). FDI and Taxation: A meta-study. Journal of Economic
Surveys, 25 (2), pp. 233–272. DOI: 10.1111/j.1467-6419.2010.00674.x
Grubert, H. & Mutti, J. (1991). Taxes, Tariffs and Transfer Pricing in Multinational Corporate Decision-Making. Review of Economics and Statistics, 73 (2), pp. 285–293. DOI: 10.2307/2109519 Grubert, H. (2003). Intangible income, intercompany transactions, income shifting, and the choice of location. National Tax Journal, 56 (1) Part 2, pp. 221–242. DOI: 0.17310/ntj.2003.1S.05 Hartman, D. G. (1984). Tax policy and foreign direct investment in the United States. National
Tax Journal, 37 (4), pp. 475-488.
Haufler, A. & Schjelderup, G. (1999). Corporate Taxation, Profit Shifting, and the Efficiency of Public Input Provision. FinazArchiv / Public Finance Analysis, 56 (3/4), pp. 481–499.
Haufler, A. & Schjelderup, G. (2000). Corporate tax systems and cross-country profit shifting.
Oxford Economic Papers, 52 (2), pp. 306–325. DOI: 10.1093/oep/52.2.306
Hausman, J. & McFadden, D. (1984). Specification Tests for the Multinomial Logit Model.
Econometrica, 52 (5), pp. 1219–1240. DOI: 10.2307/1910997
Head, K., Ries, J. & Swenson, D. (1999). Attracting Foreign Manufacturing: Investment Promotion and Agglomeration. Regional Science and Urban Economics, 29, pp. 197–218. DOI: 10.1016/S0166-0462(98)00029-5
Hines, J.R. Jr. (1996). Altered States: Taxes and the Location of Foreign Direct Investment in America. American Economic Review, 86 (5), pp. 1076–1094.
Hines, J.R. Jr. (1999). Lessons from behavioural response to international taxation. National Tax
Journal, 52 (2), pp. 305-322.
Hines, J.R. Jr. & Rice, E.M. (1994). Fiscal Paradise: Foreign Tax Havens and American Business.
Quarterly Journal of Economics, 109 (1), pp. 149–182. DOI: 10.2307/2118431
Huizinga, H. & Laeven, L. (2008). International profit shifting within multinationals: A multi-country perspective. Journal of Public Economics, 92 (5–6), pp. 1164–1182. DOI: /10.1016/j. jpubeco.2007.11.002
Lee, K.-D. & Hwang, S.-J. (2014). Regional heterogeneity and location choice of FDI in Korea via agglomeration and linkage relationships. Journal of the Asia Pacific Economy, 19 (3), pp. 464–487. DOI: 10.1080/13547860.2014.908535
Lin, F.-J. (2010). The determinants of foreign direct investment in China: The case of Taiwanese firms in the IT industry. Journal of Business Research, 63 (5), pp. 479–485. DOI: 10.1016/j. jbusres.2009.04.005
Lundvall, B.-A. & Christensen, J. L. (2004). Introduction: product innovation – on why and how it matters for firms and the economy. In J. L. Christensen and B.-A. Lundvall (Eds.), Product
innovation, interactive learning and economic performance (pp. 1-18). Oxford: JAI Press.
Liu, K., Daly, K. & Varua, M. E. (2014). Analysing China’s foreign direct investment in manufacturing from a high-low technology perspective. Emerging Markets Review, 21, pp. 82–95. DOI: 10.1016/j.ememar.2014.08.003
McFadden, D. (1974). Conditional logit analysis of qualitative choice behaviour. In P. Zarembka (Ed.), Frontiers in Econometrics (pp. 105–142), New York: Academic Press.
Morisset, J. & Pirnia, N. (1999). How tax policy incentives affect foreign direct investment: A Review. (World Bank Policy Research WP), Washington, DC: World Bank. DOI: 10.1596/1813-9450-2509 Mundell, R. (1961). A Theory of Optimum Currency Areas. American Economic Review, 51 (4), pp. 657–665.
Overesch, M. & Rincke, J. (2008). The Dynamics of Corporate Tax Setting in Europe, 1984–2006. CESifo Venice Summer Institute 2008, 16-17 July, Venice.
Overesch, M. & Wamser, G. (2009). Who cares about corporate taxation? Asymmetric tax effects on outbound FDI. The World Economy, 32 (12), pp. 1657–1684. DOI: 10.1111/j.1467-9701.2009.01174.x Papke, L. (1991). Interstate business tax differentials and new firm location: evidence from panel data. Journal of Public Economics, 45 (1), pp. 47–68. DOI: 10.1016/0047-2727(91)90047-6
Penev, S. & Rojec, M. (2014). The future of FDI in South Eastern European Countries: Messages from new EU member states. Economic Annals, LIX No. 202, pp. 43-67. DOI: 10.2298/EKA1402043P Petroulas, P. (2007). The effect of the euro on foreign direct investment. European Economic
Review, 51(6), pp. 1468–1491. DOI: 0.1016/j.euroecorev.2006.10.005
Phillips, J. M. & Goss, E. P. (1995). The effect of state and local taxes on economic development: A meta-analysis. Southern Economic Journal, 62 (2), pp. 320–333. DOI: 10.2307/1060685
Rolfe R.J., Ricks, D.A., Pointer, M.M. & McCarthy, M. (1993). Determinants of FDI Incentive Preferences of MNEs. Journal of International Business Studies, 24 (2), pp. 335–355. DOI: 10.1057/ palgrave.jibs.8490235
Slemrod, J. (1990). Tax Effects on Foreign Direct Investment in the United States: Evidence from a Cross-Country Comparison. In A. Razin and J. Slemrod (Eds.), Taxation in the Global Economy (pp. 79–122), Chicago, IL: University of Chicago Press.
Stowhase, S. (2002). Profit Shifting Opportunities, Multinationals, and the Determinants of FDI. (Discussion Papers in Economics 2002-11), Munich: University of Munich.
Stowhase, S. (2006). Tax Rate Differentials and Sector Specific Foreign Direct Investment: Empirical Evidence from the EU. FinanzArchiv/Public Finance Analysis, 61 (4), pp. 535–558. DOI: 10.1628/001522105776072807
Swenson, D.L. (2001). Transaction type and the effect of taxes on the distribution of foreign direct investment in the United States. In J.R. Hines (Eds.), International Taxation and Multinational
Activity (pp. 89-112), Chicago, IL: University of Chicago Press.
Wells L. (1986). Investment Incentives: An Unnecessary Debate. CTC Reporter, 22 Autumn, pp. 58-60.
Young, K. H. (1988), The effects of taxes and rates of return on foreign direct investment in the United States. National Tax Journal, 41 (1), pp. 109–121.
Received: March 24, 2016 Accepted: June 29, 2018