Repositório ISCTE-IUL
Deposited in Repositório ISCTE-IUL:
2019-03-26
Deposited version:
Pre-print
Peer-review status of attached file:
Unreviewed
Citation for published item:
Félix, E. G. S., Pires, C. P. & Gulamhussen, M. A. (2013). The determinants of venture capital across Europe: evidence across countries. Journal of Financial Services Research. 44 (3), 259-279
Further information on publisher's website:
10.1007/s10693-012-0146-y
Publisher's copyright statement:
This is the peer reviewed version of the following article: Félix, E. G. S., Pires, C. P. & Gulamhussen, M. A. (2013). The determinants of venture capital across Europe: evidence across countries. Journal of Financial Services Research. 44 (3), 259-279, which has been published in final form at
https://dx.doi.org/10.1007/s10693-012-0146-y. This article may be used for non-commercial purposes in accordance with the Publisher's Terms and Conditions for self-archiving.
Use policy
Creative Commons CC BY 4.0
The full-text may be used and/or reproduced, and given to third parties in any format or medium, without prior permission or charge, for personal research or study, educational, or not-for-profit purposes provided that:
• a full bibliographic reference is made to the original source • a link is made to the metadata record in the Repository • the full-text is not changed in any way
The Determinants of Venture Capital in Europe - Evidence Across
Countries
Elisabete Gomes Santana Félix*, a, Mohamed Azzim Gulamhussen†, b, Cesaltina Pacheco Pires‡, a
a
CEFAGE and Management School, Évora University b
Business School, Finance and Accounting Department, ISCTE
Abstract
This article analyzes the determinants of the European venture capital market, extending the equilibrium model from Jeng and Wells (2000). Our empirical model includes many of the determinants already tested in previous studies. In addition, we test whether the unemployment rate, the trade sale divestment and the price/book ratio are important factors in explaining venture capital. We use aggregated data from the European venture capital market as well as macroeconomic data, to estimate panel data models, with fixed and random effects. The random effects models revealed to be the most adequate. Our results confirm the importance of some of the already known factors and show that the unemployment rate and trade sale divestments are important determinants in the European venture capital market.
Keywords: Venture capital; Europe; Venture capital determinants; IPO; Trade sale; Write-off; Unemployment rate.
JEL Classification: C23, G24, G32, G34, M13
1. Introduction
The venture capital companies have an important role to play in the economy. They exist to finance the new growing companies which possess high levels of risk. So they stimulate the growth and renewal of the countries economy (Gompers and Lerner, 2001).
The importance that this form of investment plays in the revitalization and reorganization of the enterprise tissue, in particular in the small and medium size companies, is the main reason that justifies its interest. The example of U.S.A. is paradigmatic: the venture capital market started in the 60’s financing companies which nowadays are considered references in the market, such as Microsoft, Apple, Intel or 3Com.
*
Assistant Professor of the Management School from Évora University, Researcher from CEFAGE-UE, PhD student in Management in the ISCTE on the specialization of Finances. E-mail: efelix@uevora.pt
†
Assistant Professor of the Finance and Accounting Department of ISCTE. E-mail: magn@iscte.pt ‡
All the contributions for a better understanding of this type of investments and, in particular, for understanding the optimal investment and divestment decision are important both in terms of research as well as for their contribution for the economic relationships between agents.
This study is a contribution to the characterization of the, still recent, European venture capital market. Starting from the existing literature in this area, we extend it so as to identify additional factors of the venture capital investment. We use panel data models - random and fixed effects - to find the impact of the various determinants on investment, considering the equilibrium condition of the European venture capital market. In our study we include many of the determinants traditionally cited in the literature. However we also analyze the impact that the unemployment rate, trade sale divestments and the price/book ratio, may have in the venture capital market. In addition, we will analyze in detail the early stage and high-tech investments so as to identify their distinctive features.
There has not been much work on the determinants of the venture capital investments. Clearly, more empirical applications are needed, especially for Europe where the venture capital market is still in its infancy. The published papers which are most related with our analysis, both in terms of model and data used, are the following ones: Gompers (1998), Gompers and Lerner (1998b), Hellmann (1998b), Jeng and Wells (2000), Marti and Balboa (2001), Romain and La Potteria (2004) and Mayer, Schoors and Yafeh (2005).
Gompers (1998) examines the movements in the U.S.A. venture capital market, for the period of 1969 to 1997. He examines the growth occurred in the new funds to venture capital investments and, on the other hand, examines which was the impact of this growth in the venture capital market participants. The author concludes that the increase in the available funds for venture capital investments was a result of two facts: the increased return verified in the venture capital markets due to the existence of a sufficiently favourable IPO market, making it possible to place in the stock market companies financed with venture capital; and the reduction on the tax on capital profits that boosted those results.
As Gompers recognizes, his conclusions are consistent with the ones obtained by Black and Gilson (1998), who study the relationship between the venture capital market and a strong capital market. The existence of a strong IPO market, which allows fast exits and with good results, stimulates the venture capital market by the demand and supply side.
Gompers and Lerner (1998b) study whether macroeconomic factors, of regularization or performance, influence the available funds in the venture capital market. This empirical study uses only U.S.A data (both at national and state level and data for the venture capital companies), for the period from 1969 to 1994. They verify that shifts in the demand for venture capital have a positive impact on new funds for venture capital investments. They confirm that the reduction on the profits tax has a positive impact on demand for venture capital. They also observe that available funds for venture capital investments, both in aggregate terms and at the state level, are positively affected by: reductions in the restrictions to the pension funds and by academic or industrial R&D expenditures. Finally, they verify that the good performance of the venture capital investment funds leads to a bigger availability of capitals.
The previous work was analyzed and criticized by Hellmann (1998b). The author defends that the venture capital is extremely important in the countries competitiveness, particularly in the case of the U.S.A, and argues that the lack of venture capital is essentially due to the lack of entrepreneurs. According to the author we still do not know the entrepreneurship process and thus there does not exist a correct form of measuring the entrepreneurship level. One of is recommendations is that instead of using the variables in absolute terms they should be used as fractions of the GDP or of the saving level. In our study we follow this recommendation as other authors have already done it. By doing this we obtain values which are normalized with respect to the different economic growth and different inflation rates. Finally, this author suggests that it would be interesting to verify the impact of the age of the venture capital company using an analysis with disaggregated data. He also suggests a deeper investigation of the early stage venture capital investments.
Jeng and Wells (2000) analyze the venture capital determinants for a sample of 21 countries from different continents, from 1986 to 1995. Such as Black and Gilson (1998) and Gompers (1998), among others, they conclude that the IPO divestments are one of the most important factors for the increase of available funds for venture capital investments. The private pension funds are important factors through time, but not between countries. Contrarily to what was expected, the GDP and the market capitalization were not significant factors in their analysis. The different government policies seem to have a strong impact, either because they establish the regulation phase, or because they have an important role in the stimulation of investment
These authors are among the first ones to question if the investment stage influences the impact of the analyzed determinants. Thus, when differentiating the analysis for the dependent variable early stage investments or late stage investments they found contrary effects in two factors: the labour market rigidity and the IPO divestments. Labour market rigidity affects early stage investments but not late stage ones, whereas the opposite holds for IPO divestments. Finally, they analyze whether government funded venture capital has the same sensitivity to the various factors, concluding that government investments are less sensitive to IPOs.
Marti and Balboa (2001) continue this line of investigation but they direct their analysis to countries where little information exists and where information is not equally distributed across agents (there exists asymmetric information), using data for 16 countries for the period from 1991 to 1999. They try to explain the venture capital market financing using variables directly related with the venture capital process instead of macroeconomics variables. The main objective was to show that the invested and divested amounts, in the case of developing venture capital markets, are key factors in the explanation of new funds for that market. They verify that the amounts invested in the previous years have a positive and significant impact in the funds for new venture capital investments. The divestment coefficient is negative, close to zero, and statistically significant. The work of these authors allows us to conclude that the new funds raised for the venture capital market are not related only with past performance, but also with the capacity of the funds managers in acceding and closing enough contracts.
Romain and La Potterie (2004) present a model for venture capital supply and demand, following closely the works of Jeng and Wells (2000) and Poterba (1989). They introduce, for the first time, a variable that intends to capture the entrepreneurship level (TEA). Since their measures of entrepreneurial activity and labour market rigidity are indices available only for one year, the authors introduce these two variables in interaction with other variables. They use data of 16 countries from different continents, for a cycle of 10 years (1990 to 2000). They conclude that the venture capital intensity is pro-cyclical, reacting significant and positively to the GDP growth. The short and long term interest rates have a positive impact in the venture capital intensity. According to these authors, this means that the interest rate has a larger impact on the venture capital demand (entrepreneurs) than on its supply. The indicators of technological opportunities (stock of knowledge and number of triadic patents) positively
reduces the impact of the GDP growth and of the stock of knowledge, where a minimum level of entrepreneurship is necessary to get a positive effect in the venture capital intensity of the available stock of knowledge.
More recently, Mayer, Schoors and Yafeh (2005) investigate questions related to funds for venture capital investments, using an approach quite different from the one described before. These authors try to confirm – through the comparison of investments activities and of financing sources of capitals in Germany, Israel, Japan and United Kingdom for the year 2000 – that the venture capital investments differ across countries depending on the phase where they are, the sector, their geographic scope and the sources of financing. The authors conclude that neither the financial systems nor the sources of financing are the main factors for the existing differences in the venture capital activities of the four countries.
The remainder of this paper is organized as follows: in Section 2 we discuss the factors which influence the venture capital. Section 3 describes our data set and the following section the methodology used. In Section 5 we present and discuss the results of our empirical model and Section 6 concludes.
2. Factors Affecting the Venture Capital
Since our work follows the venture capital determinants studies, it is interesting to have a notion of the factors which have been already analyzed. Table 1 presents the determinants included in the studies mentioned in the previous section. The determinants are divided in three groups: macroeconomic variables, entrepreneurial environment variables and technological opportunities variables.
Among the previously analyzed factors we will not include in our analysis the rigidity in the labour market, the level of private pension fund, the accounting reports presentation rules, the governments programs and the tax on capital profits. The main reason for not including these variables was the difficulty in gathering information for them. On the other hand, we decided to introduce three new potentials factors: the unemployment rate, the value of the price/book ratio, and the amount of trade sales divestment. In addition, we use the Total Entrepreneurial Activity Index, but in a different way of the authors who have worked for the first time with this index. As dependent variables we will introduce the high-tech investments value and the
early stage investments value. Our decisions were based on the literature review and on the suggestions of some of the authors.
Table 1 Factors analyzed for the reference authors in the area in analysis
Gompers and Lerner (1998)
Jeng and Wells (1998/2000)
Marti and Balboa (2001)
Romain and La Potterie (2004) Potencial Determinants USA industry
aggregated data
21 Countries, panel data and cross
section
16 Countries, panel data and
cross section 16 Countries, panel data Macroeconomics Conditions: GDP √ √ √ GDP growth rate √ √ √
Level of Interest Rate (1 Year) √ √
Level of Interest Rate (10 Years) √
Difference between the two interest rates √
Private Pension Funds √ √
Entrepreneurial Variables:
Capital Gains Tax Rate √ √ √
Labour Market Rigidities √ √
IPO √ √
SMC growth rate √
Capital markets returns √
Level of Entrepreneurship √ VC investment/GDP √ VC divestment/GDP √ IPO divestment/GDP √ WR divestment/GDP √ Fundraising trends √ Technological Opportunities:
Number of Triadic patents √
Business R&D growth √ √
Stock of Knowledge √ √
ERISA'S prudent man rule √
Let us now analyze each determinant of the venture capital market included in our study, briefly explaining the expected theoretical impact of the determinant and summarizing the previous results. This analysis will be helpful in interpreting our results and comparing them with previous studies.
2.1. GDP
If the economy is in an expansion phase it is natural that there exist more attractive opportunities for the entrepreneurs, thus leading to the emergence of more new companies.
There have been many authors who studied the impact of the economic conditions of a country in the venture capital activity. Acs and Audretsch (1994), when analyzing the effect of the macroeconomics fluctuations in the emergence of new start-ups, conclude that there exist a positive relationship between the two. Similarly, Gompers and Lerner (1998b) and Jeng and Wells (2000) tell us that macroeconomics expansions will lead to increases on the number of start-ups, which in turn leads to an increase of the venture capital demand.
Analyzing the venture capital supply side, the economic expansions are also related with periods of high profitability as a result from divestments of these businesses (Romain and La Potterie, 2004). Thus we expect a positive relationship between economics expansions and
the supply of funds for venture capital
We use the GDP annual growth rate to reflect the effect of macroeconomics fluctuations. Since GDP growth has a positive effect both on demand and supply of venture capital, we expect a positive relationship between macroeconomics expansions and venture capital
investments.
2.2. Market Capitalization Growth
Some authors (Romain and La Potterie, 2004 and Jeng and Wells, 2000) argue that the interpretation of this factor is very similar to the GDP growth. Although associated to the stock market, the market capitalization growth reflects the expectations of the investors about the economy. Consequently, one expects that an increase in the market capitalization creates a more favourable environment for the investors. Increases in market capitalization correspond
to increases on the available funds for venture capital investments. On the other hand, since
investors and entrepreneurs have good expectations about the economic evolution, one also expects that increases in market capitalization lead to increases in the demand for funds for
venture capital investments.
2.3. Research and Development Expenditures (R&D)
The R&D expenditures allow us to capture the effect of the high-tech companies. If the expenditures in R&D raise that means that the number of potential entrepreneurs with
promising ideas may increase (Gompers and Lerner, 1998b). Thus R&D expenditures have a positive impact on the demand of venture capital.
Moreover, since research activities are expensive and with high level of risk, the traditional financing sources are not adequate. In fact, venture capital is extremely important in financing these expenditures and in the creation of innovative companies. Gompers and Lerner (1998b) demonstrate that the research and development expenditures are associated to the venture capital activity. For them, the growth of available funds for venture capital investments in the 90’s, in U.S.A., was due to the increase of the technological opportunities.
Consequently, we expect a positive relationship between the R&D expenditures and the
demand and the supply of funds for venture capital investments.
2.4. Interest Rate
The level of interest rates may also have an impact on the venture capital investments. Among the papers mentioned in the Introduction, only Gompers and Lerner (1998b) and Romain and La Potterie (2004) considered the interest rate as a determinant in the venture capital market.
Gompers and Lerner (1998b) argue that the level of interest rates in the economy may affect the venture capital supply. Since investing in bonds is an alternative to venture capital investment, when the interest rate increases the attractiveness of the investment in venture capital funds diminishes. Consequently, for a given expected return of the venture capital investment, there will be a lower supply of funds. However, their results show a positive relationship between interest rate and venture capital investment. This lead the authors to conclude that both venture capital supply and venture capital demand are affected by variations in the interest rates, as both are affected by substitute offers of venture capital financing. Thus, their results capture the positive effect of the interest rates on the venture capital demand.
The previous effect may be due to the fact that the authors have used short term interest rates. If the short term interest rates increase, the attractiveness of the venture capital financing versus financing through financial institutions increases from the point of view of the entrepreneur (Romain and La Potterie, 2004).
Accordingly, we expect a positive relationship between the interest rates and the venture
capital demand and the contrary relationship between the interest rates and the venture capital supply. Thus, in an equilibrium model the effect of interest rates on the amount of
venture capital is a priori ambiguous, as it depends on which of the two effects (demand or supply) dominates.
2.5. Total Entrepreneurial Activity Index (TEA)
The entrepreneurship and the venture capital market are related. Gompers (1998) defends that the bigger is the entrepreneurial activity the bigger will be the amount of the existing venture capital in the market.
The Global Entrepreneurship Monitor (GEM) is dedicated to observe, analyze and do recommendations to the entrepreneurial activity of some countries, allowing international comparisons which were not possible until a few years ago. The GEM calculates an index, the Total Entrepreneurial Activity Index (TEA), that measures the entrepreneurial activity and that can be used for international comparisons. This index is a number that can vary between 1 and 20, which takes into account the amount of new entrepreneurs and new companies.
The TEA index was used previously by Romain and La Potterie (2004). However, these authors used the index only for one year, which would only allow a static analysis. To correct this problem the authors have used it together with the Business R&D Capital Stock. In our case, we collected information for this index since 1998 up to 2003, for the countries of our database. On the other hand, we did not get information for the Business R&D Capital Stock, as such we did not use the TEA index associated with any other factor. As Romain and La Potterie (2004), we expect a positive relationship between the level of TEA and the venture
capital investment.
2.6. Price/Book Ratio
One of the aspects that characterizes the relationship between the entrepreneur and the venture capital investor is the monitoring, performed by the capital investor, of the venture capital investment.
Gompers (1995) carries through a study on venture capital investments, information asymmetry and monitoring. The author uses the price/book ratio referring that higher ratios are associated to companies or industries that present strong growth opportunities. So, susceptible to the biggest agency costs, which increases the monitoring value of the venture capital investor. These types of companies are preferential financed with venture capital. Thus, it was expected that a positive relation existed between the price/book ratio and the amount of venture capital financing. This relationship was confirmed by the author.
Gompers (1996) analyzes the question of certification when there is asymmetry information between venture capital investors and the investors of the venture capital funds. The author refers that the venture capital investors need to demonstrate that they are capable of carrying through income-producing investments so that in the future they see assured the supply of capitals for eventual investments.
The works done by Cumming and MacIntosh (2001a, 2001c) are among the most important with respect to the venture capital partial exits analysis, with intention to do signalling as well as certification for the potential investors. These authors also used the price/book ratio as proxy and reached similar conclusions to the ones of Gompers.
So, we decided to consider this ratio in our analysis. We expect that the price/book ratio has a
positive effect on the available funds for venture capital investments.
2.7. Unemployment Rate
Following a suggestion by Marti and Balboa (2001) for macroeconomic factors that have still not been incorporated in the analysis of available funds for venture capital investments, we will test the effect of the unemployment rate.
The bigger is the number of unemployed people the higher will be the number of people who will have incentives to become entrepreneurs. This may happen either because they are in a situation of which they are trying to leave or because the government gives incentives to the creation of self-employment, through programs implemented by the Job and Professional Formation Institute, as in the Portuguese case.
We expect a positive relationship between the unemployment rate and the demand of venture
capital investment, but we expect the contrary effect between the unemployment rate and the supply of funds for venture capital. Consequently, in an equilibrium model the effect of the
unemployment rate on venture capital investment depends on which of the two effects dominates.
2.8. IPO, Trade Sales and Write-Offs
The link between the IPO market and the venture capital investments is one of the most studied subjects in this area. We already mentioned the importance of the IPO as a vehicle to exit venture capital investments. For the capital investors the IPO are important to get good returns as well as to certify their quality as managers of the venture capital fund.
Almost all the authors have used IPO as a variable representative of investments exits and able to explain the venture capital determinants. The exceptions are Marti and Balboa (2001), who focused only on factors directly implied in the venture capital process, who also used a variable to reflect the liquidation divestments, and Romain and La Potterie (2004).
The IPO is the form of venture capital investment exits most used in the U.S.A. and in the United Kingdom. This fact is associated with the existence of strong stock markets (Black and Gilson, 1998) and, on the other hand, for being the exit vehicle which allows greater returns (Barry et al, 1990; Megginson and Weiss, 1991; Gompers, 1995, 1996; Brav and Gompers, 1997; Gompers and Lerner, 1998a; Stuart et al, 1999; Gompers and Lerner, 1999b, 1999d).
In theoretical terms, we expect a positive relationship between the size of IPO’s market and the amount of funds available for venture capital as well as the demand for venture capital funds. However, one should notice that, among the previously mentioned authors, only Jeng
and Wells (2000) obtained a statistically significant positive effect. The remaining authors did not get a statistical significant effect.
In the particular case of our study, it does not make sense to analyze only the IPO as an exit form of venture capital investments. We use data on European countries where, except in the United Kingdom case, trade sales and write-offs are the exit forms that possess greater expression. So, it would not be appropriate to limit our analysis of the impact of the exit to the
IPO. On the contrary, it may well be that trade sales and write-offs are more relevant as determinants in the European venture capital market. Actually, the fact that some authors did not get a statistically significant coefficient for the IPO, may be due to the fact that the IPO are not the most usual form of exit in Europe, as acknowledge by Marti e Balboa (2001).
With respect to trade sales exits we expect to get a similar effect to the IPO variable. We
expect a positive relationship between trade sale exits and the demand and the supply of venture capital funds. On the other hand, for the variable that captures write-offs exits we expect the opposite effect.
3. The data
For the empirical analysis we use data on 23 countries: Austria; Belgium; Czech Republic; Denmark; Finland; France; Germany; Greece; Hungary; Iceland; Ireland; Italy; Netherlands; Norway; Poland; Portugal; Slovakia; Spain; Sweden; Switzerland; United Kingdom; Romania and Latvia. We work with panel data, for these 23 countries, from 1992 to 2003, which leads to a database of 276 observations for each variable.
Taking into account the factors we wanted to analyze it was necessary to use various sources of data. In the Portuguese venture capital market data case we used the Portuguese Venture Capital Association (APCRI) Yearbooks, and for the Europe data, the European Private Equity & Venture Capital Association (EVCA) Yearbooks. About this last source, the obtained data refers only to companies from countries which are EVCA’s members. At the time that we collected the data, there were about 950 associate’s members in the EVCA, which seems to constitute a sufficiently significant and representative number of the European venture capital market.
In the variables related with investments and divestments values of the venture capital market we follow the methodology used by Marti and Balboa (2001) and Roman and La Potterie (2004). These authors normalize the values of these variables for the respective GDP value (for year and country). As Marti and Balboa (2001) explain, this adjustment is necessary for two reasons. The first one is that the differences, between countries, in the economic level and the economic growth, might create a heterocedasticity effect. In fact, it is quite natural that the higher is the economic level the higher will be the observed variability. So, normalizing by
the GDP value we control this problem. On the other hand, if all variables were initially expressed in nominal values, then an observed increase, through time, in a variable could eventually correspond exclusively to an increase of the prices level. This would imply that the estimated parameters would be influenced by differences in the inflation rates across countries. By normalizing the variable with respect to GDP we are removing the inflation effect, because the GDP also incorporates the inflation effect of each country.
The annual GDP values for each country, the market capitalization, the research and development expenditures, the long term interest rates and the unemployment rates, were collected from the annual statistics by EuroStat, which we find reunited in the Database AMECO.
The Total Entrepreneurial Activity Index was collected from the Global Entrepreneurship Monitor (GEM), from 1998 to 2003. Finally, the price/book ratio (PB) was collected from the Bloomberg statistics. All data was converted in the Euro currency.
Table 2 presents the variables and their respective meanings.
Table 2 Variables Description
Variable Description
FundRaisGDP Annual total of new fundraising for venture capital investments, divided by GDP. TotalInvtVCGDP Annual venture capital total investment, divided by GDP.
InvtHighTechGDP Annual value of high-tech investments, divided by GDP. InvtEarStgGDP Annual value of early stage investments, divided by GDP.
GDPgrowth GDP annual growth rate.
RealInterestRate Annual long term real interest rate, real. UnemploymentRate Annual unemployment rate.
DesinvtIPOGDP Annual IPO total divestment, divided by GDP. SMCgrowth Stock market capitalization annual growth rate. TEA Total Entrepreneurial Activity Index annual value DesinvtTSalGDP Annual trade sale total divestment, divided by GDP.
DesinvtWrOffGDP Annual Write-Offs total divestment, divided by GDP. PB Price/Book Ratio annual value.
RDgrowth Research and development expenditures annual growth rate.
In tables 3 and 4 in the Annex we present the descriptive statistics and the correlations matrix, respectively.
4. Methodology
Given the nature of the data collected, we decided to work simultaneously with sectional and time observations. This allowed us: to increase the number of observations in analysis leading to more efficient estimators of the parameters; and analyze the venture capital investments phenomena, studying both sectional relationships (23 countries) and also time relationships (12 years) (Gulamhussen, 1995).
The basic structure for analysis of a mixing model can be translated by the following expression (Gulamhussen, 1995):
Where i = 1..., N relates to the entities (countries) for one same period of time and t = 1..., T, relates to the different time periods (years).
Regarding the option between fixed or random effect models, we decide to follow closely the methodology used by Jeng and Wells (2000). As these authors argue, when using random effect models we try to capture divergences of the different characteristics between the countries. When using fixed effect models we try to capture differences due to the alterations through time in the independent variable. Since we intend to contribute for a better understanding of the various forms of functioning and organization of the venture capital
( )
1 i t i t i t i t i tmarket in the different European countries, and see whether there has been a change in this market we choose to use both types of models.§
We will use a linear specification of the demand and supply of funds for venture capital. In our regression analysis we estimate the equilibrium coefficients. The same type of approach has been used by Gompers e Lerner (1998b), Jeng e Wells (2000) e Romain e La Potterie (2004).
The equation that describes the venture capital supply is the following one:
The equation that describes the venture capital demand is the following one:
To get the equilibrium equation we used the same approach then Jeng and Wells (2000); that is, we solve the supply equation with respect to the return variable and substitute it in the demand equation. Considering the equality between the quantity of funds supplied and demanded, we find the equilibrium amount of venture capital funds as a function of the explanatory variables:
§
Marti and Balboa (2001) use a very similar approach, however they end up using only the random effect models, after the
0 1 2 i t 3 i t
4 i t 5 i t 6 i t
7 i t 8 9 i t
10 i t
Re GDPgrowth RealInterestRate
DesinvtIPOGDP SMCgrowth TEA
DesinvtTSalGDP DesinvtWrOffGDP PB RDgrowth
it i t
i t
Venture capital Supply
α
α
turnα
α
α
α
α
α
α
α
α
= + + + + + + + + + + + + + 0 1 2 i t 3 i t 4 i t 5 i t 6 i t 7 i t 8 i t 9 10 i t Re GDPgrowth RealInterestRate DesinvtIPOGDP SMCgrowthTEA DesinvtTSalGDP DesinvtWrOffGDP
RDgrowth
i t i t
i t Venture capital Demand turn
UnemploymentRate β β β β β β β β β β β = + + + + + + + + + + + + + 0 1 i t 2 i t 3 i t 4 i t 5 i t 6 i t 7 i t 8 9 i t 10 i t GDPgrowth RealInterestRate
DesinvtIPOGDP SMCgrowth TEA
DesinvtTSalGDP DesinvtWrOffGDP PB
RDgrowth i t
i t
Venture capital Funds π π π π UnemploymentRate
π π π π π π π = + + + + + + + + + + + + +
( )
2( )
3( )
4The estimated model used panel data models with fixed and random effects.
5. Results
5.1. Comparison of Results with the Existing ones in Literature
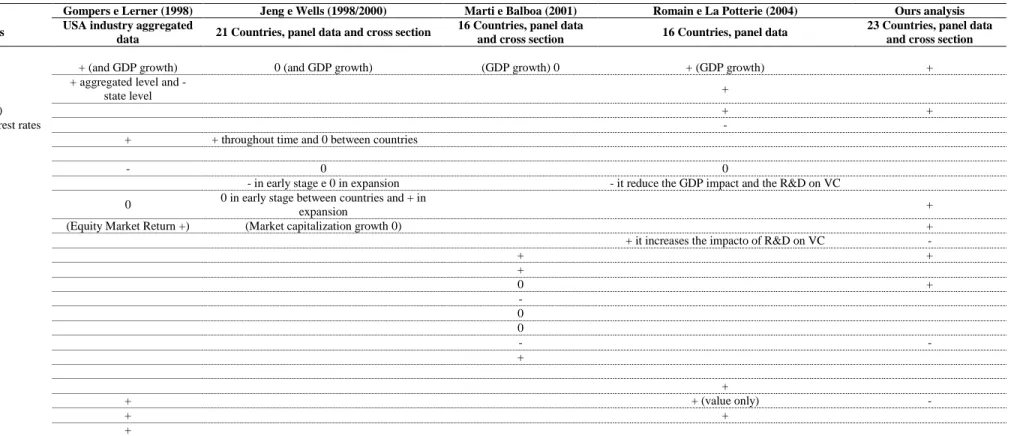
We started by replicating the analysis performed by the reference authors, applying their methodologies in our data set. Table 5 compares our results, in terms of signals of the coefficients, with these authors’ results.
Our analysis confirms the impacts reported in the literature with respect to the GDP growth, growth in capital market capitalization, real interest rate, disinvestment through IPO and total investment.
One should notice that we got a positive signal for the IPO divestments effect, a result which is theoretically expected, but which has only been observed by Jeng and Wells (2000). Thus our results reinforce the impact of this variable in explaining the expansion of venture capital investments.
The level of long term interest rates presents, in our analysis, a positive and statistically significant impact, confirming the results obtained by Romain and La Potterie (2004) and Gompers and Lerner (1998b).
The market capitalization growth shows a positive effect in our data set. As it can be seen in the table, Gompers and Lerner (1998b) obtained a positive impact and Jeng and Wells (2000) did not get a statistically significant coefficient for this variable. Our results confirm the expected theoretical result, and are consistent with the results presented by Black and Gilson (1998).
With respect to the growth in R&D expenditures, we got an effect contrary to the one theoretically expected and previously verified in the literature. We will analyse further this result in the next section.
5.2. Final Results
Let us now analyze the results of the estimation of our model. The results, for random effect and for fixed effect models, are presented in Tables 6 to 9 and 10 to 13, respectively.
Analyzing the results on the cited tables, for both types of models, one concludes that the macroeconomic and the entrepreneurial environment factors are the ones that influence the European venture capital market for the dependent variables under analysis. However, one should be cautious in interpreting this result, as we feel there are measurement problems in the technological variable which included in our study.
One aspect that should be highlighted is fact that the GDP growth rate is not statistically significant in most models, in contrast to what authors as Gompers and Lener (1998b) and Romain and La Potterie (2004) had concluded. However, the works of authors as Jeng and Wells (2000) and Marti and Balboa (2001) lead to conclusions similar to ours. One should notice, however, that the GDP growth rate coefficient is positive in all the estimated models. Moreover, when one considers the random effect models and the high-tech investment as dependent variable, the GDP growth rate coefficient is positive and statistically significant in several models.
With respect to the market capitalization growth we get a statistically significant positive impact in most random effects models. However, in some cases the effect is not economically relevant since the coefficient is extremely close to zero (as in the case where venture capital funds raised is used as dependent variable), and in the case of early stage investments the variable is not statistically significant. In the fixed effect models, the impact presents the expected signal but with no statistical significance. The fact that early stage investments are not affected by market capitalization growth, suggests that the existence of an active stock market does not lead, by itself, to the accomplishment of more early stage investments.
In the case of the R&D expenditures our results do not confirm the expected theoretical impact. The signal of the coefficient varies across regressions and it is not statistically significant. Thus our results are contrary to the ones obtained by Gompers and Lerner (1998b). The most likely explanation for our result is that our R&D variable does not measure correctly innovation. In fact, if we look at the work of Romain and La Potterie (2004), the
authors used two additional variables to capture the effect of the R&D expenditures, and these two additional variables were precisely the ones which showed a positive and statistically significant impact.
Relatively to the long term interest rate, we confirm its importance as a determinant for the European venture capital market, both in fixed or random effects models. However, its impact is not consistent as Gompers and Lerner (1998b) had already concluded for short term interest rates. In the models including only macroeconomic variables the interest rate has a negative impact on venture capital investment whereas in the remaining models the interest rate impact is positive. Since the former models are likely to be badly specified since important explanatory variables are excluded, the coefficient in these regressions might be biased. Thus, overall we can conclude that the demand side impact of the interest rate overwhelms the supply side effect.
The TEA index, which was used to measure the entrepreneurial activity in each country does not have statistical significance and the signal of the coefficient is not consistent across regressions. Thus we are unable to conclude that there exists a positive relationship between entrepreneurial level and the venture capital investments. Such as Hellmann (1998b) refers, we still do not know the way the entrepreneurship process occurs and it may well be that the TEA does not captures the entrepreneurial level. Moreover, the variable is relatively recent, so it is necessary to wait some time to be able to validate (or not) its effect in the venture capital investment.
Although we introduced the price/book ratio in our analysis in the expectation of a positive and significant effect, our results show that this explanatory variable does not have a significant influence on the dependent variables. An eventual justification for this result could be the fact that we use aggregate data (for the stock market) and not individual data of venture capital companies. Notice that this variable was introduced as proxy to characterize the effects of asymmetric information, monitoring and certification between venture capital investors and venture capital financiers and entrepreneurs. Therefore, our aggregated measure hardly captures such an individual effect. This leads us to conclude that the price/book should be measured at an individual level, as in Gompers (1995). This author used the price/book ratio of the companies who had received venture capital financing and, as such, this variable
The unemployment rate, variable which we introduced in this type of analysis, has a strong negative impact on the venture capital investments, especially in the random effects models. This effect suggests that there exists a relationship between the labour market of some European countries and the level of development of the respective venture capital market. This is consistent with Hellmann (1998b) argument that there exists a strong relationship between entrepreneurs and requirements for venture capital financing.
The negative effect of the unemployment rate on venture capital investment tells us that the increase in self-employment which may occur with higher unemployment is not sufficient to dominate the negative impact that the unemployment rate may have on the supply of venture capital funds. Another possible explanation for this result, which is particularly relevant when we compare the various countries, is that the unemployment rate may be positively correlated with labour market rigidities, as we expect to have higher long-term unemployment in countries with more rigid labour markets. As a consequence, the coefficients in our regressions might be capturing the effect of this excluded variable.
Finally, and with respect to the effect that the divestments forms may have on the amounts of venture capital financing and investment, we got the expected impacts for the various divestment forms. In the case of IPO divestments, we obtained a positive impact with identical significance levels to the ones previously mentioned in the literature. The IPO divestment remains one of the strongest determinants, for venture capital financings, or for venture capital investments.
The trade sale divestment, which is the divestment form with more expression in Europe, (Félix, 2005), has similar impact and significance levels to the IPO divestments, because it is the best option through which the European venture capital investors can exit the venture capital investment with good performances.
In the case of the write-offs divestments, although we did not get statistically significant coefficients, the sign of the impact was negative, which is what we expected. In fact, the write-offs are indicators of low rentability, thus it is natural that the market reacts in the direction of not stimulating the venture capital investments.
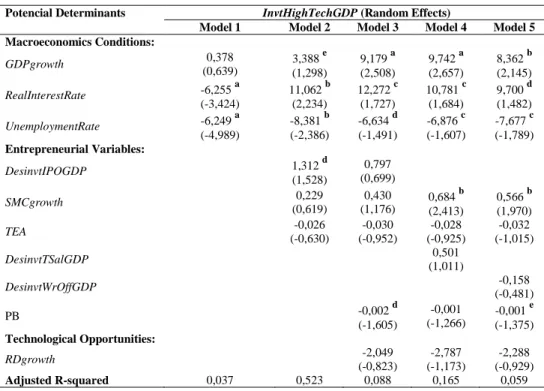
Let us now analyze the determinants of high-tech and early stage investments. In the case of high-tech investments the most important determinants are: the economic growth, the level of the long term interest rates, the level of unemployment rates and the market capitalizations growth. Taking into account the high level of risk of this type of investments, it is quite natural that the variables related to the expectations about the economy as well as the interest rate play such an important role.
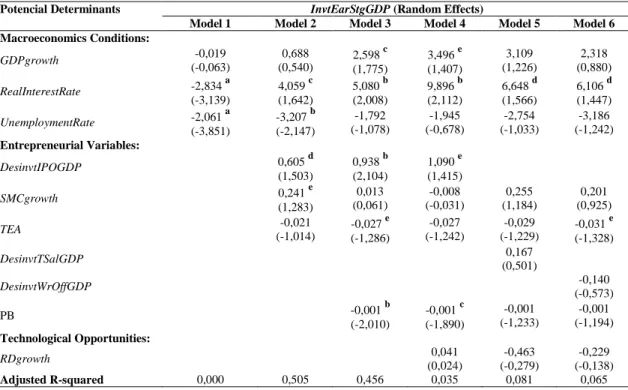
In the case of the early stage investments, we verify that the level of the long term interest rates, the level of unemployment rate, the IPO and the price-book ratio are its main determinants. Notice that, regarding the IPO divestments, our conclusion goes against Jeng and Wells (2000), who did not get a statistically significant impact of this variable on early stage investments. On the other hand, if the unemployment rate is in fact related with labour market rigidities, our result is consistent with their result since they concluded that labour market rigidities affect early stage investments.
6. Conclusions
This article analyzes the determinants of the European venture capital market using fixed effects and random effects models on a data set with 23 countries for the period from 1992 to 2003. Our empirical model includes many of the determinants already tested in previous studies. In addition, we test whether the unemployment rate, the trade sale divestment and the price/book ratio are important factors in explaining venture capital in Europe.
The random effects models seem to contribute for a better explanation then the fixed effects models which reveals that there exists substantial heterogeneity across the different venture capital markets considered in our analysis.
Of the ten determinants under analysis, we obtained confirmation for the interest rates, the unemployment rate, IPO divestments and for the trade sales divestments. Therefore our study shows that two of the new determinants we introduced are clearly relevant in the European venture capital markets: the unemployment rate and the trade sale divestments. On the other hand, the aggregated price/book ratio does not have a significant effect on the venture capital investment, leading us to conclude that this variable should only be used in analyses with
For the early stage and high-tech investments, we conclude that they are affected mostly by macroeconomics factors, with particular emphasis for the levels of the long term interest rates and for the levels of the unemployment rate.
7. Bibliographical References
Acs, Z.J. and D.B. Audretsch, 1994, New-firms startups, technology and macroeconomic fluctuations, Small Business Economics, 6.
APCRI, 2002. Anuário do Ano 2002.
Barry, C.B., C.J. Muscarella, J.W. Peavy and M.R. Vetsuypens, 1990, The role of venture capital in the creation of public companies, Journal of Financial Economics, 27 (2), pp. 447-471.
Black, B.S. and R.J. Gilson, 1998, Venture capital and the structure of capital markets: banks versus stock markets, Journal of Financial Economics, 47, pp. 243-277.
Brav, A. and P.A. Gompers, 1997, Myth or reality? The long-run underperformance of initial public offerings: evidence from venture and nonventure capital-backed companies, Journal of Finance, 52, pp. 1791-1821. Cumming, D.J. and J.G. Macintosh, 2001a, A cross-country comparison of full and partial venture capital exits
strategies, paper to the Australasian Banking and Finance Conference, Sydney December 2001.
Cumming, D.J. and J.G. Macintosh, 2001c, The extent of venture capital exits: evidence from Canada and the United States, Research Paper nº 01-03 of University of Toronto, Faculty of Law.
Félix, E., 2005, Caracterização do mercado de capital de risco na Europa, Revista Economia Global e Gestão, nº 3, vol. X, pp. 53-75.
Gompers, P.A. and J. Lerner, 1998a, Venture capital distributions: short and long-run reactions, Journal of Finance, 53, pp. 2161-2183.
Gompers, P.A. and J. Lerner, 1998b, What drives venture capital fundraising?, Working Paper, Harvard University, Cambridge, MA.
Gompers, P.A. and J. Lerner, 1999b. The Venture Capital Cycle (The MIT Press: Cambridge, MA).
Gompers, P.A. and J. Lerner, 1999d, Conflict of interest in the issuance of public securities: evidence from venture capital, Journal of Law & Economics, 42, pp. 1-28.
Gompers, P.A. and J. Lerner, 2001. The Money of Invention: How Venture Capital Creates New Wealth (Harvard Business School Press: Boston, MA).
Gompers, P.A., 1995, Optimal investment, monitoring, and the staging of venture capital, Journal of Finance, 50 (5), pp. 1461-1489.
Gompers, P.A., 1996, Grandstanding in the venture capital industry, Journal of Financial Economics, 42 (1), pp. 133-156.
Gompers, P.A., 1998, Venture capital growing pains: Should the market diet?, Journal of Banking & Finance, 22, pp. 1089-1104.
Gulamhussen, M.A., 1995. Investimento Directo Estrangeiro no Sector da Banca: O Caso dos Estados Unidos da América como País de Destino (Master Dissertation on Management, ISCTE).
Hellmann, T., 1998b, Discussion of What drives venture capital fundraising?, Brooking Papers on Economic Activity: Microeconomic, eds. M. Baily, P. Reiss and C. Wiston, 197-203.
Jeng, L.A. and P.C. Wells, 2000, The determinants of venture capital fundraising: Evidence across countries, Journal of Corporate Finance, 6, pp. 241-289.
Marti, J. and M. Balboa, 2001, Determinants of private equity in fundraising western Europe, Working paper. Mayer, C., K. Schoors and Y. Yafeh, 2005, Sources of funds and investment activities of venture capital funds:
evidence from Germany, Israel, Japan and the United Kingdom, Journal of Corporate Finance, 11, p. 586-608.
Megginson, W.L. and K.A. Weiss, 1991, Venture capitalist certification in initial public offerings, Journal of Finance, 46 (3), pp. 879-903.
Poterba, J.M, 1989, Venture capital and capital gains taxation, NBER working paper series, Working Paper nº 2832, NBER, Cambridge.
Romain, A. and B.V. P. de La Potterie, 2004, The determinants of venture capital: a panel data analysis of 16 OECD countries, Centre Emile Bernheim, Research Institute in Management Science, Working Paper nº 04/015, April.
Stuart, T.E., H. Hoang and R. Hybels, 1999, Interorganizational endorsements and the performance of entrepreneurial ventures, Administrative Science Quarterly, 44 (2), pp. 315-349.
8. Annexes
Table 3 Descriptive statistics
Average Standard
Deviation Minimum Maximum
FundRaisGDP 0,002 0,002 0,000 0,014 TotalInvtVCGDP 1,424 1,836 0,000 15,126 InvtHighTechGDP 0,504 0,753 0,000 7,522 InvtEarStgGDP 0,232 0,385 0,000 4,006 GDPgrowth 0,052 0,067 -0,433 0,249 RealInterestRate 0,037 0,023 -0,083 0,104 UnemploymentRate 0,083 0,043 0,012 0,198 DesinvtIPOGDP 0,094 0,156 0,000 0,861 SMCgrowth 0,157 0,297 -0,422 1,875 TEA 6,683 2,479 0,470 12,200 DesinvtTSalGDP 0,192 0,247 0,000 1,299 DesinvtWrOffGDP 0,096 0,170 0,000 1,371 PB 34,085 52,608 7,000 437,750 RDgrowth 0,074 0,082 -0,191 0,357
Table 4 Correlations Matrix (1) (2) (3) (4) (5) (6) (7) (8) (9) (10) (11) (12) (13) (14) (1) FundRaisGDP 1 (2) TotalInvtVCGDP 0,830 a 1 (3) InvtHighTechGDP 0,736 a 0,889 a 1 (4) InvtEarStgGDP 0,592 a 0,727 a 0,867 a 1 (5) GDPgrowth 0,137 b 0,096 0,129 b 0,120 1 (6) RealInterestRate -0,163 b -0,194 a -0,271 a -0,258 a -0,380 a 1 (7) UnemploymentRate -0,232 a -0,268 a -0,312 a -0,290 a -0,067 0,252 a 1 (8) DesinvtIPOGDP 0,462 a 0,498 a 0,332 a 0,172 a -0,045 -0,081 -0,206 a 1 (9) SMCgrowth 0,003 -0,137 -0,169 b -0,089 0,186 b 0,105 0,150 b -0,009 1 (10) TEA -0,041 -0,198 -0,082 -0,081 0,322 b -0,292 -0,135 -0,063 0,132 1 (11) DesinvtTSalGDP 0,612 a 0,537 a 0,329 a 0,176 a 0,061 -0,116 -0,124 0,520 a -0,020 -0,146 1 (12) DesinvtWrOffGDP 0,252 a 0,294 a 0,278 a 0,206 a -0,098 -0,123 -0,208 a 0,314 a -0,283 a -0,060 0,224 a 1 (13) PB 0,184 b 0,181 b 0,122 -0,001 -0,007 0,044 0,140 0,171 b -0,148 0,061 0,117 0,192 b 1 (14) RDgrowth 0,256 a 0,238 a 0,310 a 0,314 a 0,704 a -0,424 a -0,263 a -0,064 0,188 b 0,394 a -0,079 0,020 -0,050 1
Note: The data has been collected by the authors in the institutions mentioned in the text, getting 276 observations. In the table we presented the correlations matrix for the variables used in the
Table 5 Comparison between ours results, in the dependent variable, and the ones in the revision literature
Gompers e Lerner (1998) Jeng e Wells (1998/2000) Marti e Balboa (2001) Romain e La Potterie (2004) Ours analysis
Potencial Determinants USA industry aggregated
data 21 Countries, panel data and cross section
16 Countries, panel data
and cross section 16 Countries, panel data
23 Countries, panel data and cross section Macroeconomics Conditions:
GDP + (and GDP growth) 0 (and GDP growth) (GDP growth) 0 + (GDP growth) +
Level of Interest Rate (1 Year) + aggregated level and -
state level +
Level of Interest Rate (10 Years) + +
Difference between the two interest rates -
Private Pension Funds + + throughout time and 0 between countries
Entrepreneurial Variables:
Capital Gains Tax Rate - 0 0
Labour Market Rigidities - in early stage e 0 in expansion - it reduce the GDP impact and the R&D on VC IPO 0 0 in early stage between countries and + in
expansion +
Stock Market Opportunities (Equity Market Return +) (Market capitalization growth 0) +
Level of Entrepreneurship + it increases the impacto of R&D on VC -
VC investment/GDP + + VC investment/GDP(-1) + VC divestment/GDP 0 + VC divestment/GDP(-1) - IPO divestment/GDP 0 IPO divestment/GDP(-1) 0 WR divestment/GDP(-1) - - Fundraising trends + Technological Opportunities:
Number of Triadic patents +
Business R&D growth + + (value only) -
Stock of Knowledge + +
ERISA'S prudent man rule +
Note: The table presents a comparison of ours results with the state of the art. The variables descriptions are in table 2. The data has been collected by the authors in the institutions mentioned in
Table 6 Empirical results with random effects models for the FundRaisGDP variable
Potencial Determinants FundRaisGDP (Random Effects)
Model 1 Model 2 Model 3 Model 4 Model 5 Model 6 Model 7
Macroeconomics Conditions: GDPgrowth 0,003 (1,172) 0,011 e (1,399) 0,015 d (1,596) 0,003 (0,732) -0,020 e (-1,396) -0,004 (-0,282) -0,014 (-0,693) RealInterestRate -0,016 b (-2,307) 0,036 b (2,020) 0,035 c (1,859) -0,003 (-0,340) 0,027 (1,010) 0,033e (1,284) 0,024 (0,736) UnemploymentRate -0,019 a (-3,629) -0,017 e (-1,404) -0,012 (-0,830) -0,011 b (-2,051) -0,008 (-0,460) -0,012 (-0,681) -0,022 (-1,029) Entrepreneurial Variables: DesinvtIPOGDP 0,009 a (3,007) 0,009 a (2,729) 0.003 b (2,096) 0,002 (0,693) SMCgrowth 0,000 a (3,114) 0,000 a (2,653) 0,000 a (6,484) 0,000 a (3,066) 0,003 b (2,362) 0,002 (1,052) TEA 0,000 (0,480) 0,000 (0,448) 0,000 (-0,052) 0,000 (0,460) 0,000 (0,221) DesinvtTSalGDP 0,007 a (3,351) DesinvtWrOffGDP -0,001 (-0,266) PB -0,000 (-0,939) 0,000 (0,559) -0,000 (-0,513) 0,000 (0,195) 0,000 (-0,147) Technological Opportunities: RDgrowth 0,014 d (1,515) 0,005 (0,486) 0,007 (0,572) Adjusted R-squared 0,013 0,717 0,696 0,744 0,596 0,424 0,015
Note: The data has been collected by the authors in the institutions mentioned in the text, getting 276 observations. The variables descriptions are in table 2. In the table the dependent variable is
FundRaisGDP and the independent variables vary from model to model. The set of independent variables is: GDPgrowth, RealInterestRate, UnemploymentRate, DesinvtIPOGDP, SMCgrowth, TEA, DesinvtTSalGDP, DesinvtWrOffGDP, PB, RDgrowth. In the table we present the results of random effects panel data models. In parentheses we present the values of the t-statistics for each variable. The t-statistics values are significant at the following levels: a significance at 1%; b significance at 5%; c significance at 10%; d significance at 15%; and, e significance at 20%.
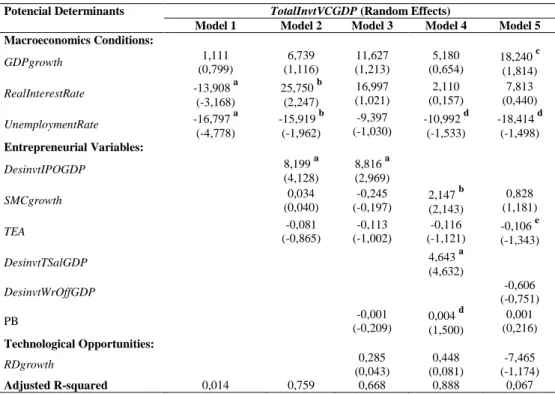
Table 7 Empirical results with random effects models for the TotalInvtVCGDP variable
Potencial Determinants TotalInvtVCGDP (Random Effects)
Model 1 Model 2 Model 3 Model 4 Model 5
Macroeconomics Conditions: GDPgrowth 1,111 (0,799) 6,739 (1,116) 11,627 (1,213) 5,180 (0,654) 18,240 c (1,814) RealInterestRate -13,908 a (-3,168) 25,750 b (2,247) 16,997 (1,021) 2,110 (0,157) 7,813 (0,440) UnemploymentRate -16,797 a (-4,778) -15,919 b (-1,962) -9,397 (-1,030) -10,992 d (-1,533) -18,414 d (-1,498) Entrepreneurial Variables: DesinvtIPOGDP 8,199 a (4,128) 8,816 a (2,969) SMCgrowth 0,034 (0,040) -0,245 (-0,197) 2,147 b (2,143) 0,828 (1,181) TEA -0,081 (-0,865) -0,113 (-1,002) -0,116 (-1,121) -0,106 e (-1,343) DesinvtTSalGDP 4,643 a (4,632) DesinvtWrOffGDP -0,606 (-0,751) PB -0,001 (-0,209) 0,004 d (1,500) 0,001 (0,216) Technological Opportunities: RDgrowth 0,285 (0,043) 0,448 (0,081) -7,465 (-1,174) Adjusted R-squared 0,014 0,759 0,668 0,888 0,067
Note: The data has been collected by the authors in the institutions mentioned in the text, getting 276 observations. The variables descriptions are in table 2. In the table the dependent variable is TotalInvtVCGDP and the independent variables vary from model to model. The set of independent variables is: GDPgrowth, RealInterestRate, UnemploymentRate, DesinvtIPOGDP, SMCgrowth, TEA, DesinvtTSalGDP, DesinvtWrOffGDP, PB, RDgrowth. In the table we present the results of random effects panel data models. In parentheses we present the values of the t-statistics for each variable. The t-t-statistics values are significant at the following levels: a significance at 1%; b significance at 5%; c significance at 10%; d significance at 15%; and, e significance at 20%.
Table 8 Empirical results with random effects models for the InvtHighTechGDP variable
Potencial Determinants InvtHighTechGDP (Random Effects)
Model 1 Model 2 Model 3 Model 4 Model 5
Macroeconomics Conditions: GDPgrowth 0,378 (0,639) 3,388 e (1,298) 9,179 a (2,508) 9,742 a (2,657) 8,362 b (2,145) RealInterestRate -6,255 a (-3,424) 11,062 b (2,234) 12,272 c (1,727) 10,781 c (1,684) 9,700 d (1,482) UnemploymentRate -6,249 a (-4,989) -8,381 b (-2,386) -6,634 d (-1,491) -6,876 c (-1,607) -7,677 c (-1,789) Entrepreneurial Variables: DesinvtIPOGDP 1,312 d (1,528) 0,797 (0,699) SMCgrowth 0,229 (0,619) 0,430 (1,176) 0,684 b (2,413) 0,566 b (1,970) TEA -0,026 (-0,630) -0,030 (-0,952) -0,028 (-0,925) -0,032 (-1,015) DesinvtTSalGDP 0,501 (1,011) DesinvtWrOffGDP -0,158 (-0,481) PB -0,002 d (-1,605) -0,001 (-1,266) -0,001 e (-1,375) Technological Opportunities: RDgrowth -2,049 (-0,823) -2,787 (-1,173) -2,288 (-0,929) Adjusted R-squared 0,037 0,523 0,088 0,165 0,059
Note: The data has been collected by the authors in the institutions mentioned in the text, getting 276 observations. The variables descriptions are in table 2. In the table the dependent variable is InvtHighTechGDP and the independent variables vary from model to model. The set of independent variables is: GDPgrowth, RealInterestRate, UnemploymentRate, DesinvtIPOGDP, SMCgrowth, TEA, DesinvtTSalGDP, DesinvtWrOffGDP, PB, RDgrowth. In the table we present the results of random effects panel data models. In parentheses we present the values of the t-statistics for each variable. The t-t-statistics values are significant at the following levels: a significance at 1%; b significance at 5%; c significance at 10%; d significance at 15%; and, e significance
Table 9 Empirical results with random effects models for the InvtEarStgGDP variable
Potencial Determinants InvtEarStgGDP (Random Effects)
Model 1 Model 2 Model 3 Model 4 Model 5 Model 6
Macroeconomics Conditions: GDPgrowth -0,019 (-0,063) 0,688 (0,540) 2,598 c (1,775) 3,496 e (1,407) 3,109 (1,226) 2,318 (0,880) RealInterestRate -2,834 a (-3,139) 4,059 c (1,642) 5,080 b (2,008) 9,896 b (2,112) 6,648 d (1,566) 6,106 d (1,447) UnemploymentRate -2,061 a (-3,851) -3,207 b (-2,147) -1,792 (-1,078) -1,945 (-0,678) -2,754 (-1,033) -3,186 (-1,242) Entrepreneurial Variables: DesinvtIPOGDP 0,605 d (1,503) 0,938 b (2,104) 1,090 e (1,415) SMCgrowth 0,241 e (1,283) 0,013 (0,061) -0,008 (-0,031) 0,255 (1,184) 0,201 (0,925) TEA -0,021 (-1,014) -0,027 e (-1,286) -0,027 (-1,242) -0,029 (-1,229) -0,031 e (-1,328) DesinvtTSalGDP 0,167 (0,501) DesinvtWrOffGDP -0,140 (-0,573) PB -0,001 b (-2,010) -0,001 c (-1,890) -0,001 (-1,233) -0,001 (-1,194) Technological Opportunities: RDgrowth 0,041 (0,024) -0,463 (-0,279) -0,229 (-0,138) Adjusted R-squared 0,000 0,505 0,456 0,035 0,081 0,065
Note: The data has been collected by the authors in the institutions mentioned in the text, getting 276 observations. The variables descriptions are in table 2. In the table the dependent variable is InvtEarStgGDP and the independent variables vary from model to model. The set of independent variables is: GDPgrowth, RealInterestRate, UnemploymentRate, DesinvtIPOGDP, SMCgrowth, TEA, DesinvtTSalGDP, DesinvtWrOffGDP, PB, RDgrowth. In the table we present the results of random effects panel data models. In parentheses we present the values of the t-statistics for each variable. The t-t-statistics values are significant at the following levels: a significance at 1%; b significance at 5%; c significance at 10%; d significance at 15%; and, e significance at 20%.
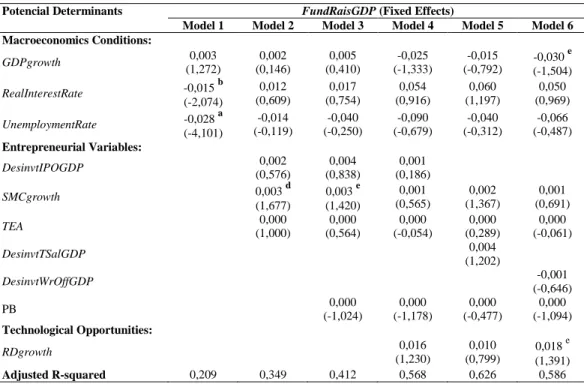
Table 10 Empirical results with fixed effects models for the FundRaisGDP variable
Potencial Determinants FundRaisGDP (Fixed Effects)
Model 1 Model 2 Model 3 Model 4 Model 5 Model 6
Macroeconomics Conditions: GDPgrowth 0,003 (1,272) 0,002 (0,146) 0,005 (0,410) -0,025 (-1,333) -0,015 (-0,792) -0,030 e (-1,504) RealInterestRate -0,015 b (-2,074) 0,012 (0,609) 0,017 (0,754) 0,054 (0,916) 0,060 (1,197) 0,050 (0,969) UnemploymentRate -0,028 a (-4,101) -0,014 (-0,119) -0,040 (-0,250) -0,090 (-0,679) -0,040 (-0,312) -0,066 (-0,487) Entrepreneurial Variables: DesinvtIPOGDP 0,002 (0,576) 0,004 (0,838) 0,001 (0,186) SMCgrowth 0,003 d (1,677) 0,003 e (1,420) 0,001 (0,565) 0,002 (1,367) 0,001 (0,691) TEA 0,000 (1,000) 0,000 (0,564) 0,000 (-0,054) 0,000 (0,289) 0,000 (-0,061) DesinvtTSalGDP 0,004 (1,202) DesinvtWrOffGDP -0,001 (-0,646) PB 0,000 (-1,024) 0,000 (-1,178) 0,000 (-0,477) 0,000 (-1,094) Technological Opportunities: RDgrowth 0,016 (1,230) 0,010 (0,799) 0,018 e (1,391) Adjusted R-squared 0,209 0,349 0,412 0,568 0,626 0,586
Note: The data has been collected by the authors in the institutions mentioned in the text, getting 276 observations. The variables descriptions are in table 2. In the table the dependent variable is FundRaisGDP and the independent variables vary from model to model. The set of independent variables is: GDPgrowth, RealInterestRate, UnemploymentRate, DesinvtIPOGDP, SMCgrowth, TEA, DesinvtTSalGDP, DesinvtWrOffGDP, PB, RDgrowth. In the table we present the results of random effects panel data models. In parentheses we present the values of the t-statistics for each variable. The t-t-statistics values are significant at the following levels: a significance at 1%; b significance at 5%; c significance at 10%; d significance at 15%; and, e significance at 20%.
Table 11 Empirical results with fixed effects models for the TotalInvtVCGDP variable
Potencial Determinants TotalInvtVCGDP (Fixed Effects)
Model 1 Model 2 Model 3 Model 4 Model 5 Model 6
Macroeconomics Conditions: GDPgrowth 1,398 (1,017) 7,091 (1,206) 9,139 d (1,615) 24,569 c (2,144) 19,146 d (1,584) 20,867 d (1,721) RealInterestRate -12,779 a (-2,829) 12,074 (1,162) 13,246 (1,338) 17,653 (0,496) 20,322 (0,660) 26,609 (0,857) UnemploymentRate -22,914 a (-5,316) 13,232 (0,213) -30,733 (-0,432) -41,953 (-0,524) -63,637 (-0,794) -11,153 (-0,137) Entrepreneurial Variables: DesinvtIPOGDP 2,797 e (1,365) 3,789 c (1,899) -1,920 (-0,516) SMCgrowth 0,257 (0,285) 0,480 (0,540) 1,312 (1,069) 0,610 (0,718) 0,569 (0,625) TEA -0,011 (-0,124) -0,101 (-1,072) -0,081 (-0,807) -0,107 (-1,071) -0,072 (-0,739) DesinvtTSalGDP -2,016 (-1,065) DesinvtWrOffGDP (-0,812) -0,707 PB -0,002 (-0,748) 0,001 (0,199) -0,002 (-0,556) 0,000 (0,140) Technological Opportunities: RDgrowth -12,041 e (-1,545) -7,979 (-1,041) -8,985 (-1,166) Adjusted R-squared 0,300 0,233 0,402 0,615 0,648 0,631
Note: The data has been collected by the authors in the institutions mentioned in the text, getting 276 observations. The variables descriptions are in table 2. In the table the dependent variable is TotalInvtVCGDP and the independent variables vary from model to model. The set of independent variables is: GDPgrowth, RealInterestRate, UnemploymentRate, DesinvtIPOGDP, SMCgrowth, TEA, DesinvtTSalGDP, DesinvtWrOffGDP, PB, RDgrowth. In the table we present the results of random effects panel data models. In parentheses we present the values of the t-statistics for each variable. The t-t-statistics values are significant at the following levels: a significance at 1%; b significance at 5%; c significance at 10%; d significance at 15%; and, e significance at 20%.