1
GRANDFATHERING VS. AUCTIONING IN THE EU ETS: AN EXPERIMENTAL STUDY.
Anabela Botelhoa, M. Eduarda Fernandesb and Lígia Pintoa a
NIMA, Minho University; b Polytechnic Institute of Leiria
World Congress of Environmental and Resource Economists 4th Edition - Montréal, Canada
June 28 – July 2, 2010
Abstract
The present paper is the first to simultaneously include rules and parameters that try to parallel the EU ETS in the laboratory. To study the adequacy of the institution chosen for the EU ETS is our goal as well as testing the impact of changing the initial allocation rule: auctioning instead of grandfathering, in two different experimental treatments.
The use of auctions as a rule for the initial allocation method for CO2 emission permits,
in the next stages of the EU ETS (European Union Emissions Trading Scheme) is a subject the European Commission and its Member-States are currently discussing and evaluating. This paper is the first to experimentally test the Ausubel (2004) auction for the case of CO2 emission permits in the EU ETS, a theoretically efficient dynamic
design for multiple units with results equivalent to the Vickrey auction.
Our experimental results suggest that the Ausubel auction does not allocate CO2
emission permits efficiently but at the end total abatement cost minimization is still achieved in the auctioning treatment. The importance of the secondary market, and its functioning rules, is highlighted in this experimental treatment. Moreover, we conclude efficiency is the same whether emission permits are initially auctioned or grandfathered.
2
1. Introduction
Greenhouse gases (GHG) emissions with anthropogenic causes are nowadays recognized as the main cause for the global warming problem. Even if controversy exists about its true dimension, consequences or human capacity of adaptation, GHG reduction is on the political agenda of all world leaders. The 15th Conference of Parties (COP15) in the United Nations Framework Convention on Climate Change (UNFCCC) - Climate Conference in Copenhagen, December 2009 - gathered governmental representatives from about 170 countries and a post-Kyoto Protocol was expected to be signed at the end. However, that did not happen and only an Accord was signed, which means there is not a compromise for the period post-2012 concerning GHG emissions’ reductions. COP16 at Mexico City will inevitably include long additional negotiations in order to bring the parts into a consensual compromise.
Even if international diplomacy results’ for GHG emissions’ reductions are still uncertain, the European Union has stepped forward in its compromises by defining on its Climate Policy the goal to reduce greenhouse gases at least 20% by 2020 compared with 1990 levels. The European Union Emissions Trading System (EU ETS) it is a major policy initiative to achieve that compromise on what concerns CO2 emissions.
This political choice to fight a global negative externality is on the same line as the Kyoto Protocol flexible mechanisms, which included an international market for GHG transaction, as well as the more recent RGGI – Regional Greenhouse Gas Initiative, for 10 states of the US. 1 Since the decades of 1980/1990 emission permit markets have been used for local pollutants like SO2 (sulphur dioxide), mainly in the US and Canada,
but its application for a global pollutant, like CO2, has an innovative character. For that
reason and also because the EU ETS dimension and complexity was considerably different from previous markets - due to its multi- jurisdictional political structure, connection between differing domestic emissions permits programs, etc. – we focused into this specific application of emission permits markets (EPM).
From the many studies existent about the EU ETS a consensual point can be highlighted: the importance of the institutional rules adopted for its performance, as for
1
Connecticut, Delaware, Maine, Maryland, Massachusetts, New Hampshire, New Jersey, New York, Rhode Island, Vermont.
3 any other EPM. Particularly, the initial allocation rule decided under the 2003/87/EC Directive, recurrently appears as one of least positive aspects of the institution chosen to implement the EU ETS. In fact, auctioning instead of grandfathering is presently recommended inside the EU for the third phase of the market (starting 2013), as we can find in the COM(2008) 16 final from 23.1.2008. Our study intends to contribute to the ongoing discussion concerning the use of auctions as a rule for the initial allocation method for CO2 emission permits in the next stages of the EU ETS. Under Dales (1968)
and Montgomery (1972) original model for EPM the initial allocation rule does not affect the policy instrument efficiency (it matters only on equity terms). Their results, however, suppose a perfectly competitive market and in the EU ETS this is not the case. Therefore, we decided to investigate the performance of an EPM similar to the EU ETS under alternative allocation rules: grandfathering and auctioning. To achieve our goal we selected the experimental methodology, widely used for emission permit markets, with purposes similar to ours, for the American and Canadian markets: works by Godby et al. (1997), Cronshaw and Brown-Kruse (1999), Franciosi et al. (1999), Cason et al. (1999), Mestelman et al. (1999) and Gangadharan et al. (2005) are just a few. Surprisingly, for the EU ETS this was not the case. To our knowledge, the present work is the first experiment to include both the rules and the parameters that parallels the EU ETS structure. Benz and Ehrhart (2007) experimental study on the initial allocation of CO2 allowances in the EU ETS, for instance, is far
from being an EU ETS testbeding as it is far from representing the institution chosen and so cannot be said to test its performance. Therefore, the first contribution we can identify from the present paper is the construction of an experimental design that includes as many characteristics as possible from the EU ETS. Our laboratorial market was characterized by imperfect competition (agents with different dimensions, different marginal abatement costs and different environmental targets) under a cap-and-trade system, with banking allowed, a secondary market represented by a double auction with discriminative prices and a penalty structure for incompliance2 similar to the 2003/87/EC Directive.
To examine the impact of the initial allocation rule – our experimental variable – we considered, for the case of an initial auction, the Ausubel (2004) model, an efficient
2
4 dynamic design for multiple units with results equivalent to the Vickrey auction. Several types of auctions have been already experimentally tested for the initial allocation of emission permits3 but the present study is the first to implement this particular auction. From our experimental results we conclude that the Ausubel auction it is not an efficient initial allocation method for CO2 emission permits in the EU ETS
but with the reallocation of permits in the secondary market total abatement cost minimization was achieved. And, even in the presence of an imperfectly competitive market, there is no statistically significant difference between efficiency of the laboratorial market we represented under different initial allocation rule (auctioning or grandfathering).
A third innovation of this paper is the elicitation of subjects’ risk aversion preferences included in our experimental design. This is the first on EPM that explicitly classifies participants in the experiments on what concerns their attitudes towards risk, which allows us to test the hypothesis pointed in the literature about the relation between subjects’ banking behavior and their attitudes towards risk – and our experimental results could not confirm this theoretical hypothesis.
The rest of this paper is organized as follows: in Section 2 we describe our experimental design, including rules and parameters of our laboratorial market as well as the procedures followed in all experimental sessions; in Section 3 the hypothesis to be tested are presented; in Section 4 we analyze our experimental results; and finally, Section 5 concludes, summarizing our main findings.
2. Experimental Design and Procedures
In order to attain our goal we implemented computerized experimental sessions, using zTree software and all of them were constituted by three parts: 1) Socioeconomic questionnaire; 2) Multiple Price List (MPL); 3) an Emission Permits Market (EPM).
The two first parts were included for control purposes and the last and central part of the experiment consisted of a laboratory representation of a specific emission permits
3
As it is the case of Holt et al. (2007) experimental study that tests five alternative auction rules – two static and three dynamic.
5 market – parallel to the EU ETS. If the first part, a socioeconomic questionnaire, it is usual procedure and raises no questions, the second part of our experiments, a Multiple Price List (as in figure 1) for elicitation of risk aversion attitudes (as in Holt and Laury (2002)), constitutes an innovative procedure on this kind of experiments.
Fig.1 – zTree screen for the MPL used
The objective was to classify our participants considering their attitudes towards risk and use these results for a better knowledge of our sample and, hopefully, a better understanding of agents’ strategies on the market (on the third part of the session), which was run under uncertainty about effective emission permits demand, due to random factors influencing effective abatement.
Market agents do not have perfect information when deciding how to respect the environmental restriction they face and minimizing costs, on the third part of our experimental sessions. This characteristic was included in order to give us a more realistic environment because, in fact, there are many reasons why this may happen – measurement errors, unpredicted factors that influence the availability of resources like energy or different kind of fuels, which represents, at the end, more or less pollution than planned at first.
6 Uncertainty in our EPM was introduced according to Godby et al. (1997) procedure: a random variation on emissions was drawn from a uniform distribution (-1, 0, +1). And, to assure comparability of results, we used the same uniform distribution for the different experimental sessions.
Besides considering a market under uncertainty on demand, we implemented a cap-and-trade system but with a more restrictive environmental target than the one fixed in the European Union to guarantee effective scarcity on emission permits (and to avoid the lack of liquidity on the market if the original target was kept). However, the amount of emission permits each of our eight participants received was proportional to the Burden Sharing Agreement (BSA), which consisted on dividing the burden of the EU commitment under the Kyoto Protocol unequally amongst member states.
For the abatement cost structure of each participant we considered Eyckmans et al. (2000) estimation for the coefficients of the marginal abatement cost functions of 14 countries of the EU-15. Among these we chose eight countries, including the most pollutant ones. Our participants’ dimension and marginal abatement cost structure - as in table 14 - intended to parallel that of the chosen EU-15 member-states. This means the laboratory market we represented had an imperfect competitive structure: participants with heterogeneous dimensions, marginal abatement costs and emission targets – under uncertainty context on the demand side, due to imperfect information about effective emission levels.
On what concerns emission permits intertemporal validity, we allowed banking but not borrowing, as predicted in the 2003/87/EC Directive: non-used permits are still valuable for the following periods but participants are not allowed to use on the current period emission permits they know will be given for the next periods.
4
Although participant representing Germany could only see a total of 28 units, 20 of them grandfathered, this participant real dimension was 38 units (with 30 grandfathered emission permits). This simplification was due to a technical difficulty of representing a table with 38 units on a zTree screen considering information from a subjects table.
7 Table 1 – Marginal abatement costs
Units Belgium (S1) Spain (S2) Germany (S3) Greece (S4) France (S5) Italy (S6) U.K. (S7) Netherlands (S8) 1 76 37 4 59 21 17 6 32 2 177 90 11 149 56 42 15 76 3 291 152 18 255 100 72 25 127 4 413 220 27 374 151 105 37 182 5 543 294 36 503 208 140 50 241 6 678 372 46 270 177 63 304 7 454 56 337 216 77 369 8 539 67 408 257 92 436 9 627 79 483 300 107 506 10 719 91 561 344 123 11 813 103 643 389 140 12 909 115 729 436 157 13 1008 128 817 484 174 14 142 908 533 192 15 155 1002 583 210 16 169 1099 634 228 17 184 1199 686 247 18 198 1301 739 266 19 213 792 286 20 228 847 306 21 243 326 22 259 346 23 274 367 24 290 388 25 307 409 26 323 431 27 340 28 356
Note: Units covered by grandfathered emission permits are signaled in bold – correspond to avoided abatement costs before banking or going to the market. Its sum equals 88 and corresponds to (fixed) supply of permits in each period.
8 For the secondary market a double auction with discriminative prices was implemented (reflecting rules of exchanges), which means participants pay what they bid or receive what they offer/accept in the market. Additionally, only profitable transactions were allowed and subjects had to respect the improvement rule while making their bids/asks in the market. Further, no re-sale was possible in the market (once bought, emission permits had to be used to avoid abatement costs).
Each subject knew only their own marginal abatement costs and maximum permits needed. However, each transaction made in the market was publicly known (although the seller/buyer identification was not available). This market closed when time limit was reached (3 minutes) or all participants press “OK to next stage” button on the zTree screen. Information about random fluctuations on emissions appeared on the next screen and after that subjects were given the possibility to participate again in the market or change their banking decisions, to try to balance their positions.
A penalty for incompliance was introduced, similar to the 2003/87/EC Directive, as well as the other institutional rules referred for our laboratorial market. Besides a monetary penalty, about four times the emission permits equilibrium price, subjects were obliged to deliver one emission permit more on the period after being incompliant. Initial allocation of permits was our experimental variable so we implemented one experimental treatment with grandfathering – as the 2003/87/EC Directive – and another with auctioning of 100% of emission permits available – following recommendations as in COM(2008) 16 final from 23.1.2008. For the auctioning treatment we were compelled to make a decision about its rules of functioning, as we were representing something that is not yet a reality for the EU ETS. Sealed-bid uniform price auctions are well known by utilities regulated in the EU ETS, have been used by Ireland, Hungary and Lithuania in the first phase of the EU ETS and Holt et al. (2007) recommend it to auction CO2 under the RGGI – Regional Greenhouse Gas
Initiative. However, for multiple units auctioning the literature consider this is not an efficient auction format, as it results in demand reduction (Ausubel e Cramton (1998); Holt (2006)). Although theoretically recognized its superiority for multiple units auctions, the second-price sealed bid format – the Vickrey auction – it is not usually implemented in practice due to its complexity. Ausubel (2004) has proven to have
9 found an equivalent dynamic version of Vickrey auction, much easier to implement and understand, therefore we considered we should implement its rules to auction CO2
emission permits in our laboratorial market. This is a dynamic auction, similar to the English one, with differences mainly on the rules used to determine the winning bids and the price paid for each unit bought. For each price asked by the auctioneer it is calculated the difference between total supply and residual demand, for each subject, and if it is positive participant receive that quantity, for the price proposed. This clinching rule was applied for each subject and each price proposed by the auctioneer, until total demand is equal or less than total supply (and the auction closed at this point).
Table 2 – Summary of the different stages from the 3th part of the experimental design
Stage 0: Auction participation for acquisition of emission permits offered
Possibility of making bids (quantities) for each price proposed by the auctioneer.
Stage 1: Banking decision
Subjects decide whether or not to use all the permits – i.e., decide to bank, or not, some of their permits.
Stage 2: Permit market participation
Possibility of buying/selling permits to other subjects. Emission permits for the current period, not banked on the previous stage, can be sold at a price higher than the marginal abatement cost and permits may be bought to cover units to abate, at a cost inferior to its marginal abatement cost.
Stage 3: Information about random shock .
At this stage no decision has to be made.
Participants are informed about non-predicted fluctuations on their emissions. It is announced the (-1, 0 ou +1) random fluctuation for the period and its impact on subjects’ earnings. Information is given about possibilities available to reduce the negative impacts onearnings (or even make profits).
Stage 4: Reconciliation market participation
Only participants with +1 or -1 at previous stage can participate on this market and they are allowed to buy/sell the unit correspondent to the random fluctuation.
No restrictions are imposed to transaction prices, which means transactions at a loss are possible on this market.
Stage 5: Re-banking.
Participants with a surplus permit, not sold at the reconciliation market, are given a chance, on this stage, to save it for future use.
Participants with permit deficit that were not able to buy it at the previous stage are given a chance to use an emission permit previously banked. Obviously, this stage only opens if participants had previously banked at least one permit. If that is not the case, even if the participant is not able to buy the permit on the reconciliation market, he pays the penalty and goes immediately to the next
period, after stage 4, where he receives one permit less. 5
5
On the auction treatment, if the participant does not buy any permit in the auction, on the period after being incompliant, an extra unit must be abated, at a higher cost than all the others.
10 A private value, incomplete information version of the Ausubel (2004) auction was implemented. This means subjects knew only their own marginal abatement costs and while the auction was open they did not know anything about others demand not even the result for his own proposals. As long as the price in the auction increased subjects could conclude demand for permits was still higher than supply.
Although experimental studies exist on the performance of this particular auction,6 the present paper is the first to do it for the case of CO2 emission permits, including
characteristics as banking, a secondary market and uncertainty on demand.
After auction closed and emission permits were allocated among participants, subjects were asked to make their banking decision. For the grandfathering treatment this stage was the first as emission permits initial allocation was already made and it was fixed during the session. As we summarize on table 2, the different stages included in the third part of our sessions – the EPM - were sequential, and repeated 10 times in each experimental session. Previously to this 10 period real market subjects participated in a 5 period training period,7
not considered for payment effects as its goal was to introduce subjects to the environment where decisions had to be made and to assure all the rules were understood.
Our laboratorial market was described using a neutral language on instructions. Emission permits, environmental goals or policy instruments for regulation were never mentioned. Subjects were told that an homogeneous good was produced at different scales and costs and could be traded in a market, with the rules presented. Although some experimental studies do otherwise, this is the most usual procedure in laboratory experiments on EPM. To avoid moral or ethical personal judgments to influence subjects’ actions was the main reason for our choice on neutral language. To evaluate the institution represented, the rules chosen, to analyze if it works, if the incentives are the correct ones: this is our goal, not to know if participants agree or not with those rules.
6
Kagel and Levin (2001), Engelmann and Grimm (2004) and Manelli et al. (2006), for instance.
7
Three of this periods consisted of an accompanied and programmed training (all participants saw the same screens while experimenters were reading the instructions and giving the examples) with values different from the ones participants would face on the “real” experiment. On the other two periods subjects faced their own real values and took decisions on their own, interacting with each other.
11 For the two treatments – grandfathering and auctioning - we run 4 experimental sessions each, 8 with eight participants. 9 Subjects (non-experienced) were recruited in Minho University (Braga, Portugal) and consisted mainly on Management and Economics students. A 5€ participation fee was announced to be paid for the participation in 2h30m or 3h sessions (grandfathering or auctioning treatment, respectively) and the possibility of additional earnings depending on their decisions and some luck. Our experimental sessions lasted about the time we predicted and subjects earned on average 15.83€ and 22.15€ in the grandfathering and auctioning treatment, respectively.
3. Hypotheses
Our investigation hypotheses considered, especially, previous empirical and experimental results on EPM institutions but also tried to test validity of some theories when not all their underlying hypotheses are respected or if applied under different contexts.
Hypothesis 1: Total abatement cost minimization is possible with an EPM, similar to the EU ETS, when grandfathering is the initial allocation rule.
The laboratorial market represented had an imperfectly competitive structure as well as banking and a reconciliation market, not included in Montgomery (1972) original model. Therefore, with the experimental results from these sessions with grandfathering, a test could be made about the possibility of reaching a competitive equilibrium even if the market it is not a perfectly competitive one.
For the auctioning treatment we intended to test two hypotheses. Firstly, we wanted to evaluate the performance of the Ausubel (2004) auction for the initial allocation of emission permits. Experimentally testing this auction format in such an environment is done for the first time in this paper. Secondly, to determine the efficiency of the EPM institution, as a whole, when auctioning is the chosen allocation rule.
8
In November 2008 for the grandfathering treatment (sessions 1-4) and in May 2009 for the auctioning treatment (sessions 5-8).
9
Besides two pilot sessions, one for each treatment. Although the results from these sessions are not analyzed, they played a crucial role on the success of our experiments. With these sessions we were able to identify code bugs and problems with the instructions that were not possible otherwise.
12
Hypothesis 2: When included in an EPM as the one we represented, the Ausubel (2004) auction efficiently allocates emission permits – giving them to the subjects with the highest marginal abatement costs.
Hypothesis 3: Total abatement cost minimization is possible with an EPM, similar to the EU ETS, except for the initial allocation rule – 100% auctioning instead of grandfathering.
From hypotheses 1 and 3, we test also the Montgomery’s original prediction about indifference of initial allocation rule for the final results of EPM’s. That is to say that efficiency achieved with grandfathering should not be different from that obtained when emission permits are initially auctioned.
Hypothesis 4: Total abatement cost within our laboratorial EPM is equal for the grandfathering and auctioning treatments.
Even if hypothesis 4 is true, minimization of total abatement cost is achieved with a different number of transactions and prices on EPM, considering the initial allocation rule for emission permits:
Hypothesis 5: In the auctioning treatment equilibrium quantities in EPM are inferior to the grandfathering treatment but equilibrium prices are superior.
With an efficient auction for the initial allocation of emission permits, no transactions would occur in the EPM if banking or uncertainty (and the penalty associated) did not characterize our environment. As these characteristics were included, even with an efficient auction some transactions are necessary in the EPM to guarantee total abatement minimization costs. Two different reasons might explain the existence of profitable transactions after an efficient auction. Banking of permits won at the auction is one reason and the other is the penalty application, which consists on retaining one of the permits achieved at the market if on the period before the subject had a permit deficit. With the uncertainty matrix used in all our experiments in some periods a shortage of permits existed due to random fluctuations, which meant that, if no banking was previously made, subjects would be incompliant.
According to literature, subjects’ attitudes towards risk would influence their banking decisions so as to avoid incompliance penalties included in our design: subjects’
13 maximizing behavior would depend on their attitude towards risk. As signaled by Godby et al. (1997), for neutral and risk adverse subjects banking of one unit along the whole session it is a maximizing behavior. In this case, a precautionary strategy should be adopted to avoid losses due to random fluctuations and consequent penalties. Only risk lover subjects should decide to use all the permits they possess for the current period. Considering these two maximizing behavior possibilities we determined, as Godby et al. (1997), two different benchmarks: a Market Equilibrium Benchmark, when retention (banking) of one permit was made along the session and a System Optimum Benchmark, considering the use of all permits available in each period. As supply and demand conditions are not the same on the 10 periods of the session10 these two benchmarks were calculated for each one of the periods.
The Multiple Price List (MPL) our participants faced before starting our third part of the session (the EPM) allowed us to test, for the first time, this hypothesis:
Hypothesis 6: When included in an EPM as the one we represented – with uncertainty on abatement and penalties on incompliance -, neutral or risk adverse subjects bank one permit during the whole session.
Risk lover subjects’, on the contrary, are expected to use all the permits they have on the current period to maximize their earnings.
4. Results
4.1 Banking Behavior
Results from our MPL allowed us to conclude that participants in our experimental sessions were mainly risk neutral/adverse subjects (95%). Only 3 out of 64 subjects were classified as risk lovers therefore we would expect banking of one permit during the complete session from 61 participants (Hypothesis 6). Our results, however, did not confirm this hypothesis (z=-4.095, p=0.0000) – although banking is statistically different from one, on average, neutral/risk averse subjects bank 0.65 permits per period.
10
Although marginal abatement costs and participants’ dimensions are fixed, as well as the units grandfathered or auctioned each period (88) , supply and demand change along the session because of random fluctuations, penalties application and banking decisions.
14 Although a great difference exists between the number of participants classified as risk lovers or risk neutral/averse in our sessions, our data is, nevertheless, very important as it allow us to experimentally test this theoretical hypothesis for the first time.
Result 1: No statistically significant differences exist between risk lovers and risk neutral/adverse banking behavior.11
However, when comparing banking behavior in our two experimental treatments we found there was a statistically significant difference (z=-2.465, p=0.0137):
Result 2: Banking is higher when auctioning is the rule for initial allocation of emission permits.
This result cannot be explained by different attitudes towards risk from participants in both treatments as they are very similar (1 risk lover in the grandfathering treatment and 2 in the auctioning treatment). Inclusion of a MPL in our experimental design allows us to exclude that possibility.
A higher degree of uncertainty exists on the auctioning treatment about the number of permits each subject will possess to cover their emissions. Although supply of permits is known and fixed in each period, participants do not know how many will be able to buy in the auction as it does not depend only on their own behavior but also on residual demand. To save some permits for the next period to face the uncertainty about the result of next period’s auction could be an explanation for the higher number of permits saved on the auctioning treatment, in comparison with the grandfathering one – a precautionary strategy to avoid penalties. However, the subject who banked the most in the auctioning treatment (Subject 5 from session 5) is risk lover, which means our potential justification for these results is not valid. If some strategy is to be identified with the observed banking behavior that would be speculation and not precaution, which, once again, highlights the importance of having introduced our MPL. Further data and investigation are necessary to explain this relation between emissions permits initial allocation rules and banking behavior.
11
15 4.2 – Auctioning Treatment
Recurrent overbanking from the same subject in one of the auctioning experimental session turned the implemented auction inefficient in four out of 10 periods. Demand reduction registered in those periods resulted from the decision to use the emission permits excessively banked.12 In consequence, total auction demand was less than supply, meaning not all available permits were allocated.13 This means the environmental target achieved in this session was more restrictive than the one originally imposed, justifying the increase in total abatement costs in comparison to a command-and-control policy (for the original abatement target).
However, even if we exclude session 5 from the analysis of the Ausubel auction results, we conclude emission permits allocation was not the most efficient. Total abatement cost achieved immediately after closing auction was statistically different (higher) from our benchmarks (z=2.803 e p=0.0051).
Result 3: When implemented under the particular conditions of our laboratory environment, the Ausubel (2004) auction does not produce the sincere proposals and efficient results predicted by its author. No support was found to our hypothesis 2.
The auction format experimentally tested revealed sensitive to the additional characteristics of our laboratorial institution (possibility of banking, secondary market, uncertainty on demand and penalty structure). As we can see from figure 2, abatement costs were about 111%, 12%, 7% and 32% higher than potential costs for sessions 5, 6, 7 and 8, respectively, which indicates an inefficient emission permits allocation. Participants S1 (Belgium) and S4 (Greece) receive less units than would be optimal while participants S3 (Germany) and United Kingdom (S7), with bigger dimension and reduced marginal abatement costs, receive more CO2 emission permits than would be efficient.
Except for S5 (France) and S6 (Italy) a 5% statistically significant difference is found between the amount of permits allocated to the subjects and our theoretical predictions.
12
On period 5 from session 5, for instance, the participant responsible for this excessive banking did not buy any emission permit on the auction, when he was supposed to achieve 15 permits at the end of an efficient auction.
13
Auction average quantity was less than 88, as we can see from table 3, because of this session. If session 5 is excluded from our data, this quantity is exactly 88.
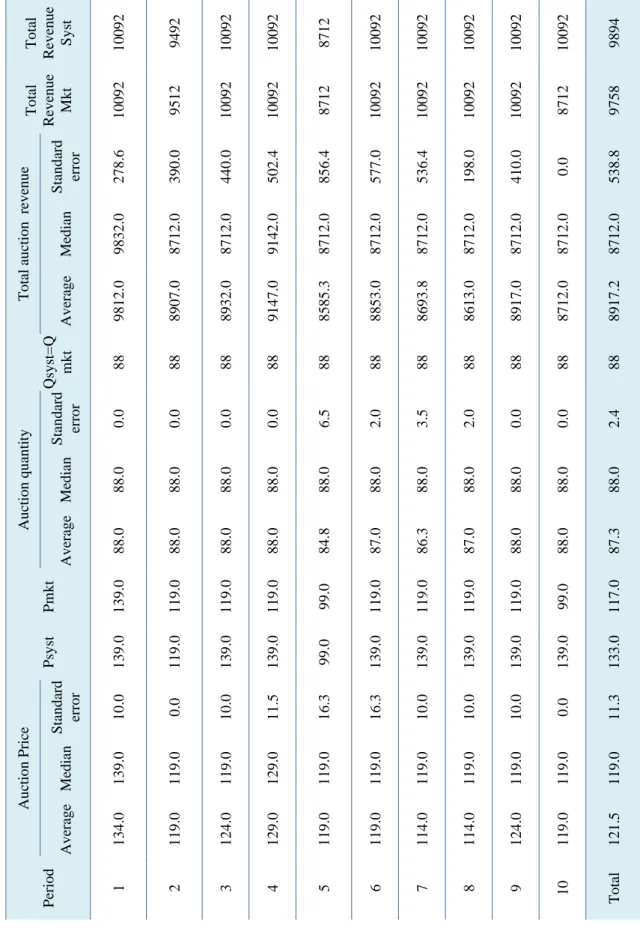
16 Ta ble 3 – Auction e xper imental resul ts (sessions 5 to 8 a v era g e) To tal Rev enu e Syst 1009 2 9 492 1 009 2 1 009 2 8 712 1 009 2 1 009 2 1 009 2 1 009 2 1 009 2 9 894 To tal Rev enu e Mkt 1009 2 9 512 1 009 2 1 009 2 8 712 1 009 2 1 009 2 1 009 2 1 009 2 8 712 9 758 To tal au ction rev enu e St anda rd er ro r 27 8. 6 39 0. 0 44 0. 0 50 2. 4 85 6. 4 57 7. 0 53 6. 4 19 8. 0 41 0. 0 0. 0 53 8. 8 Me di an 9 832 .0 8 712 .0 8 712 .0 9 142 .0 8 712 .0 8 712 .0 8 712 .0 8 712 .0 8 712 .0 8 712 .0 8 712 .0 A v er ag e 9 812 .0 8 907 .0 8 932 .0 9 147 .0 8 585 .3 8 853 .0 8 693 .8 8 613 .0 8 917 .0 8 712 .0 8 917 .2 Qsy st=Q mkt 88 88 88 88 88 88 88 88 88 88 88 Au ction qu an ti ty Standa rd er ro r 0. 0 0. 0 0. 0 0. 0 6. 5 2. 0 3. 5 2. 0 0. 0 0. 0 2. 4 Me di an 88 .0 88 .0 88 .0 88 .0 88 .0 88 .0 88 .0 88 .0 88 .0 88 .0 88 .0 A v er ag e 88 .0 88 .0 88 .0 88 .0 84 .8 87 .0 86 .3 87 .0 88 .0 88 .0 87 .3 Pmkt 13 9. 0 11 9. 0 11 9. 0 11 9. 0 99 .0 11 9. 0 11 9. 0 11 9. 0 11 9. 0 99 .0 11 7. 0 Psyst 13 9. 0 11 9. 0 13 9. 0 13 9. 0 99 .0 13 9. 0 13 9. 0 13 9. 0 13 9. 0 13 9. 0 13 3. 0 Au ction Price St anda rd er ro r 10 .0 0. 0 10 .0 11 .5 16 .3 16 .3 10 .0 10 .0 10 .0 0. 0 11 .3 Me di an 13 9. 0 11 9. 0 11 9. 0 12 9. 0 11 9. 0 11 9. 0 11 9. 0 11 9. 0 11 9. 0 11 9. 0 11 9. 0 A v er ag e 13 4. 0 11 9. 0 12 4. 0 12 9. 0 11 9. 0 11 9. 0 11 4. 0 11 4. 0 12 4. 0 11 9. 0 12 1. 5 Per iod 1 2 3 4 5 6 7 8 9 10 To tal
17 Fig.2 – Ratio between abatement costs after closing auction, in each session, and potential
abatement costs for System Optimum and Market Equilibrium benchmarks
Nevertheless, on average, the 4 experimental sessions run for the auctioning treatment achieved 90.1% and 91.4% of the potential auction revenue, for the System Optimum and Market Equilibrium benchmarks, respectively (as we can see from table 3).
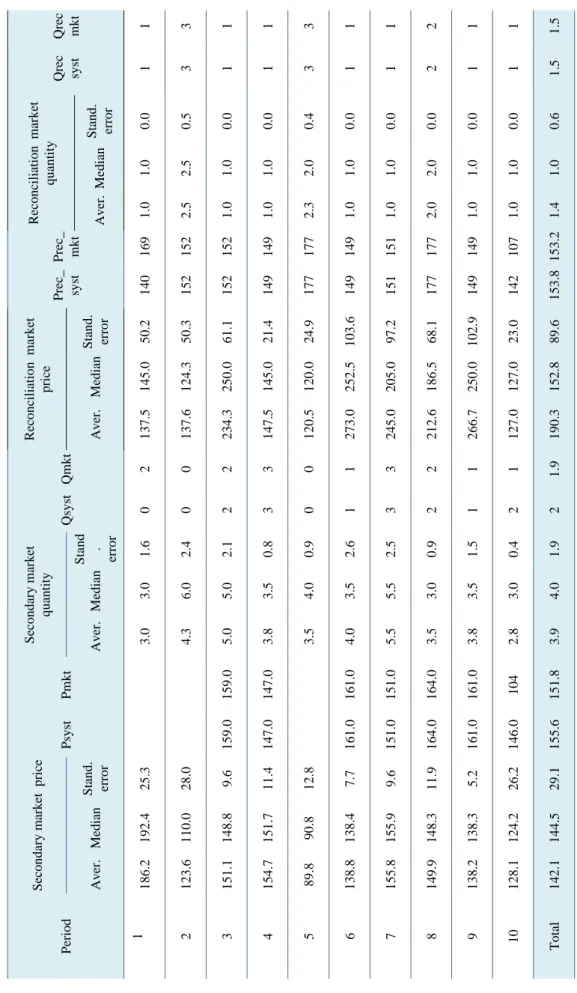
Participation in the secondary market, on the other hand, allowed emission permits to be correctly reallocated among those subjects who had higher marginal abatement costs. For that reason the average quantity of permits (profitably) transacted in the market was statistically significantly higher than predicted (considering an efficient auction). Not surprisingly, transaction prices in this market were inferior to our benchmarks, as we can see in table 4, although those differences are not statistically significant, with 95% confidence (z=-1.859, p=0.0630 and z=-0.280, p=0.7794, for System Optimum and Market Equilibrium benchmarks, respectively). In fact, an inefficient result from the auction creates potential gains from transactions inexistent otherwise14 and that explains figure 3.
14
That is why the highest number of transactions in the secondary market happens in session 5, the one with worse results for the auction.
18 Qrec mkt 1 3 1 1 3 1 1 2 1 1 1.5 Qrec syst 1 3 1 1 3 1 1 2 1 1 1.5 Reconc ili ation marke t quantity Stand. error 0.0 0.5 0.0 0.0 0.4 0.0 0.0 0.0 0.0 0.0 0.6 Median 1.0 2.5 1.0 1.0 2.0 1.0 1.0 2.0 1.0 1.0 1.0 Aver. 1.0 2.5 1.0 1.0 2.3 1.0 1.0 2.0 1.0 1.0 1.4 Table 4 –
Market prices and quantities in
t h e au ct io n in g t re at m en t ( average of sessions 5 to 8) P rec_ mkt 169 152 152 149 177 149 151 177 149 107 153.2 P rec_ syst 140 152 152 149 177 149 151 177 149 142 153.8 Reconc ili ation marke t price Stand. error 50.2 50.3 61.1 21.4 24.9 103.6 97.2 68.1 102.9 23.0 89.6 Median 145.0 124.3 250.0 145.0 120.0 252.5 205.0 186.5 250.0 127.0 152.8 Aver. 137.5 137.6 234.3 147.5 120.5 273.0 245.0 212.6 266.7 127.0 190.3 Qmkt 2 0 2 3 0 1 3 2 1 1 1.9 Qsyst 0 0 2 3 0 1 3 2 1 2 2 Secondary mark et quantity Sta n d . error 1.6 2.4 2.1 0.8 0.9 2.6 2.5 0.9 1.5 0.4 1.9 Median 3.0 6.0 5.0 3.5 4.0 3.5 5.5 3.0 3.5 3.0 4.0 Aver. 3.0 4.3 5.0 3.8 3.5 4.0 5.5 3.5 3.8 2.8 3.9 Pmkt 159.0 147.0 161.0 151.0 164.0 161.0 104 151.8 Psyst 159.0 147.0 161.0 151.0 164.0 161.0 146.0 155.6 Secondary mark et price Stand. error 25.3 28.0 9.6 11.4 12.8 7.7 9.6 11.9 5.2 26.2 29.1 Median 192.4 110.0 148.8 151.7 90.8 138.4 155.9 148.3 138.3 124.2 144.5 Aver. 186.2 123.6 151.1 154.7 89.8 138.8 155.8 149.9 138.2 128.1 142.1 Period 1 2 3 4 5 6 7 8 9 10 Total
19 Average market total surplus (consumer surplus + producer surplus) represented on figure 3, is statistically different from our System Optimum and Market Equilibrium benchmarks (z=2.366, p=0.0180 and z=2.521, p=0.0117, respectively), either we consider session 5 or not. If an efficient result for the auction had been attained in our experiments these market surplus would be impossible. But with an inefficient allocation of permits, the secondary market played a crucial role and offered much higher potential gains.
Fig.3 – Average Total surplus in the secondary market and benchmarks, in the auctioning treatment
Note: Average_TotalSurplus – Secondary market total surplus, determined as the average of sessions 5, 6,
7 and 8
TotalSurplus_Syst – Secondary market potential total surplus, without precautionary banking (System
Optimum benchmark)
TotalSurplus_Mkt - Secondary market potential total surplus, with precautionary banking (Market
Equilibrium benchmark)
An efficient permits’ allocation between participants is found, in the auctioning treatment, when we consider all market transactions (at the secondary and reconciliation market). This means total abatement costs achieved in our experimental sessions were close to our BTU (Banking & Trading & Uncertainty) competitive benchmark.15 Efficiency indexes Isi and Imi determined for each period of session i quantify realized
15
We cannot reject the hypothesis of realized total abatement cost (average for the 4 sessions) being equal to our competitive benchmarks (z=1.172, p=0.2411 and z=1.682, p=0.0926 for System Optimum and Market Equilibrium, respectively).
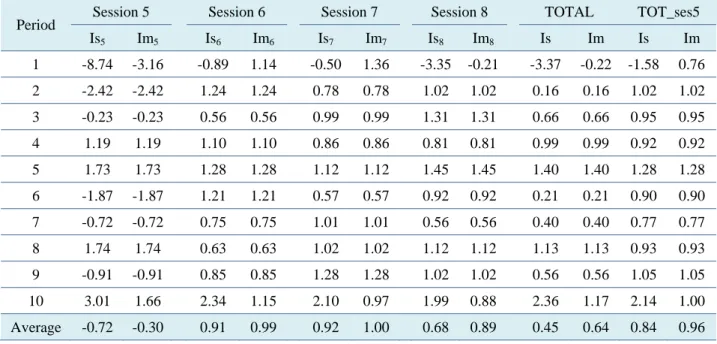
20 potential gains of our laboratorial market institution, when all permits are used in each period or one emission permits is banked for precautionary reason, respectively. As we can see from table 5, session 6 and 7 register extremely positive results, with efficiency indexes above 90% for both benchmarks (reaching 99% and 100% for Market Equilibrium benchmark!). On the contrary, session 5 presents a negative result for these indexes, which means realized total abatement costs were superior to those of a Command-and-Control (CCU) environmental policy. However, CO2 emissions abatement
achieved in session 5 is higher than our original target, used to determine CCU and BTU benchmarks. Therefore, if we exclude this session and consider only those that exactly achieved our original environmental target we find an average efficiency index for the EPM represented, with initial auction, of 84% and 96% for System Optimum and Market Equilibrium benchmarks, respectively.
Table 5 – Efficiency indexes for the auctioning treatment sessions
Period Session 5 Session 6 Session 7 Session 8 TOTAL TOT_ses5
Is5 Im5 Is6 Im6 Is7 Im7 Is8 Im8 Is Im Is Im 1 -8.74 -3.16 -0.89 1.14 -0.50 1.36 -3.35 -0.21 -3.37 -0.22 -1.58 0.76 2 -2.42 -2.42 1.24 1.24 0.78 0.78 1.02 1.02 0.16 0.16 1.02 1.02 3 -0.23 -0.23 0.56 0.56 0.99 0.99 1.31 1.31 0.66 0.66 0.95 0.95 4 1.19 1.19 1.10 1.10 0.86 0.86 0.81 0.81 0.99 0.99 0.92 0.92 5 1.73 1.73 1.28 1.28 1.12 1.12 1.45 1.45 1.40 1.40 1.28 1.28 6 -1.87 -1.87 1.21 1.21 0.57 0.57 0.92 0.92 0.21 0.21 0.90 0.90 7 -0.72 -0.72 0.75 0.75 1.01 1.01 0.56 0.56 0.40 0.40 0.77 0.77 8 1.74 1.74 0.63 0.63 1.02 1.02 1.12 1.12 1.13 1.13 0.93 0.93 9 -0.91 -0.91 0.85 0.85 1.28 1.28 1.02 1.02 0.56 0.56 1.05 1.05 10 3.01 1.66 2.34 1.15 2.10 0.97 1.99 0.88 2.36 1.17 2.14 1.00 Average -0.72 -0.30 0.91 0.99 0.92 1.00 0.68 0.89 0.45 0.64 0.84 0.96 Note: ) ( ) ( S S i S i BTU CCU AbatCost CCU Is − − = ; ) ( ) ( Im m m i m i BTU CCU AbatCost CCU − − = , i = 5, 6, 7, 8
21 Result 4: Even under imperfect competition, the EPM represented in the laboratory, with 100% auctioning for initial allocation of permits, is functional and allows substantial abatement cost reductions, comparatively to a CCU policy. Therefore, we confirm our hypothesis 3.
Considering data from our session 5 we can summarize an observed result although not originally predicted:
Result 5: An EPM as the one we represented, with an auction for emission permits initial allocation, guarantees at least the environmental target is achieved but emissions reductions can even be superior. Therefore, the environmental target becomes endogenous.
This result is a consequence of considering an EPM where banking is allowed and simultaneously auction is the initial allocation rule. Overbanking it is not a surprising behavior (identified by Gangadharan et al. (2005), for instance) but when registered in an EPM with initial auction turns the environmental result not totally controllable by the regulator. This may, or not, be a serious consequence, depending on the level of accuracy of the original environmental target, determined by the regulator. Further investigation is needed in this area to verify the importance of eventual social losses involved.
4.3 – Grandfathering Treatment
Emission permits allocation, at the beginning of each period, was fixed and known to all subjects on the grandfathering treatment. Potential gains from trade existed and these were mostly achieved in our experimental sessions. As we can see from table 6, the number of profitable transactions realized was less than potential and the average equilibrium price in the secondary market was, on the contrary, superior to our benchmarks. However, realized secondary market surplus (consumer surplus + producer surplus) was not statistically different from the potential one (t=-0.9141 and t=0.1897 for the System Optimum and Market Equilibrium, respectively). These tests confirm the picture we have from the analysis of figure 4, where market surplus seem to closely follow our theoretical predictions. However, sellers realized, on average, more than the potential gains while buyers’ surplus, on the other hand, was generally bellow our benchmarks.
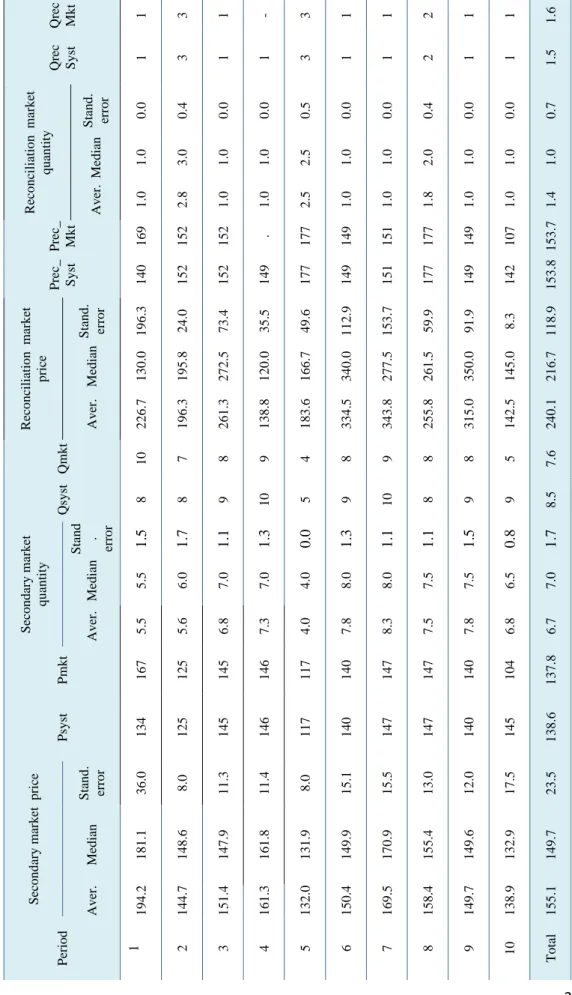
22 Qrec Mkt 1 3 1 - 3 1 1 2 1 1 1.6 Qrec Syst 1 3 1 1 3 1 1 2 1 1 1.5 Reconc ili ation marke t quantity Stand. error 0.0 0.4 0.0 0.0 0.5 0.0 0.0 0.4 0.0 0.0 0.7 Median 1.0 3.0 1.0 1.0 2.5 1.0 1.0 2.0 1.0 1.0 1.0 Aver. 1.0 2.8 1.0 1.0 2.5 1.0 1.0 1.8 1.0 1.0 1.4 Table 6–
Market prices and quantities in
the grandfathering tr ea tm ent (a verage for se ssions 1 t o 4) P rec_ Mkt 169 152 152 . 177 149 151 177 149 107 153.7 P rec_ Syst 140 152 152 149 177 149 151 177 149 142 153.8 Reconc ili ation marke t price Stand. error 196.3 24.0 73.4 35.5 49.6 112.9 153.7 59.9 91.9 8.3 118.9 Median 130.0 195.8 272.5 120.0 166.7 340.0 277.5 261.5 350.0 145.0 216.7 Aver. 226.7 196.3 261.3 138.8 183.6 334.5 343.8 255.8 315.0 142.5 240.1 Qmkt 10 7 8 9 4 8 9 8 8 5 7.6 Qsyst 8 8 9 10 5 9 10 8 9 9 8.5 Secondary mark et quantity Sta n d . error 1. 5 1. 7 1. 1 1. 3 0. 0 1. 3 1. 1 1. 1 1. 5 0. 8 1. 7 Median 5.5 6.0 7.0 7.0 4.0 8.0 8.0 7.5 7.5 6.5 7.0 Aver. 5.5 5.6 6.8 7.3 4.0 7.8 8.3 7.5 7.8 6.8 6.7 Pmkt 167 125 145 146 117 140 147 147 140 104 137.8 Psyst 134 125 145 146 117 140 147 147 140 145 138.6 Secondary mark et
price Stand. error 36.0 8.0 11.3 11.4 8.0 15.1 15.5 13.0 12.0 17.5 23.5
Median 181.1 148.6 147.9 161.8 131.9 149.9 170.9 155.4 149.6 132.9 149.7
Aver. 194.2 144.7 151.4 161.3 132.0 150.4 169.5 158.4 149.7 138.9 155.1
Period
1 2 3 4 5 6 7 8 9 10
23 Fig.4 – Average Total surplus in the secondary market and benchmarks, in the grandfathering treatment
After transactions in the secondary market, emission permits allocation between subjects it is not statistically significantly different from our theoretical prediction for a competitive market, except for those participants representing Spain (S2) and Germany (S3). This means our laboratorial institution was able to allocate permits to those subjects who faced higher marginal abatement costs. As this is the ultimate goal of this policy instrument, our experimental results are a good sign about efficiency of the institution chosen for the EU ETS (that our experimental design tries to parallel).
In fact, after considering transactions in the reconciliation market and re-banking decisions, in consequence of random fluctuations on emissions, realized total abatement costs in each grandfathering treatment session closely followed our benchmarks. No statistically significant differences are found between total abatement costs observed and our two theoretical references for a competitive market (z=0.866, p=0.3863 and z=0.968, p=0.3329 for System Optimum – BTUs - and Market equilibrium – BTUm - benchmarks,
respectively). This explains the high level of efficiency of each session for this treatment, illustrated by efficiency indexes of table 7.
24
Table 7 - Efficiency indexes for the grandfathering treatment sessions
Period Session 1 Session 2 Session 3 Session 4 TOTAL
Is1 Im1 Is2 Im2 Is3 Im3 Is4 Im4 Is Im 1 -0.62 1.29 -0.34 1.44 -1.75 0.67 0.00 1.63 -0.68 1.26 2 0.78 0.78 1.22 1.22 0.87 0.87 0.99 0.99 0.97 0.97 3 1.03 1.03 0.41 0.41 0.93 0.93 0.34 0.34 0.68 0.68 4 0.68 0.68 0.60 0.60 0.55 0.55 1.24 1.24 0.77 0.77 5 1.04 1.04 1.21 1.21 1.06 1.06 0.90 0.90 1.05 1.05 6 1.05 1.05 1.01 1.01 1.38 1.38 0.61 0.61 1.01 1.01 7 1.04 1.04 0.66 0.66 0.96 0.96 0.40 0.40 0.77 0.77 8 1.1 1.1 1.20 1.20 0.90 0.90 1.12 1.12 1.08 1.08 9 0.95 0.95 1.12 1.12 1.15 1.15 0.72 0.72 0.99 0.99 10 2.00 0.89 1.50 0.52 1.77 0.72 2.54 1.30 1.95 0.86 Average 0.91 0.99 0.86 0.94 0.78 0.92 0.89 0.93 0.86 0.95 Note: ) ( ) ( S S i S i BTU CCU AbatCost CCU Is − − = ; ) ( ) ( Im m m i m i BTU CCU AbatCost CCU − − = , i = 1, 2, 3, 4
On average, the four grandfathering sessions register an 86% efficiency index, when calculated for the System Optimum benchmark, and a 95% efficiency index for the Market Equilibrium reference. These values lead us to the following result:
Result 6: Even under imperfect competition, the EPM represented in the laboratory, with grandfathering as the rule for initial allocation of permits, is functional and allows substantial abatement cost reductions, comparatively to a CCU policy. Therefore, we confirm our hypothesis 1.
Rules implemented in our laboratorial market for the transaction of CO2 emission
permits, grandfathered to the subjects at the beginning of each period of the session, give the right incentives for an optimal reallocation of emission permits. This suggests the same result could be attained inside the EU ETS.
4.4 –Initial allocation rule impact
Sessions 1 to 4 and 5 to 8 were run for a similar experimental design except for one variable: emission permits initial allocation rule. All the rest, including participants
25 attributes, rules for transaction in the markets, the uncertainty matrix16 and penalty scheme, is exactly the same in the eight experimental sessions run. On tables 5 and 7 we presented efficiency indexes achieved on those sessions. Except for session 5, for the reason explained above, those efficiency indexes indicate most of the potential gains predicted for a competitive EPM with the rules specified on Section 2 were realized. When using the Mann-Whitney-Wilcoxon test to verify if those indexes were different for the grandfathering and auctioning sessions we concluded no statistically significant difference exists (z=0.145, p=0.8845 for both benchmarks, even when the outlier is included). This leads us to the next result:
Result 7: Total abatement costs and efficiency indexes, for an EPM as the one we represented, are the same, whether emission permits are initially grandfathered or auctioned. These results confirm Montgomery’s theoretical predictions, even if our laboratorial EPM does not respect his entire underlying hypothesis. Therefore, we found evidence in favor of our hypothesis 4.
Although the final result is approximately the same in both treatments, this was consequence from different banking behavior or transactions in the market. On what concerns to banking, as we said above, further investigation is needed to evaluate the evidence for higher amounts of banking in the auctioning treatment.
On the secondary market, we expected to register different equilibrium price and quantities, as it is clear from the benchmark values on tables 4 and 6. Traded quantities were, in fact, superior in the grandfathering than in the auctioning treatment (z=3.485, p=0.0005), as theoretically expected. However, our experimental results did not confirm the existence of higher prices in the auctioning treatment as we predicted (t=1.3832, p=0.1835).
Result 8: Equilibrium quantities in the secondary market are higher in the grandfathering treatment, which supports our hypothesis 5. However, data from equilibrium prices in both treatments it is not statistically different, contradicting the same hypothesis.
16
26 Potential gains in the secondary market were expected to be higher in the grandfathering than in the auctioning treatment. However, total surplus in both treatments was not statistically different (z=-0.302, p=0.7624) and the same happened with consumer surplus (z=-0.302, p= 0.7624). Only producer surplus is statistically different in both treatments, as we confirm with 99% confidence our theoretical predictions of higher surplus in the grandfathering treatment (z=3.628, p=0.0003). This means total surplus in the market for the auctioning treatment were higher than predicted because buyers realized gains higher than expected.
For the reconciliation market we found no statistically significant differences between prices and quantity transacted, in the two experimental treatments. This result is greatly imposed by our rules for the market, particularly on what concerns quantities. It would not be possible great differences because there was a limit on the number of units that could be traded on the reconciliation market (determined by the random fluctuation resultant from the uncertainty matrix we used).
5. Conclusion
The functioning of a carbon emission permits markets, similar to the EU ETS, with effective abatement uncertainty and several other real world implementation characteristics was analyzed in this paper. Our focus on the EU ETS and its institutional characteristics is justified by the fact of being one of the biggest environmental policy experiments ever. Its dimension, multi- jurisdictional political structure, connection between differing domestic emissions permits programs and innovative character on dealing with greenhouse gases emissions on a big scale justify its status. According to the World Bank Report by Capoor and Ambrosi (2008), in 2007 the EU ETS was still the major carbon market, by far, both on volume and value. Therefore, enormous attention is currently placed on its performance and developments by those who plan to implement a similar policy.
Experimental methodology was used to pursue our goal. As pointed by Smith (1982), it is not possible to design a laboratory experiment about resources allocation without rigorously defining all the institutional rules and details. Although not formalized at the theoretical model describing emission permits markets these are characteristics that matter for its final results.
27 Our experimental design intended to include as many EU ETS characteristics as possible without rendering the experiment too complex. Emission permits initial allocation rule was our experimental variable and we concluded it has no influence on the efficiency of the institution represented. Total abatement cost minimization was achieved in both grandfathering and auctioning treatment. Even with an inefficient allocation of permits rendered by the Ausubel (2004) auction, the secondary market was capable to correctly allocate them at the end. Therefore, our results contribute to the ongoing discussion of proposals in favor of the use of auctions as a rule for the initial allocation method for CO2
emission permits.
However, some differences were signaled in the data collected from sessions of the two treatments. As predicted, fewer transactions are necessary in the secondary market when emission permits are initially auctioned. If transaction costs exist (a characteristic not included in our experimental design), we can say the auctioning option is superior to the grandfathering one.
Banking was higher in the auctioning treatment. This is a result we did not predict and cannot explain but with identifiable consequences: the environmental target becomes endogenous and not exogenous (as it is guaranteed in the grandfathering treatment). A higher level of emissions abatement than the one initially fixed is possible. This connection between banking and auction needs further investigation. Social losses in consequence of this behaviour depend on the accuracy of the environmental target originally imposed by the regulator.
Banking was, in fact, the rule that contributed the less for the efficiency of our EPM. As it is part of any EPM implemented and theoretically recommended as a solution for many market failures, this is a troubling finding. In our experimental design risk neutral/ averse subjects were expected to bank one permit during the whole session. Comparing the classification from the MPL introduced in the beginning of our sessions and banking subjects behaviour we did not find support to that hypothesis. This makes us question whether the adequate incentives were not given, or cognitive limitations or task complexity were the reason for this suboptimal use of banking.
Reality is much more complex than our experimental environment, and several EU ETS characteristics were not included in or experimental design (as the use of options and
28 futures, for instance). However, the high level of efficiency achieved in our experimental EPM, which parallels the EU ETS in many aspects, make us believe our institutional “details” could also be relevant for the success of the European carbon. A more restrictive environmental target for the grandfathering treatment was crucial for our results. And this is something the European Commission already tried to assure when approving the National Allocation Plans for the second phase of the market (2008-2012). On the other hand, restrictions on transactions, as the impossibility of re-sale, are important “details” from our design as largely influence our final results. Instead of being pointed as limitations of our experiments, because they differ from the EU ETS, we believe them to be good policy indications. Regulation in this market is essential to assure the targets are achieved and transactions in the market are not used but to help companies minimize their abatement costs.
References
Ausubel, Lawrence M. (2004), “An Efficient Ascending-Bid Auction for Multiple Objects”, The American Economic Review, Vol. 94, No.5, 1452-175.
Ausubel, Lawrence M., Cramton, Peter (1998), “Demand Reduction and Inefficiency in Multi-Unit Auctions”, University of Maryland, Working Paper, 20 March 1998.
Benz, Eva; Ehrhart, Karl-Martin (2007), “The Initial Allocation of CO2 Emission Allowances: A Theoretical and Experimental Study”, Workshop at Center of Economic Research ETH Zurich, 26-27 February 2007.
Capoor, Karan; Ambrosi, Philippe (2008), “State and Trends of the Carbon Market 2008”, International Emissions Trading Association, The World Bank, Washington DC, May 2008.
Cason, Timothy N.; Elliot, Steven R.; Van Boening, Mark R. (1999), “Speculation in experimental markets for emission permits”, Research in Experimental Economics, Volume 7, (1999) R. M. Isaac and C. Holt (eds.), Stamford, Conn.: JAI Press, 93-119.
COM(2008) 16 final, “Proposal for a DIRECTIVE OF THE EUROPEAN PARLIAMENT AND OF THE COUNCIL amending Directive 2003/87/EC so as to
29 improve and extend the greenhouse gas emission allowance trading system of the Community, Brussels, 23.1.2008
Cronshaw, M. B.; Brown-Kruse, J. (1999), “An experimental analysis of emission permits with banking and the Clean Air Act Amendments of 1990”, Research in Experimental Economics, Volume 7, (1999) R. M. Isaac and C. Holt (eds.), Stamford, Conn.: JAI Press, 1-24.
Dales, J. (1968), Pollution, Property and Prices, University Press, Toronto.
“DIRECTIVE 2003/87/EC OF THE EUROPEAN PARLIAMENT AND OF THE COUNCIL of 13 October 2003 establishing a scheme for greenhouse gas emission allowance trading within the Community and amending Council Directive 96/61/EC” Official Journal of the European Union, L 275/32, 25.10.2003
Engelmann, Dirk; Grimm, Veronika (2004), “Bidding Behavior in Multi-Unit Auctions – An Experimental Investigation and some Theoretical Insights”, Center for Economic Research and Graduate Education - Economic Institute, Prague, Working Paper 210.
Eyckmans, Johan; Cornillie, Jan; Van Regemorter, Denise (2000), “Efficiency and Equity in the EU Burden Sharing Agreement”, CES Katholieke Universiteit Leuven, Working Paper 2000-02, Revised June 2002.
Fernandes, M. Eduarda (2009), “O Mercado de Direitos de Emissão de CO2: Um Estudo Experimental”, unpublished PhD Thesis on Economics, Minho University, Braga, Portugal.
Franciosi, R.; Isaac, R. Mark; Reynolds, Stanley S. (1999), “Experimental research on the EPA’s “two-tier” system for marketable emissions permits”, Research in Experimental Economics, Volume 7, (1999) R. M. Isaac and C. Holt (eds.), Stamford, Conn.: JAI Press, 25-44.
Gangadharan, Lata; Farrel, Alex; Croson, Rachel (2005), “Investment Decisions and Emissions Reductions: Results from Experiments in Emissions Trading”, University of Melbourne, Department of Economics, Research Paper No. 942.
30 Godby, Robert William; Mestelman, Stuart; Muller, R. Andrew; Welland, J. Douglas (1997), "Emissions Trading with Shares and Coupons when Control over Discharges is Uncertain", Journal of Environmental Economics and Management 32, (2), pgs. 359-381. Holt, Charles (2006), “Auctions and Auctioneering: Public Policy Applications”, Regional Greenhouse Gas Initiative (RGGI) Workshop, New York City, July 2006.
Holt, Charles; Laury, Susan K. (2002), “Risk Aversion and Incentive Effects”, The American Economic Review, Vol. 92, No.5, pgs. 1644–1655.
Holt, Charles; Shobe, William; Burtraw, Dallas; Palmer, Karen; Goeree, Jacob (2007), “Auction Design for Selling CO2 Emission Allowances Under the Regional Greenhouse Gas Initiative”, Final Report for RGGI, October 26, 2007.
Kagel, John H., Levin, Dan (2001), “Behavior in Multi-Unit Demand Auctions: Experiments with Uniform Price and Dynamic Vickrey Auctions”, Econometrica 69 (2), 413-454.
Manelli, Alejandro M.; Sefton, Martin; Wilner, Benjamin S. (2006), “Multi-unit auctions: A comparison of static and dynamic mechanisms”, Journal of Economic Behavior & Organization Vol. 61, 304-323.
Mestelman, S.; Moir, Rob; Muller, R.A (1999), “A laboratory test of a Canadian proposal for an emissions trading program”, in Research in Experimental Economics 7, (Emissions Permit Experiments) Charles A. Holt and R.Mark Isaac (editors). Greenwich, Connecticut: JAI Press, 45-91.
Montgomery, D. (1972), “Markets in Licenses and Efficient Pollution Control Programs”, Journal of Economic Theory 5, 395-418.
Smith, Vernon L. (1982), “Microeconomic Systems as an Experimental Science”, The American Economic Review, 923-955.
Vickrey, W. (1961), “Counterspeculation, Auctions, and Competitive Sealed Tenders”, Journal of Finance 16, 8-37.