141
Measurements of the calcaneal tendon in the first year of life
Radiol Bras. 2009 Mai/Jun;42(3):141–144 Original Article • Artigo Original
Measurements of the calcaneal tendon in the first year
of life*
Medidas do tendão do calcâneo no primeiro ano de vida
Ricardo Flávio de Araújo Bezerra1, Dioclécio Campos Júnior2, Vera Lúcia Vilar de Araújo Bezerra2, Augusto Cesar Bittencourt Pires Júnior3, Alexandre Sérgio de Araújo Bezerra4
OBJECTIVE: To determine the thickness and width of the calcaneal tendon (Achilles tendon) in both male and female, eutrophic children at 2, 6, 9 and 12 months of age. MATERIALS AND METHODS: The present prospective and descriptive study included 38 boys and 31 girls. Measurements of the tendons were performed by means of ultrasonography, with a linear, 14-MHz probe, at the level of the medial malleolus. RESULTS: Tendon thicknesses observed in the boys were 2.4 mm, 2.3 mm, 2.4 mm, and 2.4 mm, respectively at 2, 6, 9 and 12 months. Widths were, respectively, 6.0 mm, 6.4 mm, 6.7 mm and 7.1 mm. In the girls, the tendon thicknesses observed at 2, 6 and 9 months were 2.4 mm, and 2.5 mm at 12 months. Widths were, respectively, 5.7 mm, 6.2 mm, 6.5 mm and 6.5 mm. CONCLUSION: No difference was observed in the calcaneal tendon thickness between boys and girls along the first year of their lives; however, width measurements demonstrated differences.
Keywords: Calcaneal tendon; Ultrasonography; Children.
OBJETIVO: Determinar as espessuras e larguras dos tendões do calcâneo (tendão de Aquiles) em crianças eutróficas de ambos os gêneros, aos 2, 6, 9 e 12 meses de idade. MATERIAIS E MÉTODOS: Fizeram parte deste estudo prospectivo e descritivo 38 meninos e 31 meninas. As medidas dos tendões foram obtidas por meio de ultrassonografia, utilizando transdutor linear de 14 MHz, na altura do maléolo medial. RESULTA-DOS: Verificou-se que as espessuras dos tendões nos meninos foram de 2,4 mm, 2,3 mm, 2,4 mm e 2,4 mm, aos 2, 6, 9 e 12 meses, respectivamente. As larguras do tendão do calcâneo foram de 6,0 mm, 6,4 mm, 6,7 mm e 7,1 mm, respectivamente. Nas meninas, as espessuras obtidas aos 2, 6 e 9 meses foram de 2,4 mm, e aos 12 meses encontrou-se o valor de 2,5 mm. As quatro medidas da largura foram de 5,7 mm, 6,2 mm, 6,5 mm e 6,5 mm, respectivamente. CONCLUSÃO: Não houve diferença na espessura do tendão do calcâ-neo ao longo do primeiro ano de vida para ambos os gêneros, entretanto, houve diferença nas medidas da largura.
Unitermos: Tendão do calcâneo; Ultrassonografia; Crianças.
Abstract
Resumo
* Study developed at Hospital Universitário de Brasília (HUB), Brasília, DF, Brazil.
1. Master, Professor of Human Anatomy, Universidade Cató-lica de Brasília (UCB), Brasília, DF, Brazil.
2. PhDs, Titular Professors of Pediatrics, Universidade de Bra-sília (UnB), BraBra-sília, DF, Brazil.
3. MD, Specialist, Radiologist at the Unit of Locomotive Sys-tem Radiology – Hospital Universitário de Brasília (HUB), Brasí-lia, DF, Brazil.
4. PhD, MD, Radiologist, Secretaria de Estado de Saúde do Distrito Federal, Brasília, DF, Brazil.
Mailing address: Dr. Ricardo Flávio de Araújo Bezerra. SHIN QL 2, conjunto 4, casa 5, Lago Norte. Brasília, DF, Brazil, 71510-045. E-mail: [email protected]
Received December 16, 2008. Accepted after revision March 25, 2009.
no myocardial ischemia, independently of age(3). Therefore, it is possible that persons
with relatively thick calcaneal tendons are more susceptible to cardiac ischemia than persons with thinner ones(4). Thus, this is
the relevance of data on measurements of the calcaneal tendon in children, as an early treatment could avoid future complications of this condition.
No study was found in literature with measurements of thickness and width of calcaneal tendons in children up to 12 months of age. Therefore the need to fill in this knowledge gap was the motivating factor leading to the present research.
The objective of this study was to de-termine the thickness and width of the cal-caneal tendons by means of ultrasonogra-phy in both male and female eutrophic
chil-Bezerra RFA, Campos Júnior D, chil-Bezerra VLVA, Pires Júnior ACB, chil-Bezerra ASA. Measurements of the calcaneal tendon in the first year of life. Radiol Bras. 2009;42(3):141–144.
bones – by means of the calcaneal tendon, also called the Achilles tendon. This can be easily palpated and visualized by imaging resources, since it is a superficial struc-ture(1).
A previous study has found significantly thicker calcaneal tendons in children above 3 years of age with a history of familial hypercholesterolemia, than in those in-cluded in a control group(2). According to
the authors, the cause for such thickening was the abnormal development of fat de-posits (xanthomas) in the respective ten-don. Another study developed with adults, has found thicker calcaneal tendons in in-dividuals with familial hypercholester-olemia and myocardial ischemia as com-pared with other individuals also with fa-milial hypercholesterolemia, however with
0100-3984 © Colégio Brasileiro de Radiologia e Diagnóstico por Imagem INTRODUCTION
142
Bezerra RFA et al.
Radiol Bras. 2009 Mai/Jun;42(3):141–144 dren at 2, 6, 9 and 12 months of age, and
define their normality intervals.
MATERIALS AND METHODS
The present study was evaluated by the Committee for Ethics in Research of the author’s Institution and, after approval the guardians of the participating children signed a Term of Free and Informed Con-sent. The sample of the present study in-cluded all the children undergoing follow-up in the Ambulatory of Growth and De-velopment of the Institution. All of them were born in the period between Novem-ber 25, 2005 and July 5, 2006, and partici-pated in the study with their parents’ con-sent. The children, in a total of 88, 44 boys and 44 girls, were followed-up for a one-year period, with measurement of their height and weight at 2, 6, 9 and 12 months of age.
Weight and height were measured at each one of those months. Based on these measurements, the body mass index (BMI) – weight (kg)/height² (m) – was calculated for each of the children. Along the follow-up, some of the children were excluded because of malnutrition or obesity as a re-sult of the BMI calculation. Six boys were excluded: three for malnutrition and three for obesity. Thirteen girls were excluded; six of them for malnutrition, six for obesity and one with both malnutrition and obesity at the different phases of the study. There-fore, 38 boys (76 tendons) and 31 girls (62 tendons) remained in the study group.
In these same periods, the thickness and width of left and right calcaneal tendons were measured by means of ultrasonogra-phy, always by the same radiologist with experience in musculoskeletal ultrasonog-raphy. During the examination, each child was placed in ventral decubitus on an ex-amination table, with both feet suspended. The feet were kept at a 90° angle relative to the legs, in order to facilitate the contact between the probe and the tendon (Figure 1). Cross sectional images were obtained at the level of the medial malleolus, allow-ing the measurement of the thickness and width of the calcaneal tendons. An EnVisor HD unit (Philips; Eindhoven, Holland) coupled with a 14-MHz linear probe was utilized for the measurements.
Sample descriptive data were separately obtained for each gender, and represented by mean and standard deviation. Means and standard deviations were calculated for thickness and width of the calcaneal ten-dons for all of the children at 2, 6, 9, and 12 months of age. An analysis of variance was undertaken in order to verify possible
differences among tendons measurements along the months. Normality intervals for the tendons measurements were delitated utilizing an amplitude of plus or mi-nus two standard deviations from the av-erage measures.
RESULTS
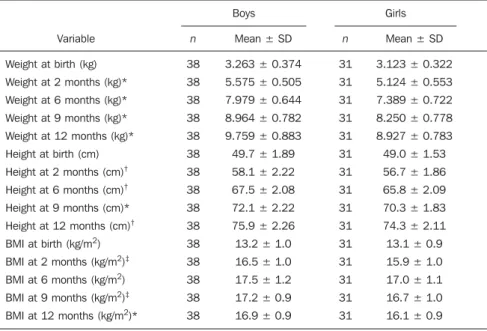
Table 1 presents a comparison between boys and girls measurements for weight, height and BMI. Student’s t-test was uti-lized to evaluate statistically significant differences. Statistically significant differ-ences were found for the weight and height variables at 2, 6, 9 and 12 months, as well as for BMI at 2, 9 and 12 months.
Among the 38 boys (76 tendons) kept in the research, one did not have the calca-neal tendon measurements at 9 months, another one at 9 and 12 months, and a third one at 2, 9, and 12 months. Among the re-maining 31 girls (62 tendons), three did not have the measurements of the tendons taken at 2 months, one at 6 months, another one at 9 months, and two others did not have the measurements taken at 12 months. An eighth girl did not have the tendon measures taken at 9 and 12 months.
Student’s t-test was utilized to evaluate statistically significant differences between the left and right calcaneal tendons thick-ness and width of the same tendons on both
Figure 1. Method for measurement of the calca-neal tendon. The probe is transversely placed at the level of the medial malleolus.
Table 1 Comparison of weight and height measurements and body mass index between boys and girls.
Variable
Weight at birth (kg)
Weight at 2 months (kg)*
Weight at 6 months (kg)*
Weight at 9 months (kg)*
Weight at 12 months (kg)*
Height at birth (cm)
Height at 2 months (cm)†
Height at 6 months (cm)†
Height at 9 months (cm)*
Height at 12 months (cm)†
BMI at birth (kg/m2)
BMI at 2 months (kg/m2)‡
BMI at 6 months (kg/m2)
BMI at 9 months (kg/m2)‡
BMI at 12 months (kg/m2)*
n
38
38
38
38
38
38
38
38
38
38
38
38
38
38
38
Mean ± SD
3.263 ± 0.374
5.575 ± 0.505
7.979 ± 0.644
8.964 ± 0.782
9.759 ± 0.883
49.7 ± 1.89
58.1 ± 2.22
67.5 ± 2.08
72.1 ± 2.22
75.9 ± 2.26
13.2 ± 1.0
16.5 ± 1.0
17.5 ± 1.2
17.2 ± 0.9
16.9 ± 0.9
Boys Girls
n
31
31
31
31
31
31
31
31
31
31
31
31
31
31
31
Mean ± SD
3.123 ± 0.322
5.124 ± 0.553
7.389 ± 0.722
8.250 ± 0.778
8.927 ± 0.783
49.0 ± 1.53
56.7 ± 1.86
65.8 ± 2.09
70.3 ± 1.83
74.3 ± 2.11
13.1 ± 0.9
15.9 ± 1.0
17.0 ± 1.1
16.7 ± 1.0
16.1 ± 0.9
* p < 0.001; † p < 0.01; ‡ p < 0.05. BMI, body mass index; n, number of children; SD, standard deviation.
143
Measurements of the calcaneal tendon in the first year of life
Radiol Bras. 2009 Mai/Jun;42(3):141–144 sides, for both male and female children at all ages studied. There was no statistically significant difference between the thick-ness of left and right tendons for the boys (p = 0.810; 0.610; 0.841 and 0.461 at 2, 6, 9 e 12 months of age, respectively) and neither for the girls (p = 0.282; 0.486; 0.577 and 0.870 at 2, 6, 9 e 12 months of age re-spectively). Also, there was no statistically significant difference between left and right tendons width for the boys (p = 0.071; 0.808; 0.944 and 0.642 at 2, 6, 9 e 12 months of age) and for the girls (p = 0.818; 0.669, 0.517 and 0.653 at 2, 6, 9 and 12 months of age). These results allowed joining the left and right calcaneal tendons into a single tendon sample for each gender and age.
Table 2 presents the measures of the calcaneal tendons for both boys and girls, side by side. Student’s t-test demonstrated a statistically significant difference be-tween genders only for width at 12 months. An analysis of variance was undertaken for determining statistically significant varia-tions of tendon dimensions between boys and girls along the months. No difference
for the variable thickness along the months was observed in the boys. As regards the width, differences were found between means of all four months studied. No dif-ference for the variable thickness along the months was observed in the girls. As re-gards to the width, differences were found between averages from the second to the sixth month and from the sixth to the ninth month. However no statistically significant difference was found between the ninth and the twelfth month. The normality intervals obtained for both boys and girls are shown on Table 3.
DISCUSSION
When measuring the calcaneal tendon of a child and values are higher than the normality intervals, it is possible that there are, for example, xanthomas in this tendon, and that the child presents familial hyper-cholesterolemia(2). If that is the case, a
treat-ment could be immediately started, avoid-ing future problems resultavoid-ing from such condition.
Several previous, cross sectional stud-ies have measured the calcaneal tendons in adults, however without separating data according to gender(5–9). Among the
stud-ies reviewed in the literature, only the study by Mello et al. has been developed in Bra-zil. This cross sectional study, was devel-oped with individuals aged above 20, and presented measurements of tendon width
and thickness for both genders(10). No
record was found in the literature about measurements of calcaneal tendon in chil-dren up to 12 months of age, except for a cross sectional study developed by Bialik et al.(11). However, these authors measured
only the length of the tendons and not the width and thickness. In this sense, the present study innovates, and may contrib-ute to a more comprehensive knowledge of the normal growth standard for the calca-neal tendon.
Bialik et al. have obtained two measure-ments for the length of the calcaneal ten-don (from the muscle-tenten-don junction to insertion into the calcaneus): one with the foot in dorsiflexion, and the other with the foot in plantar flexion. The average age of the children, who were not separated by gender, was 4 months (amplitude from 2 weeks to 12 months). In dorsiflexion, the mean tendon length was 37 mm, and in plantar flexion, the mean tendon length was 30.1 mm. A positive correlation between
age and tendon length(11) was also
ob-served. The study developed by Mello et al. with adults has demonstrated differences in tendon thickness and width between male and female individuals, with higher values for the male group(10). However, data from
the present study demonstrate that during the first year of life there is no statistically significant difference in the mean calcaneal tendon thickness between boys and girls. As regards the tendon width, it increases along the months, with statistically higher values for the boys, only at 12 months.
Brushøj et al. have evaluated the repro-ducibility of measurements obtained by two observers, for the calcaneal tendons, and for the tendons of the tibialis anterior and the flexor hallucis longus muscles in adults. Among these three tendons, the one presenting the smallest interobserver varia-tion was the calcaneal tendon(12). In spite
of such smaller variability in measurements
Table 2 Measures of the calcaneal tendon in both boys and girls.
Variable
Thickness of the tendon at 2 months
Thickness of the tendon at 6 months
Thickness of the tendon at 9 months
Thickness of the tendon at 12 months
Width of the tendon at 2 months
Width of the tendon at 6 months
Width of the tendon at 9 months
Width of the tendon at 12 months*
Boys Girls
n
74
76
70
72
74
76
70
72
Mean ± SD
2.4 ± 0.3
2.3 ± 0.4
2.4 ± 0.4
2.4 ± 0.3
6.0 ± 0.7
6.4 ± 0.9
6.7 ± 0.7
7.1 ± 0.7
n
56
60
58
56
56
60
58
56
Mean ± SD
2.4 ± 0.3
2.4 ± 0.3
2.4 ± 0.3
2.5 ± 0.3
5.7 ± 0.6
6.2 ± 0.7
6.5 ± 0.9
6.5 ± 0.7
Tendon measures in millimeters. * p < 0.001. n, number of tendons evaluated; SD, standard deviation.
Table 3 Normality intervals for the calcaneal tendons for both genders.
Variable
Thickness of the tendon at 2 months
Thickness of the tendon at 6 months
Thickness of the tendon at 9 months
Thickness of the tendon at 12 months
Width of the tendon at 2 months
Width of the tendon at 6 months
Width of the tendon at 9 months
Width of the tendon at 12 months
Minimum
1.8
1.5
1.6
1.8
4.6
4.6
5.3
5.7
Boys Girls
Maximum
3.0
3.1
3.2
3.0
7.4
8.2
8.1
8.5
Minimum
1.8
1.8
1.8
1.9
4.5
4.8
4.7
5.1
Maximum
3.0
3.0
3.0
3.1
6.9
7.6
8.3
7.9
144
Bezerra RFA et al.
Radiol Bras. 2009 Mai/Jun;42(3):141–144 of the calcaneal tendon, in the present study
with children, all the measurements were performed by a single radiologist. In the study by Brushøj et al., the intraobserver reproducibility has been also evaluated. Again, the tendon with smallest variation was the calcaneal. Additionally, according to these authors, small variations in tendon measurements obtained by ultrasonogra-phy may be caused by the pressure applied by the transducer on the tendon surround-ing structures, or by the positionsurround-ing of the transducer at different angles(12). In the
present study, the transducer was always perpendicularly positioned in relation to the calcaneal tendon. Bialik et al. have measured different lengths of the calcaneal tendon, according to the foot positioning in the sagittal plane, that is, in dorsiflexion or plantar flexion(11). This means that small
movements of the foot probably generate small changes in thickness and width of the tendon. In the present study, the foot re-mained perpendicularly positioned in rela-tion to the leg.
The calcaneal tendon measurements may vary because of causes besides the formation of xanthomas, such as trauma or inflammation generally caused by
high-level sport practice(6,13). However,
consid-ering that the present study was performed with infants ≤ 12 months of age, it is un-likely that such factors have played a role in the alteration of tendon dimensions.
As a prospect of future studies, the au-thors envision performing a study with children up to 12 months of age, compar-ing the calcaneal tendon measurements between children with normal cholesterol levels, and children with familial hyperc-holesterolemia. Finally, as a conclusion, the present study demonstrates that in the first year of life the thickness of the calcaneal tendon remains stable for both genders, and that the tendon width increases progres-sively during the first year of life, with normality standards being established in the present study.
REFERENCES
1. Koivunen-Niemelä T, Parkkola K. Anatomy of the Achilles tendon (tendo calcaneus) with respect to tendon thickness measurements. Surg Radiol Anat. 1995;17:263–8.
2. Koivunen-Niemelä T, Viikari J, Niinikoski H, et al. Sonography in the detection of achilles tendon xanthomata in children with familial hypercho-lesterolaemia. Acta Paediatr. 1994;83:1178–81.
3. Mabuchi H, Tatami R, Haba T, et al. Achilles ten-don thickness and ischemic heart disease in
fa-milial hypercholesterolemia. Metabolism. 1978; 27:1672–9.
4. Lehtonen A, Mäkelä P, Viikari J, et al. Achilles tendon thickness in hypercholesterolaemia. Ann Clin Res. 1981;13:39–44.
5. Ebeling T, Farin P, Pyörälä K. Ultrasonography in the detection of Achilles tendon xanthomata in heterozygous familial hypercholesterolemia. Atherosclerosis. 1992;97:217–28.
6. Fornage BD. Achilles tendon: US examination. Radiology. 1986;159:759–64.
7. Mathieson JR, Connell DG, Cooperberg PL, et al. Sonography of the Achilles tendon and adjacent bursae. AJR Am J Roentgenol. 1988;151:127–31.
8. Pang BS, Ying M. Sonographic measurement of achilles tendons in asymptomatic subjects: varia-tion with age, body height, and dominance of ankle. J Ultrasound Med. 2006;25:1291–6. 9. Steinmetz A, Schmitt W, Schuler P, et al.
Ultra-sonography of achilles tendons in primary hyper-cholesterolemia. Comparison with computed to-mography. Atherosclerosis. 1988;74:231–9. 10. Mello RAF, Marchiori E, Santos AASMD, et al.
Avaliação morfométrica do tendão de Aquiles por ultra-sonografia. Radiol Bras. 2006;39:161–5.
11. Bialik V, Farhoud F, Eidelman M, et al. Achilles tendon length in children evaluated sonographic-ally. J Pediatr Orthop B. 2007;16:281–6. 12. Brushøj C, Henriksen BM, Albrecht-Beste E, et
al. Reproducibility of ultrasound and magnetic resonance imaging measurements of tendon size. Acta Radiol. 2006;47:954–9.