Gene expression profiling of gilthead sea bream during early development
and detection of stress-related genes by the application of
cDNA microarray technology
Elena Sarropoulou,1,3Georgios Kotoulas,1Deborah M. Power,2and Robert Geisler3 1Hellenic Center for Marine Research, Institute for Marine Biology and Genetics,
Iraklio, Crete, Greece;2Center for Marine Science, Universidade do Algarve,
Faro, Portugal; and3Max-Planck-Institut fu¨r Entwicklungsbiologie, Tu¨bingen, Germany
Submitted 14 June 2005; accepted in final form 25 July 2005
Sarropoulou, Elena, Georgios Kotoulas, Deborah M. Power, and Robert Geisler. Gene expression profiling of gilthead sea bream during early development and detection of stress-related genes by the application of cDNA microarray technology. Physiol Genomics 23: 182–191, 2005. First published July 26, 2005; doi:10.1152/physiolgenomics.00139.2005.—Large-scale gene ex-pression studies were performed for one of the main European aquaculture species, the gilthead sea bream Sparus auratus L. For this purpose, a cDNA microarray containing 10,176 clones from a cDNA library of mixed embryonic and larval stages was constructed. In addition to its importance for aquaculture, the taxonomic position and the relatively small genome size of sea bream makes it a prospective model for evolutionary biology and comparative genomics. However, so far, no large-scale analysis of gene expression exists for this species. In the present study, gene expression was analyzed in gilthead sea bream during early development, a significant period in the determination of quantitative traits and therefore of considerable interest for aquaculture. Synexpression groups expressed primarily early and late in development were determined and were composed of both known and novel genes. Furthermore, it was possible to identify stress response genes induced by cortisol injections using the cDNA microarray generated. The creation of gene expression profiles for sea bream by microarray hybridization will accelerate identification of candidate genes involved in multifactorial traits and certain regulatory pathways and will also contribute to a better understanding of the genetic background of fish physiology, which may help to improve aquaculture practices.
Sparus auratus; stress response
IN RECENT YEARS, much effort has been invested in developing
genome resources. Continuous improvements in technology have allowed rapid progress in the functional interpretation of sequencing data and the investigation of gene expression. The development of technology in model species has paved the way for high-throughput studies at a molecular level of non-model organisms of evolutionary, environmental, or economic interest.
The gilthead sea bream Sparus auratus is an organism of both economic and evolutionary interest, and it is one of the main European aquaculture species along with the Atlantic salmon (Salmo salar), rainbow trout (Oncorhynkus mykiss), oyster (Crassostrea gigas), and sea bass (Dicentrax labrax). In
addition to a basic understanding of the biology and reproduc-tive physiology of this species, well-characterized culture methodologies for its reproduction and rearing also exist. From an evolutionary viewpoint, the gilthead sea bream is of interest as it belongs to the Perciformes, an order that underwent an explosive radiation 60 million years ago and contains a large number of other teleost taxa.
DNA microarray technology has become one of the signif-icant tools in large-scale gene expression studies. For non-model fish species in which sequence data are not extensively available, only a few large-scale gene expression studies exist. For example, in the goby fish Gillichthys mirabilis, the com-mon carp Cyprinus carpio, and the Atlantic salcom-mon S. salar, large-scale gene expression has been explored, respectively, in response to hypoxia, cold, and bacterial infection (19, 20, 49). Microarrays have also been used to study variation in gene expression within and among populations of the genus
Fundu-lus (43). In contrast, extensive work setting up gene expression
studies for functional analysis has been carried out in model organisms like Drosophila melanogaster (15, 41, 55),
Saccha-romyces cerevisiae (23), the mouse Mus musculus (54), the
frog Xenopus laevis (1), Caenorhabditis elegans (25), and the zebrafish Danio rerio (36, 52).
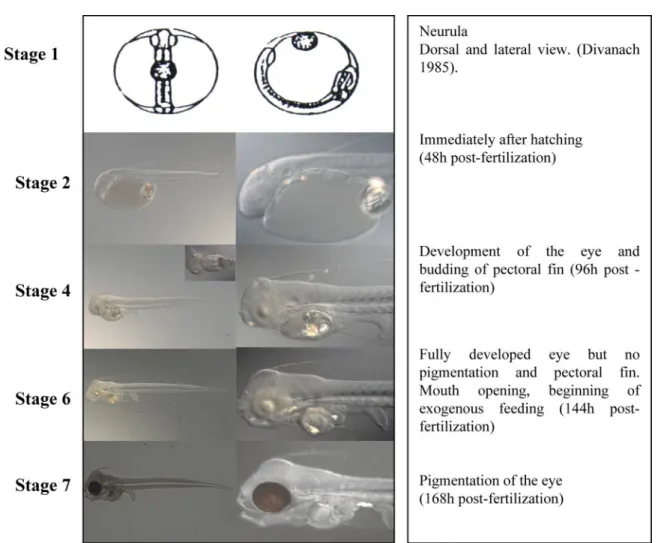
Here, we report the construction and use of a cDNA mi-croarray for the gilthead sea bream containing 10,176 cDNA clones [several thousand of which are estimated to be unique expressed sequence tags (ESTs)], which were obtained from a mixed embryonic/larval cDNA library (51). In addition, we provide insight into the developmental program of sea bream by characterizing gene expression profiles for five independent stages of sea bream development: neurula (stage 1), hatching (stage 2), pectoral budding/eye forming (stage 4), mouth open-ing (stage 6), and eye pigmentation (stage 7). Three main groups of genes were identified by K means clustering. More detailed analysis within each of the three groups led to the definition of expression models of up- or downregulated genes during early development as well as genes up- or downregu-lated before the period of mouth opening. The cDNA microar-ray chip developed was further validated and used to charac-terize the gene expression profile in the kidney of juvenile gilthead sea bream after treatment with cortisol. Identification in the present study of several genes previously reported to be up- or downregulated under stress conditions and during de-velopment in other teleost species as well as in gilthead sea bream corroborated the data set generated.
The results significantly scale up the exploration of the genome of a commercially important species for which
ge-Article published online before print. See web site for date of publication (http://physiolgenomics.physiology.org).
Address for reprint requests and other correspondence: E. Sarropoulou, Hellenic Centre for Marine Research Crete, Thalassocosmos, Former US Base at Gournes, Gournes Pediados, 715 00 Heraklion, Crete, Greece (e-mail: [email protected]).
nome information is scarce and provide first insights into the processes during growth and differentiation of the gilthead sea bream as well as during stress conditions.
MATERIALS AND METHODS
(Note that in microarray experiments, the labeled cDNA to be hybridized is called “target” and the DNA samples spotted on the microarray are called “probes.”)
Microarray Construction
Sample collection. Embryonic and larval stages of gilthead sea bream were collected from the breeding stock of the aquaculture facility at the Department of Aquaculture of the Hellenic Center of Marine Research (Crete, Greece), snap frozen in liquid nitrogen, and stored at ⫺80°C. Kidneys were collected from untreated juvenile gilthead sea bream (n⫽ 4) and from fish (n ⫽ 4) that received for 72 h a coconut oil implant containing 10 mg/kg (fish wet wt) cortisol. Experiments were carried out at the University of the Algarve (Faro, Portugal) in accordance with national legislation for the welfare of animals. Experiments were conducted in two 125-liter cylindriconical tanks supplied with a continuous through flow of oxygenated seawater at 20⫾ 1°C using juvenile gilthead sea bream (25 ⫾ 3 g) adapted for 1 wk to the experimental conditions. One tank contained eight untreated fish (control), and the other tank contained eight cortisol-treated fish. At the end of the experiment, fish were removed from tanks and decapitated, and the kidneys rapidly removed and placed in RNAlater (Qiagen) at⫺20°C. No mortality occurred in the control tank, but two fish died in the cortisol-treated tank.
Bacterial cultures. For microarray production, a cDNA library of mixed embryos/larvae of gilthead sea bream (51) was used. Colonies were obtained by mass excision using the Lambda UNI-ZAP XR cloning Kit (Stratagene; La Jolla, USA) following the manufacturer’s instructions and were plated onto a 24⫻ 30-cm agar plate using 3-m glass beads (Sigma-Aldrich; Munich, Germany). The colonies were picked into 384-square well plates filled with 95 l of Hogness medium and grown overnight at 37°C without being shaked. A total of 10,176 clones was arrayed in 384-square well plates using the BioPick robotic system (BioRobotics; Cambridge, UK). Clones ar-rayed in 384-well plates were used to inoculate 4 ⫻ 96-deep well plates filled with 2 ml TY and 50g/ml kanamycin. They were grown overnight at 37°C with shaking and used for PCRs.
Culture PCR. The total volume of one PCR was 50 l and contained 43.5l of reaction mix (2 l of 10⫻ PCR buffer; 0.04 l of 100 mM of each dATP, dCTP, dGTP, and dTTP; and 12.12 l distilled H2O), 1.5l of T7, 1.5 l of T3 primer (20 M), 1 l of Taq polymerase (5 U/l), and 2.5 l of bacterial culture. The thermocycle utilized was 94°C for 1 min 20 s, followed by 35 cycles of 94°C for 1 min, 50°C for 1 min, 72°C for 1 min 30 s, and a final step of 72°C for 5 min. PCRs were performed in duplicate to decrease the failure rate of reactions; duplicates were pooled, separated by agarose gel (2%) electrophoresis, and visualized by transillumination in the pres-ence of ethidium bromide to check the insert size. Purification of PCR products was performed using the GFX-96 PCR Purification Kit (Amersham Pharmacia) according to the manufacturer’s instructions. In brief, 300l of binding buffer were added to the PCR products, mixed thoroughly, and transferred to the wells of the GFX-96 plate. The assembled plates were centrifuged at 1,800 g for 2 min, the liquid in the wash plate discarded, and the GFX-96 plate was reassembled on the top of the same wash plate. A second wash was conducted by adding 400l of wash buffer to each well of the GFX-96 plate and centrifuging for 5 min at 1,800 g; wash liquid was then discarded, and the GFX-96 plate was centrifuged for a further 30 s at 1,800 g to remove the remaining wash buffer. To recover the PCR products, the GFX-96 plate was assembled on the top of the sample collection plate, 50l of elution buffer were pipetted into the center of each well, and
samples were incubated for 1 min and centrifuged at 1,800 g for 2 min. The purified products were dried under vacuum, reeluted in 3⫻ SSC and 1.5 M betaine to a volume of 10l, and transferred back to 384-well plates.
Spotting. Three rounds of spotting were performed: one round of 192 spots to test hybridization and spotting conditions, one round of 3,456 cDNA clones spotted in duplicate, and finally a third round of 10,176 cDNA clones again spotted in duplicate.
Test slides were spotted with the Affymetrix 417 Arrayer config-ured with 12 pins and rings. The final spotting was performed with the OmniGrid 100 robotic system (San Carlos, CA) configured with 48 pins (TeleChem SMP3; Sunnyvale, CA).
In total, 100 GAPII glass slides were spotted, with each glass slide contained 10,176 PCR-amplified inserts of the clones picked from the embryonic/larval cDNA library. The amplified cDNA products were spotted randomly and in duplicate in two separate subarrays, such that duplicate probe spots were not in the same quadrant but the next but one. As a control for hybridization and background, only buffer was spotted at the end of each spotting group. The spotted glass slides were baked at 80°C for 2 h to cross-link the DNA onto the glass slide. The slides were then incubated in blocking buffer at 50°C for 30 min, washed twice with Milli-Q water at room temperature for 2 min, and dried by spinning in an Eppendorf 5810R centrifuge for 7 min at 800 rpm.
Data Acquisition
RNA extraction. Total RNA was extracted from five larval stages (neurula, newly hatched, pectoral budding, open mouth, and eye pigmentation stages) and also from cortisol-treated and untreated juvenile gilthead sea bream kidneys using the mini-RNAeasy extrac-tion kit (Qiagen). The quality of the total RNA obtained was checked by gel electrophoresis on a 1% agarose gel containing 0.05% ethidium bromide (10 mg/ml), and the concentration was determined by spectrophotometry.
Labeling. Ten micrograms of intact total RNA were indirectly labeled following the TIGR protocol (http://www.tigr.org/tdb/ microarray/protocolsTIGR.shtml) with the red fluorescent dye ester cyanine 5 (Cy5) and green fluorescent dye ester cyanine 3 (Cy3) (Amersham Pharmacia). In brief, cDNA was synthesized by incorpo-rating aminoallyl dUTP (AA-dUTP). Synthesis took place at 42°C for 3 h. RNA was hydrolyzed with 10l of 1 M NaOH and 10 l of 0.5 M EDTA for 15 min at 65°C and neutralized by adding 10l of 1 M HCl. To remove unincorporated AA-dUTP and free amines, the reactions were purified with Qiagen columns using phosphate wash buffer and phosphate elution buffer. The purified sample was dried in a Speed Vac. AA-cDNA was resuspended in 0.1 M sodium carbonate buffer, and coupling to the Cy dye ester was performed for 1 h in the dark at room temperature. The removal of uncoupled dye was per-formed using the Qiagen PCR Purification Kit. Finally, samples were tested for successful dye ester incorporation by spectrophotometry. The labeling was considered successful when total dye incorporation was over 200 pmol and the ratio of nucleotides to dye molecules was⬍50. Hybridization. The two targets (Cy3 and Cy5 labeled) were mixed, and the volume was increased to 500l with 1⫻ Tris-EDTA buffer (TE). The mixture was applied to a microcon 30 spin filter column and centrifuged for 13 min at 8,000 rpm to reduce the target volume to 15 l. To the target DNA, 2 l of 10 mg/ml herring sperm DNA were added, and the volume was increased to 15l with 1⫻ TE. The target was denatured for 2 min at 95°C, incubated on ice for 1 min, and finally left at room temperature for 5 min. An equal volume (15l) of hybridization buffer was added to the target; the solution was vor-texed, spun down, and carefully pipetted onto a coverslip; and the microarray was inverted and placed in a hybridization chamber containing a prewetted Whatman paper strip. Hybridization took place overnight in a water bath at 42°C.
Washing. After hybridization, the chip was carefully taken out of the chamber, and the coverslip was removed by immersion in 4⫻ SSC. The chip was then washed for 5 min in wash buffer 1 (2⫻ SSC, 0.1% SDS, and Milli-Q water), 5 min in wash buffer 2 (0.1⫻ SSC, 0.1% SDS, and Milli-Q water), and twice for 2.5 min in wash buffer 3 (0.1⫻ SSC and Milli-Q water). All washing steps were carried out at room temperature with vigorous shaking. Finally, the slides were quickly dipped in 0.05⫻ SSC and in Milli-Q water. Drying of the slides was performed by centrifugation at 1,000 g for 12 min in a 50-ml Falcon tube at room temperature. All the above steps were performed in the dark.
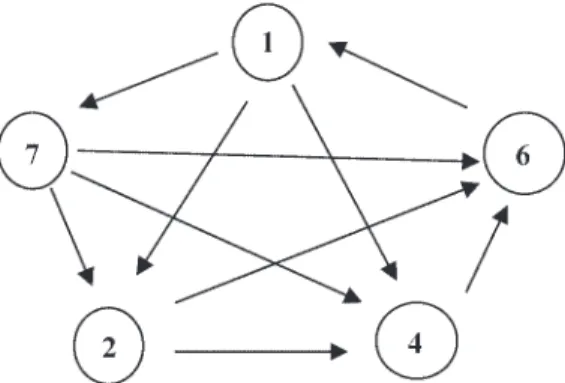
Data processing and analysis. Microarray gene expression data for embryonic and larval stages were obtained by comparing the results of each stage with each other using a loop design (Fig. 1). All experi-ments were performed by dye swap hybridizations of the sea bream cDNA microarray chip. Taking into account all possible combina-tions, 20 hybridizations were performed in total within this experi-mental setup.
For the study of treated versus untreated kidneys, a total of four hybridizations was performed. The labeling of total RNA from the kidney was performed using a sample from one individual.
For each cDNA microarray chip, two series of digital images were produced by dual laser scanning with a GMS 418 Array Scanner (MWG). The first series was obtained by illuminating the array at 635 nm (excitation of Cy5), and the second series was obtained by illuminating the array at 532 nm (Cy3). For both illuminations, three to four different settings of the photomultiplier tube (gain and light amplification) and two settings (90% and 100%) of the laser power were used. All images were captured in TIFF format.
Spot finding, image segmentation, and quantification was carried out with ImaGene 5.0 microarray image analysis software (BioDis-covery; Los Angeles, CA). Briefly, a grid was created taking into account the number of spots, the print pattern, and the size of the spots. Spot finding was performed using a semiautomatic method in which each spot is checked for proper alignment within the grid manually, as this gives more accurate data collection than fully automatic methods. Finally, spot quantification was performed to obtain the expression level of each gene deposited on the array. For downstream analysis, Cy3 and Cy5 scans were chosen according to the distribution of the Cy3-to-Cy5 ratio after spot quantification (ImaGene 5.0 software package). A ratio of around 1 is expected because the majority of genes do not change expression.
Data set preparation and quality control. The quantified data were analyzed using the software program GeneSight lite included within the ImaGene 5.0 software package. For each data set, the background was subtracted, and poor, empty, or negative spots (see the ImaGene
5.0 manual) were flagged as unreliable and were excluded from downstream analysis. For each data set, the ratio was calculated and normalization was performed using the z transform logarithm of GeneSight lite. The normalized data were stored in a relational database using FileMaker Pro5 software (FileMaker; Santa Clara, CA). Genes selected as being differentially regulated were those in which the ratio of experiment to control was at least 2 away from the mean value obtained.
The correlation of measurements was determined using the results for duplicate spots on the array.
Raw and normalized data were submitted to ArrayExpress, a public repository for microarray gene expression data at the European Bioin-formatics Institue (experiment: E-MEXP-181, array: A-MEXP-110), as well as to the National Center for Biotechnology Information (NCBI) Omnibus under Accession Nos. GSE 2064 and GSE 1887; all clones are available on request. All sequence data have been submit-ted to the NCBI EST database (Accession Nos. CB184056 – CB184594 and CV133223–CV133736).
Analysis. Normalized data were further analyzed using K means clustering and univariate analysis with the statistical software package SSPS 12.0 (SPSS; Chicago, IL).
The K means clustering method is the most appropriate clustering method when analyzing populations of more than 200 data points and was used to group all data points obtained setting cluster numbers from 2 to 5. Distances were computed using simple Euclidean dis-tance. The cluster-cluster distance was calculated by determining the distance between centroids. Expression patterns of genes over the course of the developmental stages were obtained by univariate analysis using the statistical package SPSS.
RESULTS
Microarray Construction
As a first approach toward gene expression studies in sea bream, a cDNA microarray of an embryonic/larval cDNA library was constructed. First, preliminary cDNA microarrays were constructed with 192 cDNA clones spotted 5 times each (data not shown); a second round of test slides containing 3,392 cDNA clones was also prepared. These slides were used to establish and validate the microarray generated. Probes containing zebrafish PCR products of distalless (dlx3) and genomic sea bream DNA were included as controls. Hybrid-izations were carried out with the following targets: 1) labeled 50-mer oligonucleotides designed from previously sequenced gilthead sea bream clones, 2) labeled PCR products of gilthead sea bream dlx3, 3) gilthead sea bream ribosomal protein L13a,
4) zebrafish nacre, 5) zebrafish dlx3, and 6) labeled total RNA
extracted from two different larval gilthead sea bream stages. The zebrafish targets hybridized only with the spotted probes from zebrafish, indicating the stringency of the hybridization conditions utilized. Cross-hybridization between gilthead sea bream cDNA probes and the zebrafish target was not observed. On the basis of these preliminary tests, a final cDNA microar-ray containing a total of 10,176 cDNAs was printed in dupli-cate onto aminosilane-coated slides from Corning. Of the 10,176 spotted cDNA clones, 768 had previously been se-quenced (51). It is expected that several thousand different cDNA clones are represented on the chip, as around 75% of the previously sequenced clones were unique. The correlation, determined before normalization, between duplicate spots used for downstream analysis in each hybridization subsequently was found on average to be 85%. The quality of the array was indicated by the high R2 values obtained after univariate
Fig. 1. Experimental design of the microarray experiment in this study (direct or loop design). Five different developmental stages, neurula (stage 1), hatching (48 h postfertilization; stage 2), pectoral fin budding (96 h postfer-tilization; stage 4), mouth opening (144 h postferpostfer-tilization; stage 6), and eye pigmentation (168 h postfertilization; stage 7), were compared directly with each other in all possible combinations.
analysis of genes represented more than once in the array (e.g., Fig. 6B) and by the comparable expression results of known genes in the present study and previously published studies.
Isolation of Candidate Genes Involved in Development
To obtain an overview of genes involved in sea bream development, targets were chosen that represented five time points covering different developmental events from neurula through to pigmentation of the eye (Fig. 2). A group of cDNA clones out of each hybridization, for which z scores of xⱕ ⫺2 or xⱖ 2 were detected, were picked, sequenced, and analyzed using BLASTN and BLASTX searches against the NCBI nr database. Sequence alignments resulting from the BLASTN search against the nr database were examined, and a sequence identity of ⬎65% over a minimum range of 80 bp and an E value of⬍10⫺5were chosen as the criteria for designation of putative gene identity (cf. Supplement A; available at the
Physiological Genomics web site).1When the minimum align-ment was ⬍80 bp, BLASTX analysis was also performed to confirm the BLASTN result. Some cDNA clones with a low BLASTN e value and no hit in BLASTX were also selected as
they shared a similar expression pattern, also showing the quality of the hybridizations [e.g., E33D_A08, SA-E42D_C10, SA-E60B_A11, and SA-E60C_B11 (all clones assigned to bj AU301079.1 C. carpio cDNA clone: 3-033, expressed in barbel)]. Subsequent sequence analysis revealed that the four cDNA clones encoded the same gene, and, in BLASTX, the assembled sequence shared sequence similarity with lipocalin-type prostaglandin D synthase-like protein (D.
rerio). The above procedure was performed for all clones with
a low e value and a similar expression pattern which by BLASTN were assigned to a specific clone.
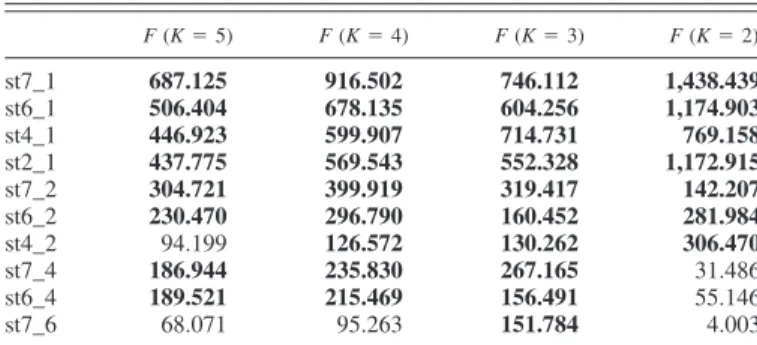
Frequently used methods for grouping genes by their ex-pression patterns over the experimental variables are hierarchi-cal clustering and K means clustering. In this study, K means clustering was performed on the data points obtained after z score normalization, as this is more suitable for analyzing populations of more than 200 genes (21). Clustering of all sequenced clones on the chip [clones already known from Sarropoulou et al. (51) and clones selected by z score values] before the selection step by microarray hybridization revealed the largest F values throughout the 10 experiments when the cluster number was set to 3, indicating the greatest separation between clusters (Fig. 3) (SPSS). When only genes showing significant differential expression using the z transform method in at least 1 of the 10 experiments were taken into 1The Supplemental Material for this article (Supplements A and B) is
available online at http://physiolgenomics.physiology.org/cgi/content/full/
00139.2005/DC1.
account, K means cluster analysis again revealed the largest
F values when the cluster number was set to 3 (Table 1 and
Fig. 3).
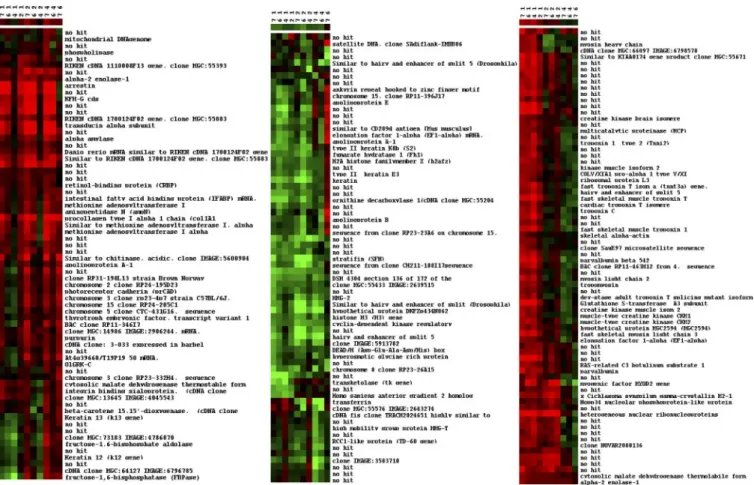
The three clusters represent, respectively, genes that are mainly expressed early in development, genes mainly ex-pressed in later developmental stages, and genes showing differential regulation in the middle of the stages selected for hybridization. Expression profiles were visualized using the software TreeView (12), which plots the experiments on the
x-axis and the differentially expressed genes on the y-axis. The
colors displayed indicate whether the gene is up- or downregu-lated. In this study, as shown in Fig. 4, the green color indicates that genes are downregulated in the later developmental stages considered and upregulated in the earlier developmental stages.
Isolation of Candidate Genes Involved in Stress Responses
Microarray experiments were performed with kidneys of cortisol-injected fish versus control fish to identify known and novel genes potentially involved in the stress response induced by increased circulating cortisol levels. These experiments revealed 257 significantly regulated genes, including several genes related to carbohydrate metabolism as well as genes involved in Na⫹/K⫹ transport, polyamine biosynthesis, and iron homeostasis. In total, 206 clones were sequenced, and 35% did not show a significant BLAST hit (Supplement B). DISCUSSION
In the present study, insight into the developmental program of the gilthead sea bream is established by the construction and
application of a cDNA microarray from embryos and larvae of the gilthead sea bream. Furthermore, this platform was also validated for use in studies of the stress response in gilthead sea bream.
To identify genes involved in the development of sea bream, five different developmental stages (neurula, hatching, pectoral budding/eye development, mouth opening, and eye pigmenta-tion) were chosen for the first round of experiments. Microar-ray studies providing specific gene expression patterns have been widely used to isolate genes and as a sensitive indicator of gene function (for a review, see Ref. 57). Most of the microarray experiments use an indirect design (also called reference design) as it has the advantage of allowing easy analysis and interpretation without the need for extensive statistical tools. However, if subtle variations between the experiments are of interest, then a design with direct compar-ison (also called a balanced or loop design) is preferable (56) as it allows comparison of experiments with much greater precision (26, 27). In the present study, a direct experimental design (Fig. 1) for the five different developmental stages of the gilthead sea bream (Fig. 2) were used. To corroborate microarray data, it is desirable to confirm the specificity of a microarray chip as well as the hybridization and analysis method used by analyzing the expression profiles of known genes (50). In this context, several approaches were taken, including comparison of expression profiles with previous studies in other fish species and comparison from a functional genomics viewpoint of the results for developmental stages with those of cortisol-injected fish as well as specific functional studies of genes found in the literature. As expected, genes encoding the translation machinery (according to the gene ontology classification of cellular components) were only scantily represented among the significantly regulated genes in the experiment, which is in direct contrast to results previously obtained with an EST-based study of the same library (51). Similar microarray experiments performed for developmental stages of zebrafish (36, 52, 53) indicated the increased expres-sion of genes involved in myogenesis at the 24-h stage, corresponding to the period of pharyngula, and the 72-h stage, corresponding to the hatching period. These results are con-gruent with the present results in which there is an upregulation of genes encoding myogenic proteins at stage 2, when hatching occurs (Fig. 5). The results obtained from our stress response
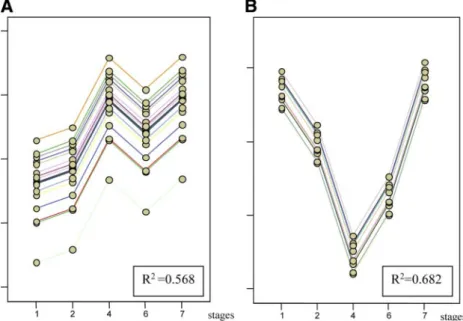
Fig. 3. Canonical discrimination functions. A and B: clustering of all sequenced clones (A) and clustering of clones with differential ex-pression identified via a z score of xⱕ ⫺2 or
xⱖ 2 by the K means method (B). The data
points given (cases 1–3) were grouped in three main clusters (colored blue, green, and gray, respectively). The group centroid repre-sents the average value of the cases contained in each cluster.
Table 1. F values of K means clustering setting K to 2–5
F (K⫽ 5) F (K⫽ 4) F (K⫽ 3) F (K⫽ 2) st7_1 687.125 916.502 746.112 1,438.439 st6_1 506.404 678.135 604.256 1,174.903 st4_1 446.923 599.907 714.731 769.158 st2_1 437.775 569.543 552.328 1,172.915 st7_2 304.721 399.919 319.417 142.207 st6_2 230.470 296.790 160.452 281.984 st4_2 94.199 126.572 130.262 306.470 st7_4 186.944 235.830 267.165 31.486 st6_4 189.521 215.469 156.491 55.146 st7_6 68.071 95.263 151.784 4.003
hybridizations (discussed further below) also corroborate the microarray data for developmental stages. In addition, biblio-graphic corroboration of the data obtained in this study was also found, e.g., a gene belonging to the enolase superfamily was upregulated in the stress microarray study, as reported in a previous study (48) of ␣-enolase expression under stress conditions. Furthermore, as a nonnormalized cDNA library was spotted, several genes were represented as multiple dupli-cates on the same chip, and the results showed good reproduc-ibility of the up- or downregulation of specific genes after clustering and applying statistical analysis by univariate anal-ysis of variance (21).
Cluster Analysis
Cluster analysis revealed three main groups of genes with stage-specific expression. Cluster 1 contains genes showing upregulation in the last two stages as well as genes showing upregulation in stage 4, with a sustained high level of expres-sion in the later stages. Among the genes showing upregulation in the last two stages, stage 6 (mouth opening) and stage 7 (eye pigmentation), many candidate genes for visual pigmentation were found, which is in line with phenotypic observations of eye pigmentation [168 hours postfertilization (hpf) (Fig. 6)]. In contrast, many of the genes that are found to be upregulated in
Fig. 4. Heat map images showing the genes grouped by the K means clustering method in cluster 1 (genes expressed mainly in the middle and later ones of the selected developmental stages), cluster 2 (genes expressed mainly in the early ones of the selected developmental stages), and cluster 3 (genes up- or downregulated transitorily in the middle of the selected developmental stages). Stages are indicated above each column. Gene expression is shown in rows. The quantitative changes in gene expression are represented in color: red indicates upregulation in the later stage, whereas green indicates upregulation in the earlier stage of the hybridization experiment.
Fig. 5. Genes involved in myogenesis, showing upregulation at stage 2, when the larva has just hatched. On the x-axis, the stages are plotted, and, on the
y-axis, the estimated marginal means are plotted. The univariate analysis of
variance for randomized design uses the criterion of the multiple R2statistics
measure. If all the independent variables fit on the regression line, then R2is
stage 4 encode metabolic enzymes, studies of which are of
special interest for fish physiology and aquaculture.
In fish larvae, nutrients are initially supplied only by the yolk reserve, although at mouth opening and the onset of exogenous feeding nutriments are absorbed across the rudimentary diges-tive tract. A major problem for aquaculture is the low accep-tance of artificial diets by larval fish. Large variations in ingestion rates are observed in feeding experiments, and, in some cases, first-feeding marine fish larvae ingest artificial feed but fail to grow. Advances in this area have produced better results (9, 13, 29, 31, 34), but, in most species, problems arising from the use of formulated feeds at the onset of exogenous feeding still persist. The larvae of gilthead sea bream hatch from pelagic eggs, and full development of the digestive system only occurs at metamorphosis (40). Determi-nation of the onset of enzyme production is therefore essential
for choosing appropriate larval diets and establishing the ear-liest possible time for weaning.
In the present study, many genes encoding metabolic en-zymes including amylase are upregulated before mouth open-ing, namely, in stage 4 (Fig. 7), which corresponds to 4 days posthatched. At this time, the pectoral fin is budding and the eye is beginning to form. Studies of the amylase gene in the winter flounder Pleuronectes americanus show that the onset of amylase expression is at a similar stage, 5 days posthatched (10). Interestingly, in the present study, both fructose-1,6-bisphosphatase and fructose-1,6-aldolase B, enzymes involved in gluconeogenesis, are downregulated at stage 4, just when amylase is upregulated (Fig. 7). This may indicate a concerted switch from gluconeogenesis, when nutrients come from yolk lipids, to the glycolytic pathway as soon as exogenous carbo-hydrates become available. Although amylase activity in D.
Fig. 6. A: expression of genes upregulated early in devel-opment. B: genes upregulated at stages 6 and 7, encoding proteins involved in eye pigmentation. On the x-axis, the stages are plotted, and, on the y-axis, the estimated marginal means are plotted. The univariate analysis of variance for randomized design uses the criterion of the multiple R2
statistics measure. This is the square of the correlation between the dependent and independent variables. If all the independent variables fit on the regression line, then R2is
⬎0.5.
Fig. 7. A: genes encoding enzymes with an expression peak at stage 4. B: expression profile of two of the key enzymes involved in the production of glucose, fructose-1,6-bisphos-phatase and fructose-1,6-bisphosphate aldolase B (data from 8 and 4 measurements, respectively). On the x-axis, the stages are plotted, and, on the y-axis, the estimated marginal means are plotted. The univariate analysis of variance for randomized design uses the criterion of the multiple R2
statistics measure. This is the square of the correlation between the dependent and independent variables. If all the independent variables fit on the regression line, then R2is
melanogaster is repressed by glucose and induced by starch (7,
24), the expression changes observed in this study must be developmentally controlled as they occur before the onset of exogenous feeding at stage 6. Isolation and expression profil-ing of further genes encodprofil-ing digestive enzymes throughout development, and, in particular, peptidases, will generate knowledge about the metabolic capabilities of different larval stages and contribute to the development of suitable diets. Furthermore, microarray analysis of feeding experiments should help to clarify the role played by inductive processes during the development of the digestive system and help to monitor the acceptance of artificial food to larval fish.
Cluster 2 contains genes that are downregulated in the later
stages. Compared with the other clusters, genes encoding proteins involved in epithelial development were more abun-dant (Fig. 6). Among them are proteins of the largest subfamily of intermediate filament proteins, type I and type II keratins. Heterodimers of type I and type II keratins act as the main meshwork for the keratin cytoskeleton.
Cluster 3 (Figs. 4 and 5) contains genes transiently
upregu-lated around the time of hatching (stage 2). A comparison of
cluster 3 to clusters 1 and 2 revealed a greater number of genes
involved in myogenesis, such as myosin light chain 2 and 3, myosin heavy chain, and tropomyosin, which were also re-ported to be upregulated during the hatching period in expres-sion profiling studies of zebrafish (36, 52).
Expression of these genes coincides with the period in which abnormalities in intensively reared sea bream become evident. Moreover, it has been shown that abnormalities, such as opercular deficiency (8), morphological deformities (2, 30), and failure to form a functional swimbladder (28, 45), are to a large extent responsible for reduced growth and a higher mortality rate (46). Identification and further study of genes expressed during this period in healthy and abnormal larvae may help to improve the performance of subsequent rearing stages.
Isolation of Genes Exposed to Stress Conditions
Fish in aquaculture are frequently exposed to a range of stressors. Stress can be induced by overcrowding, inappropri-ate culture temperatures, overfeeding, poor winappropri-ater quality, and exposure to toxicants (22). Under stress conditions, fish are more susceptible to infection, e.g., by Streptococcus iniae (14), and to other diseases. Stress increases the metabolic rate and oxygen uptake in fish (6), and serum cortisol is elevated. The rise in cortisol associated with stress is responsible for activa-tion of the central nervous system, increasing blood glucose concentration and elevating mean blood pressure, all of which contribute to coping with stress (6, 44). Corticosteroids, in addition to their influence on gluconeogenesis and glycolysis, also affect the activity of enzymes involved in metabolic regulation (for a review, see Ref. 38), influence osmoregulation (33), and induce profound immunosupression (6).
In the present study, the administration of cortisol was used to simulate stress, and it was possible to establish for the first time in gilthead sea bream the transcriptional response in the kidney. Among the genes upregulated in this study are several genes involved in gluconeogenesis, glycolysis, and the respi-ratory chain, including fructose-1,6-bisphoshatase, fructose 1,6-bisphosphate aldolase B, and ␣2-enolase-1. This is in
agreement with previous findings showing that fructose-1,6-bisphoshatase activity is upregulated in carp treated with cor-tisol (11) and that␣-enolase of G. mirabilis as well as ␣-eno-lase of gilthead sea bream is upregulated under stress condi-tions (18, 48). Genes encoding proteins involved in Na⫹/K⫹ transport were also found to be upregulated, which is in concordance with studies showing that cortisol stimulates branchial Na⫹-K⫹-ATPase activity, an enzyme crucial for osmoregulation (37).
A number of genes encoding proteins of interest were found to be up- or downregulated under stress conditions in the present study. One such transcript encodes ornithine decarbox-ylase (ODC), a key enzyme of polyamine biosynthesis that is elevated in rapidly proliferating cells. Overexpression of ODC has been associated with carcinogenesis in mammals (4, 39). ODC is also a marker of liver neoplasia in winter flounder (P.
americanus) (32), and its upregulation in stressed gilthead sea
bream may cause a predisposition to tumors, an issue of some importance for aquaculture. Interestingly, two of the main proteins in iron metabolism, ferritin heavy and light subunit and the transferrin receptor, were downregulated by cortisol. Oxidative stress and iron metabolism are interrelated in mul-tiple ways. Ferritin is an intracellular molecule that stores iron in a soluble nontoxic form and was found to be induced in response to hypoxia in a gene expression profiling study in G.
mirabilis (18) and repressed in response to quinone-induced
oxidative stress in a study of murine B6 fibroblasts (17). The transferrin receptor is an iron transport protein that was like-wise found to be repressed in murine fibroblasts in response to oxidative stress (17). Because it is known that intracellular iron can be a rate-limiting factor for cell growth and proliferation (35), a downregulation of intracellular iron levels may be associated with the suppression of growth observed under stress conditions. Furthermore, elevated levels of transferrin receptor were found in Atlantic salmon macrophages activated by infection with Piscirickettsia salmonis (49), suggesting that its downregulation could contribute to immunosuppression. In humans, transferrin is used as a clinical marker as its concen-tration level correlates with the total mass of immature ery-throid cells (47). Potentially, it could also be employed as a diagnostic marker in aquaculture. For this purpose, it will be important to determine whether the decrease of the transferrin receptor seen during stress primarily reflects a decrease in the number of hematopoietic cells or a lowering of intracellular iron levels.
Another area to be explored in future work is the use of whole fry as an effective sample of stress response as well as the effect of stress on specific developmental stages of sea bream as several stress-responding genes isolated in this study were also found to be regulated during development.
In conclusion, the present study provides a first glimpse of how the global analysis of gene expression, using material from appropriately chosen conditions or tissues as a target, can yield insight into the molecular basis of development and stress in aquaculture species. The data set presented here will be a basis for future expression profiling work in this area. It has been proposed that genes with similar biological function constitute synexpression groups with coordinated expression throughout development (16, 41), an expectation that is borne out by our clustering studies, e.g., of proteins encoding for epithelial tissue. This opens up the possibility of focusing
sequencing efforts on unknown genes with expression profiles similar to known genes of interest to identify new genes that have similar functions. Such a strategy will enrich genomic resources for the gilthead sea bream in a more efficient way than random sequencing of ESTs could and promises to pro-vide specific candidate genes for quantitative trait loci analysis and marker-assisted selection. The identification of candidate genes is of particular importance for marine fish species in which only very little information about the genetic source of phenotypic variation exists, in contrast to other agricultural animals. Finally, expression profiling will facilitate studies of comparative physiology and comparative genomics beyond the traditional model species, possibly yielding new insights into the evolution of animal physiology (19).
ACKNOWLEDGMENTS
We thank Dr. M. Pankratz and lab for providing the microarray spotting facilities and Dr. C. Seiler for support in generating pictures of the develop-mental stages of sea bream.
Sequences reported in this article have been submitted to the National Center for Biotechnology Information (NCBI) EST database under Accession Nos. CB184056 –CB184594 and CV133223–CV133736. Microarray expres-sion data have been submitted to ARRAYExpress under Accesexpres-sion Nos. E-MEXP-181 (experiment) and A-MEXP-110 (array) as well as to the NCBI Omnibus under Accession Nos. GSE 2064 and GSE 1887.
GRANTS
This study was funded by the BRIDGEMAP-project (EU Contract Q5R-2001-01797) as part of the European Commission’s Fifth Framework Pro-gramme “Quality of Life and Management of Living Resources.”
REFERENCES
1. Altmann CR, Bell E, Sczyrba A, Pun J, Bekiranov S, Gaasterland T,
and Brivanlou AH. Microarray-based analysis of early development in
Xenopus laevis. Dev Biol 236: 64 –75, 2001.
2. Andrades JA, Becerra J, and Fernandez-Llebrez P. Skeletal deformi-ties in larval, juvenile and adult stages of cultured gilthead sea bream (Sparus aurata). Aquaculture 141: 1–11, 1995.
3. Ashburner M, Ball CA, Blake JA, Botstein D, Butler H, Cherry JM,
Davis AP, Dolinski K, Dwight SS, Eppig JT, Harris MA, Hill DP, Issel-Tarver L, Kasarskis A, Lewis S, Matese JC, Richardson JE, Ringwald M, Rubin GM, and Sherlock G. Gene ontology: tool for the
unification of biology. The Gene Ontology Consortium. Nat Genet 25: 25–29, 2000.
4. Auvinen M, Paasinen A, Andersson LC, and Holtta E. Ornithine decarboxylase activity is critical for cell transformation. Nature 360: 355–358, 1992.
5. Bamberger CM, Schulte HM, and Chrousos GP. Molecular determi-nants of glucocorticoid receptor function and tissue sensitivity to glucocor-ticoids. Endocr Rev 17: 245–261, 1996.
6. Barton BA, Schreck CB, and Barton LD, and Baanante IV. Effects of chronic cortisol administration and daily acute stress on growth, physio-logical conditions, and stress responses in juvenile rainbow trout. Dis
Aquat Org 2: 173–185, 1987.
7. Benkel BF and Hickey DA. Glucose repression of amylase gene expres-sion in Drosophila melanogaster. Genetics 114: 943–954, 1986. 8. Beraldo P, Pinosa M, Tibaldi E, and Canavese B. Abnormalities of the
operculum in gilthead sea bream (Sparus aurata): morphological descrip-tion. Aquaculture 220: 89 –99, 2003.
9. Cahu CL and Zambonino Infante JL. Substitution of live food by formulated diets in marine fish larvae. Aquaculture 200: 161–180, 2001. 10. Douglas SE, Mandla S, and Gallant JW. Molecular analysis of the amylase gene and its expression during development in the winter floun-der, Pleuronectes americanus. Aquaculture 190: 247–260, 2000. 11. Dziewulska-Szwajkowska D, Lozinska-Gabska M, Adamowicz A,
Wojtaszek J, and Dzugaj A. The effect of high dose of cortisol on
glucose-6-phosphatase and fructose-1,6-bisphosphatase activity, and glu-cose and fructose-2,6-bisphosphate concentration in carp tissues (Cyprinus
carpio L.). Comp Biochem Physiol B Biochem Mol Biol 135: 485– 491,
2003.
12. Eisen MB, Spellman PT, Brown PO, and Botstein D. Cluster analysis and display of genome-wide expression patterns. Proc Natl Acad Sci USA 95: 14863–14868, 1998.
13. Ferna`ndez-Diaz C and Yu`fera M. Detecting growth in gilthead sea-bream, Sparus aurata L.; larvae fed microcapsules. Aquaculture 153: 193–202, 1997.
14. Fuller JD, Bast DJ, Nizet V, Low DE, and de Azavedo JC.
Strepto-coccus iniae virulence is associated with a distinct genetic profile. Infect Immun 69: 1994 –2000, 2001.
15. Furlong EE, Andersen EC, Null B, White KP, and Scott MP. Patterns of gene expression during Drosophila mesoderm development. Science 293: 1629 –1633, 2001.
16. Gawantka V, Pollet N, Delius H, Vingron M, Pfister R, Nitsch R,
Blumenstock C, and Niehrs C. Gene expression screening in Xenopus
identifies molecular pathways, predicts gene function and provides a global view of embryonic patterning. Mech Dev 77: 95–141, 1998. 17. Gehring NH, Hentze MW, and Pantopoulos K. Inactivation of both
RNA binding and aconitase activities of iron regulatory protein-1 by quinone-induced oxidative stress. J Biol Chem 274: 6219 – 6225, 1999. 18. Gracey AY, Troll JV, and Somero GN. Hypoxia-induced gene
expres-sion profiling in the euryoxic fish Gillichthys mirabilis. Proc Natl Acad Sci
USA 98: 1993–1998, 2001.
19. Gracey AY and Cossins AR. Application of microarray technology in environmental and comparative physiology. Annu Rev Physiol 65: 231– 259, 2003.
20. Gracey AY, Fraser EJ, Li W, Fang Y, Taylor RR, Rogers J, Brass A,
and Cossins AR. Coping with cold: an integrative, multitissue analysis of
the transcriptome of a poikilothermic vertebrate. Proc Natl Acad Sci USA 101: 16970 –16975, 2004.
21. Hair JF, Anderson RE, Tathum RL, and Black WC. Multivariate Data
Analysis (5th ed.). Upper Saddle Hall, NJ: Prentice-Hall, 1998.
22. Hontela A, Rasmussen JB, Audet C, and Chevalier G. Impaired cortisol stress response in fish from environments polluted by PAHs, PCBs, and mercury. Arch Environ Contam Toxicol 22: 278 –283, 1992.
23. Hughes TR, Mao M, Jones AR, Burchard J, Marton MJ, Shannon
KW, Lefkowitz SM, Ziman M, Schelter JM, Meyer MR, Kobayashi S, Davis C, Dai H, He YD, Stephaniants SB, Cavet G, Walker WL, West A, Coffey E, Shoemaker DD, Stoughton R, Blanchard AP, Friend SH, and Linsley PS. Expression profiling using microarrays fabricated by an
ink-jet oligonucleotide synthesizer. Nat Biotechnol 19: 342–347, 2001. 24. Inomata N, Kanda K, Cariou ML, Tachida H, and Yamazaki T.
Evolution of the response patterns to dietary carbohydrates and the developmental differentiation of gene expression of alpha-amylase in
Drosophila. J Mol Evol 41: 1076 –1084, 1995.
25. Jiang M, Ryu J, Kiraly M, Duke K, Reinke V, and Kim SK. Genome-wide analysis of developmental and sex-regulated gene expression profiles in Caenorhabditis elegans. Proc Natl Acad Sci USA 98: 218 –223, 2001. 26. Kerr MK and Churchill GA. Experimental design for gene expression
microarrays. Biostatistics 2: 183–201, 2001.
27. Kerr MK and Churchill GA. Statistical design and the analysis of gene expression microarray data. Genet Res 77: 123–128, 2001.
28. Kitajima C, Tsukashima Y, Fujita S, Watanabe T, and Yone Y. Relationship between uninflated swimbladders and lordotic deformity in hatchery reated sea bream Pagrus major. Bull Jpn Soc Sci Fish 47: 1289 –1294, 1981.
29. Kolkovski S. Digestive enzymes in fish larvae and juveniles–implications and applications to formulated diets. Aquaculture 200: 181–200, 2001. 30. Koumoundouros G, Gagliardi F, Divanach P, Boglione C, Cataudella
S, and Kentouri M. Normal and abnormal osteological development of
caudal fin in Sparus aurata L. fry. Aquaculture 149: 215–226, 1997. 31. Koven W, Kolkovski S, Hadas E, and Gamsiz KTA. Advances in the
development of microdiets for gilthead sea bream, Sparus aurata: a review. Aquaculture 194: 107–121, 2001.
32. Koza RA, Moore MJ, and Stegeman JJ. Elevated ornithine decarbox-ylase activity, polyamines and cell proliferation in neoplastic and vacuo-lated liver cells of winter flounder (Pleuronectes americanus).
Carcino-genesis 14: 399 – 405, 1993.
33. Laiz-Carrion R, Martin Del Rio MP, Miguez JM, Mancera JM, and
Soengas JL. Influence of cortisol on osmoregulation and energy
metab-olism in gilthead seabream Sparus aurata. J Exp Zool 298: 105–118, 2003. 34. Lazo JP, Dinis MT, Holt JG, Faulk C, and Arnold CR. Co-feeding microparticulate diets with algae: towards eliminating the need of
zoo-plankton at first feeding red drum (Sciaenops ocellatus). Aquaculture 188: 339 –351, 2000.
35. Li ZR, Hromchak R, Mudipalli A, and Bloch A. Tumor suppressor proteins as regulators of cell differentiation. Cancer Res 58: 4282– 4287, 1998. 36. Lo J, Lee S, Xu M, Liu F, Ruan H, Eun A, He Y, Ma W, Wang W,
Wen Z, and Peng J. 15000 unique zebrafish EST clusters and their future
use in microarray for profiling gene expression patterns during embryo-genesis. Genome Res 13: 455– 466, 2003.
37. McCormick SD, Dickhoff WW, Duston J, Nishioka RS, and Bern HA. Developmental differences in the responsiveness of gill Na⫹,K⫹-ATPase to cortisol in salmonids. Gen Comp Endocrinol 84: 308 –317, 1991. 38. Mommsen TP, Vijayan MM, and Moon TW. Cortisol in teleosts:
dynamics, mechanisms of action and metabolic regulation. Rev Fish Biol
Fisheries 9: 211–268, 1999.
39. Moshier JA, Dosescu J, Skunca M, and Luk GD. Transformation of NIH/3T3 cells by ornithine decarboxylase overexpression. Cancer Res 53: 2618 –2622, 1993.
40. Moyano FJ, Diaz M, Alarcon FJ, and Sarasquete MC. Characterization of digestive enzyme activity during larval development of gilthead sea-bream Sparus aurata. Fish Physiol Biochem 15: 121–130, 1996. 41. Neal SJ, Gibson ML, So AK, and Westwood JT. Construction of a
cDNA-based microarray for Drosophila melanogaster: a comparison of gene transcription profiles from SL2 and Kc167 cells. Genome 46: 879 – 892, 2003.
42. Niehrs C and Pollet N. Synexpression groups in eukaryotes. Nature 402: 483– 487, 1999.
43. Oleksiak MF, Churchill GA, and Crawford DL. Variation in gene expres-sion within and among natural populations. Nat Genet 32: 261–266, 2002. 44. Olivotto I, Mosconi G, Maradonna F, Cardinali M, and Carnevali O.
Diplodus sargus interrenal-pituitary response: chemical communication in
stressed fish. Gen Comp Endocrinol 127: 66 –70, 2002.
45. Paperna I. Swimbladder and skeletal deformations in hatchery bred
Sparus aurata. J Fish Biol 12: 109 –114, 1978.
46. Parson-LeRuyet J and Verillaud P. Technique d’elevage intensif de la daurade doree (Sparus aurata L.) de la naissance a l’age de deux mois.
Aquaculture 20: 1980.
47. Ponka P and Lok CN. The transferrin receptor: role in health and disease.
Int J Biochem Cell Biol 31: 1111–1137, 1999.
48. Ribas LPJV, Barton B, Monetti C, Bernadini G, Saroglia M, Tort L,
and MacKenzie S. A differentially expressed enolase gene isolated from
the gilthead sea bream (Sparus aurata) under high-density conditions is up-regulated in brain after in vivo lipopolysaccharide challenge.
Aqua-culture 241: 195–206, 2004.
49. Rise ML, Jones SR, Brown GD, Von Schalburg KR, Davidson WS,
and Koop BF. Microarray analyses identify molecular biomarkers of
Atlantic salmon macrophage and hematopoietic kidney response to
Pis-cirickettsia salmonis infection. Physiol Genomics 20: 21–35, 2004.
50. Rockett JC and Hellmann GM. Confirming microarray data–is it really necessary? Genomics 83: 541–549, 2004.
51. Sarropoulou E, Power DM, Magoulas A, Geisler R, and Kotoulas G. Comparative analysis and characterization of expressed sequence tags in gilthead sea bream (Sparus aurata) liver and embryos. Aquaculture 243: 69 – 81, 2005.
52. Ton C, Stamatiou D, Dzau VJ, and Liew CC. Construction of a zebrafish cDNA microarray: gene expression profiling of the zebrafish during development. Biochem Biophys Res Commun 296: 1134 –1142, 2002.
53. Ton C, Stamatiou D, and Liew CC. Gene expression profile of zebrafish exposed to hypoxia during development. Physiol Genomics 13: 97–106, 2003.
54. Wang QT, Piotrowska K, Ciemerych MA, Milenkovic L, Scott MP,
Davis RW, and Zernicka-Goetz M. A genome-wide study of gene
activity reveals developmental signaling pathways in the preimplantation mouse embryo. Dev Cell 6: 133–144, 2004.
55. White KP, Rifkin SA, Hurban P, and Hogness DS. Microarray analysis of Drosophila development during metamorphosis. Science 286: 2179 – 2184, 1999.
56. Yang YH and Speed T. Design issues for cDNA microarray experiments.
Nat Rev Genet 3: 579 –588, 2002.
57. Zhou XJ and Gibson G. Cross-species comparison of genome-wide expression patterns. Genome Biol 5: 232, 2004.