__________________________________________________________________ Revista de Direito da Cidade, vol. 07, nº 4. Número Especial. ISSN 2317-7721 pp.1923-1943 1923 OSCILLATIONS AROUND A PLATEAU: DEATHS BY HOMICIDE IN BRAZIL – 1979-2013 OSCILAÇÕES EM TORNO DE UM PLANALTO: MORTES VIOLENTAS POR HOMICÍDIO NO BRASIL - 1979-2013
Emilio E Dellasoppa 1 Kaizô I Beltrão2 Abstract
This text focuses on the analysis on homicide/assault rates in Brazil over three decades: 1979-2013. It disaggregates the information by area – Great Regions - in Brazil and provides separate statistics for young adults and young adult males, the most vulnerable group. Rates are calculated as the ratio of registered deaths by causes from the Ministry of Health and the population estimated by the Central Statistical Office - IBGE. To further enhance the comprehension of the process at a lower ecological unit, we focused on the Southeast Region, which presented the sharpest drop. The analysis is replicated for all four states in the Region. Results showed that some short lived downward trends were just part of oscillations around a plateau. This plateau was the consequence of opposing trends among the several regions/states in Brazil. Additionally, a hypothesis raised in sociological literature, that the proportion of young adults in the population is positively correlated with homicide rates is ruled out by our data.
Keywords: Homicide/assault Rates; Brazil; Young adult males; Demographic hypotheses; Diversity of homicide/assault trends.
Resumo
O texto focaliza a análise das taxas de mortalidade por homicídio no Brasil durante mais de três décadas: 1979-2013. Os dados são desagregados por área – Grandes Regiões do Brasil. São fornecidas estatísticas para os adultos jovens e homens jovens, o grupo notoriamente mais vulnerável. As taxas são calculadas como a razão das mortes registradas por causas pelo Ministério da Saúde e a população estimada pelo Instituto Brasileiro de Geografia e Estatística - IBGE. Para aprofundar a compreensão do processo a níveis ecológicos menores, focalizamos na Região Sudeste, que apresentou a queda mais acentuada. A análise é replicada para os quatro estados da Região. Os resultados mostram que algumas tendências de queda são apenas parte de oscilações em torno a um platô. Este platô foi a consequência de tendências opostas entre as diferentes regiões/estados no Brasil. Ainda, uma hipótese levantada na literatura sociológica, de que a proporção de adultos jovens está correlacionada positivamente com as taxas de homicídio é invalidada pelos dados.
Palavras-chave: Taxas de homicídio; Brasil; Homens jovens; Hipótese demográfica; Heterogeneidade de tendências de homicídios.
1 Chemical Engineering from University of La Plata and a DSc in Political Sciences from Sao Paulo University. Associate Professor at Rio de Janeiro State University. Email: [email protected].
2 Degree in Mechanical Engineering from the Technological Aeronautical Institute (Brazilian Air Force Ministry) and a PhD in Statistics from Princeton University. Researcher at the Brazilian School of Public and Private Administration/ Getulio Vargas Foundation. Email: [email protected].
__________________________________________________________________ Revista de Direito da Cidade, vol. 07, nº 4. Número Especial. ISSN 2317-7721 pp.1923-1943 1924 INTRODUCTION
Several statistics referring to the beginning of the first decade of the century indicate a drop in violent deaths in specific areas of Brazil and for the country as a whole: years of life lost (BELTRÃO and DELLASOPPA, 2011a, 2011b), age-specific mortality rates from health registers (BRASIL, 2006), intentional violent crime registers (BRASIL, 2007), young adult violent deaths (FERREIRA, 2005; WAISELFISZ, 2011) among others. Some authors include Brazil as part of an international decline in crime rates (see TSELONI et al, 2010). Nonetheless, the subsequent years showed that this short-lived downward trend was just part of what is now perceived as oscillations around a plateau. The plateau for the combined crude mortality rate by homicides for both sexes in Brazil is around 27.3 deaths per one hundred thousand population (between 1998 and 2013), while for young adults it doubles to 54.5 (between 2000 and 2013) and for young adult males it doubles again to 101.7 (same period).
It is worth noting, though, that these recent figures for Brazil are very high by international
standards, well above the 10 per 100 thousand level classified by the World Health Organization as epidemic (apud PNUD, 2013). The Global Study on Homicide (UNODC, 2011c) states that the “… homicide rate in Africa and the Americas (at 17 and 16 per 100,000 population, respectively) is more than double the global average (6.9 per 100,000), whereas in Asia, Europe and Oceania (between 3 and 4 per 100,000) it is roughly half.” Considering countries individually,
shows the thirty highest homicide rates per 100 thousand using Criminal Justice sources (UNODC, 2011a): countries from the Americas are denoted as red bars (Brazil in black), African countries as blue bars and European countries in green. Among the 30 countries with the highest rates, 23 are from the Americas, 6 from Africa and only 1 from Europe. Asian and Australia/Oceania countries are not included among these thirty. Rankings using different international sources could vary accordingly. Homicide rates from health organizations are usually remarkably different from those originated from Criminal Justice sources (see UNODC 2011b for a comparison of the two sources). More elaborate indicators which include interpersonal violence, such as the Violent Societies Index proposed by Karstedt (2012) consistently ranked Brazil among the thirteen extremely violent societies during the time interval under scrutiny.
__________________________________________________________________ Revista de Direito da Cidade, vol. 07, nº 4. Número Especial. ISSN 2317-7721 pp.1923-1943 1925 Figure 1. Homicide statistics, Criminal Justice sources, latest available year, 2003-2008
SOURCE: UNODC, 2011a
A large group of hypotheses is found in the international literature to explain recent changes in criminality and homicide figures in several developed countries (AEBI and LINDE, 2010; BARBAGLI, 2000; BARKER, 2010; BAUMER, 2008; BLUMSTEIN and WALLMAN, 2006; FOX, 2006; HAGAN, 1994; HAGEDORN and RAUCH, 2004; HUME, 2007; KILLIAS and AEBI, 2000; MORO, 2006; PEARCE, 2006; RENNISON and PLANTY, 2006; RODGERS, 2006; WALLMAN and BLUMSTEIN, 2006; WILKINSON, 2005; ZIMRING and FAGAN, 2000). As is usual in Social Sciences, no consensus can be verified among the authors about the capacity of these hypotheses to explain factors related to the evolution of criminality and homicide/assault, an opinion shared by Tseloni et al (2010). Farrell (2013) singles out and analyzes 15 of those hypotheses related to: “…lead poisoning; abortion legalization; drug markets; demographics; policing numbers and strategies; imprisonment; strong economies; the death penalty; gun control; gun concealment; immigration; consumer confidence; the civilizing process; and improved security.” Farrell proposes a battery of five tests as a first filter for those hypotheses. This paper will consider one of those hypotheses: the effect of the proportion of young adults in the population on crime (the demographic hypothesis).
None of these hypotheses considered individually seem to satisfactorily explain homicide rates in Latin America. Analyzing the specific case of Brazil, we can observe two fundamental
__________________________________________________________________ Revista de Direito da Cidade, vol. 07, nº 4. Número Especial. ISSN 2317-7721 pp.1923-1943 1926 differences with developed countries: first, homicide is a central issue in Brazil, against the importance of crime against property in the developed countries; second, the homicide rate in Brazil is not following a downward trend and stabilizing around lower values, but after a long period of increase, it is oscillating around a plateau at a very high level. Brazil also differs from other Latin American countries regarding the interplay of homicide rates and economic development. The stability occurs while other countries present increasing trends in crime and violence, paradoxically concomitant with economic development and reduction in inequality, poverty and unemployment (PNUD, 2013).
In Brazil, crude mortality rates for the country as a whole have remained basically stable since 1995 (external causes around 72.4 per 100 thousand) or 1998 (homicide/assault around 27.3). These plateaus were the result of opposing trends among the several regions/states in Brazil, some showing sharp decreases counterbalanced by sharp increases in other regions/states. As already shown in the literature, the ecological unit considered exerts a strong influence on the level and pattern of the variable analyzed (VAN WILSEN, 2004). The continental size of the country, more than 3 million square miles, may explain the lack of homogeneous behavior with respect to cultural and sociopolitical issues. Though these figures for Brazil are high by international standards, they are smaller than those of several other countries in Latin America, the most violent region in the World.
All these curtailed lives result in huge human, social and economic costs. To better understand the importance and historical variations of these deaths, this text focuses on the analysis of homicide/assault rates in an extended period, over three decades: 1979/2013 (the latest available information).
At a comparative level, it must be noted that there are profound and nontransferable cultural differences among countries, which are synergic to the evolution of these processes: urban ecologies, lifestyles of young adults at risk, and social, cultural and economic factors (like macro-level changes in capital investment, distressed communities with residential segregation, racial inequalities and concentration of poverty), and the perception of these inequalities, the access to goods and services (like sneakers, cellphones, internet and social nets) and changes in the economics and trends of the use of illegal drugs. Another influence is the always changing geographical distribution and relations of power among the organizations dealing with production and distribution of illegal drugs (MOELLER and HESSE, 2013). Often, the borderline between deaths caused by wars/guerrillas and homicide is not clear (SOUZA et al., 2012). All these
__________________________________________________________________ Revista de Direito da Cidade, vol. 07, nº 4. Número Especial. ISSN 2317-7721 pp.1923-1943 1927 differences must be taken into account when comparing Brazil patterns with those of other countries’.
Common sense links improvement on social indicators to a decline in violence in general and of homicides in particular (or, the inverse situation: worsening of social indicators implying more violence). In the case of Brazil, one can observe an increase in homicide rates during the 80s, the so called lost decade, because of economic stagnation. On the other hand, a new pattern begins at the end of the last century, with moderate economic growth and stable crude mortality rates. Diversely, in this century, homicide rates have been increasing in several Latin American countries in a context of dynamic growth and improvement in social indicators (PNUD, 2013).
This text will deal specifically with deaths by homicide/assault in Brazil. To evaluate the importance of deaths by homicide in the country, we note that in 2013, “External causes” were the third most important Chapter in the International Classification of Diseases, ICD-103, following “Diseases of the circulatory system” and “Neoplasms”. External causes represented 12.9% of all deaths. Deaths by homicide/assault comprised 37.4% of deaths by External causes. The situation was even more concentrated for young adults. Corresponding figures were respectively, 74.6% and 57.5%.
The present text comprises four sections: Introduction, Data and Methodology, Results, and Conclusions. The section on Results is further disaggregated into sub-sections dealing with the population as a whole, young adults and young adult males. Given the opportunity allowed by the extended time span of our data, the demographic hypothesis is tested in the sub-section of young adult males.
DATA AND METHODOLOGY
Age-specific mortality rates are calculated as the ratio of registered deaths and the population at risk. In Brazil there are two alternative sources for registered deaths: the Civil Registry from the “Instituto Brasileiro de Geografia e Estatística” - IBGE4 (2013) and the vital statistics from the Brazilian Ministry of Health (BRASIL, 2013). Both sources use death certificates as a starting point, but the Civil Registry collects them from the vital registration systems operated at the various local jurisdictions and the Ministry of Health collects them from the Health
3 The ICD is a classification system of morbidity and death causes coordinated by the WHO. It´s periodically revised. It underwent a revision in 1994, ICD-10, adopted by Brazil from 1996 on (Brasil 2010a and 2010b). 4 Brazilian Central Statistical Office.
__________________________________________________________________ Revista de Direito da Cidade, vol. 07, nº 4. Número Especial. ISSN 2317-7721 pp.1923-1943 1928 Department of each Brazilian state. This text uses data from the Ministry of Health with external causes further disaggregated as homicides and other external causes classified according to ICD, while the IBGE uses solely a dichotomous classification of “violent/non-violent.”
From the inception of the mortality statistics collecting system in 1979 up to 1996, the Ministry of Health system used ICD-9 to classify causes of death and in the remaining years, ICD-10. The equivalence between classifications was done following the Pan-American Health Organization (PAHO, 1999) recommendations. Disaggregated data by homicide/assault does not exhibit a discontinuity with the changes introduced by the 10th Revision. The same happens for other groups of causes (see BELTRÃO and DELLASOPPA, 2011a, 2011b). For non-census years, population at risk is estimated by linear interpolation of data by sex and age groups counted in census years (IBGE 1982, 1996, 2001, 2011). It must be noted that the analysis of the years previous to 1979 is unfeasible since data collection by the Ministry of Health system only started this year.
Ministry of Health data have some quality drawbacks: i) incomplete death coverage; ii) possible misclassification of causes of death as well as the fact that “Deaths due to signs, symptoms and ill-defined conditions are presented in a separate category…” (PAHO, 1999); and iii) the presence of registers with unknown age and/or sex. Due corrections for all these situations as described in Beltrão and Dellasoppa (2011a, 2011b) are used in the present text. No correction was performed to adjust for the first shortcoming. Assuming that death coverage has been changing smoothly (no drastic changes occurred in the period, neither on regulation, nor by public campaigns), the impact would be of an increasing trend. It is worth noting that some states showed no undercoverage5. For the disaggregation used in this text, an upper limit6 for the second shortcoming was estimated using information contained in Mello Jorge et al. (2002a, 2002b). Beltrão and Dellasoppa (2011a, 2011b), analyzing information up to 2010, verified that completeness of age and sex information on death registers was, with almost no exception among the Great Regions7 and states, higher than 98%. This figure is 96% for deaths by “External causes” and 95% for deaths by homicide. Following the procedure defined in Beltrão and Dellasoppa
5 Estimates for the state of Sao Paulo indicated full coverage for 1991, 2000 and 2010. For 1980, coverage was 99/98% (respectively for males and females).
6 There is some regional discrepancy with a greater proportion of ill-defined causes of death in the North and Northeast, but not enough to jeopardize our analysis.
7 Brazil’s 27 states are divided into 5 allegedly homogeneous regions denominated Grandes Regiões (Great Regions), namely: North (with the states of Rondônia, Acre, Amazonas, Roraima, Pará, Amapá and Tocantins), Northeast (Maranhão, Piauí, Ceará, Rio Grande do Norte, Paraíba, Pernambuco, Alagoas, Sergipe and Bahia), Southeast (Minas Gerais, Espírito Santo, Rio de Janeiro and Sao Paulo), South (Paraná, Santa Catarina and Rio Grande do Sul) and Midwest (Mato Grosso do Sul, Mato Grosso, Goiás and the Federal District).
__________________________________________________________________ Revista de Direito da Cidade, vol. 07, nº 4. Número Especial. ISSN 2317-7721 pp.1923-1943 1929 (2011a, 2011b) deaths with unknown sex and age were proportionally distributed, in that order, according to the known distribution. Proportional mortality by ill-defined causes, while ICD-9 was under use, fluctuates around 6%. With the implementation of ICD-10 in 1996, there was a slight increase in these proportions, up to around 7%.
Crude mortality rates by homicide/assault for each sex were estimated for the years between 1979 and 2013, both for all age groups and for the young population (between 15 and 24 years of age). Similar statistics were also calculated for both sexes combined. Dealing with each sex separately helps to control possible errors (statistics for women not shown in the text). Besides the estimates for the country as a whole, separate estimates were computed for each Great Region and, separately, for all the states in the Southeast region.
RESULTS
Homicide rates for the Brazilian population
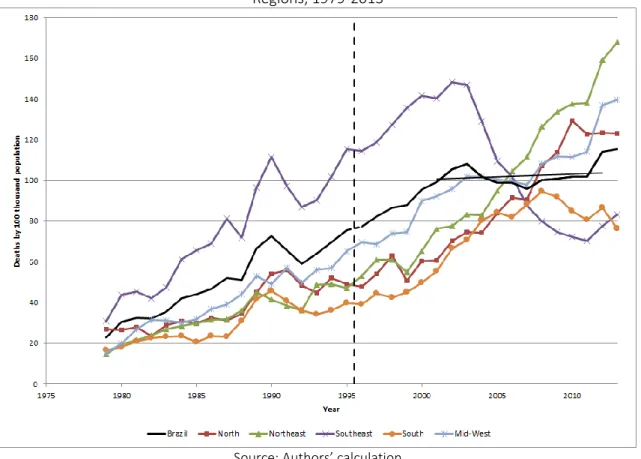
To observe the recent stabilization at such high levels in context, it is adequate to weigh against the evolution in a more extended period for which mortality information by cause is available: 1979/2013. Crude homicide mortality rates (deaths by 100 thousand population) between 1979 and 2013 are displayed in Erro! Fonte de referência não encontrada.. Erro! Fonte de referência não encontrada. displays the corresponding index rates with 1979 equal to 1. For Brazil as a whole (black line), the rate exhibited an upward trend (with oscillations) from 1979 to 2003, interrupted in 2003 by a small drop up to 2005, followed by fluctuating but stable high homicide rates between 2005 and 2007 and a slight upward trend from then on8. Between 1998 and 2013, one could consider that values are oscillating around 27.3 deaths per one hundred thousand. When considering Brazil’s Great Regions, the situation is more complex with no homogeneous trends: the homicide rate drop begins in the Southeast Region (violet line) in 2003 after a plateau period, from 1999 to 2002, when homicide rates stabilize around 37 deaths per 100 thousand, falling to a figure 44% smaller, 20.8. All other regions show an upward trend with heterogeneous oscillations from 1979 on, reaching, in three of the Great Regions, values that almost double the
8 In this text, we are not taking into account the under-registration of intentional homicides. For an evaluation of the effect of death coverage by state in Brazil, see Beltrão and Dellasoppa (2011a). The correction for under-registration in the case of a group of death causes is also affected by the proportion of ill-defined deaths in the population. Both the proportion of under-registration and of ill-defined deaths have been diminishing with time. They affect homicide rates in opposite directions, though.
__________________________________________________________________ Revista de Direito da Cidade, vol. 07, nº 4. Número Especial. ISSN 2317-7721 pp.1923-1943 1930 one for the Southeast: North (35.7), Northeast (39.4) and Midwest (37.1). The exception is the South with a homicide rate of 20.8 deaths by one hundred thousand. Changes are of different magnitude among the regions. The increase in the other regions was proportionally higher than the decrease in the Southeast, but because of the much larger population of the Southeast the final result for Brazil is the relative stability of the national homicide rate observed since 1998. The population in the Southeast encompassed 43.5% of the total population in 1979. This proportion has been rather stable over time with figures of 42.0% in 2013.
Figure 2 – Cause specific mortality rate by homicide, Brazil and Great Regions, 1979-2013
Source: Authors’ calculation
Note: Rates calculated without correction for coverage
Erro! Fonte de referência não encontrada. displays the evolution of the homicide index for Brazil and its Great Regions considering the index value in 1979 equal to 1. The most striking feature is a large increase of the crude homicide mortality rates in the period: Brazil’s rate roughly tripled in the first 24 years. Rates are roughly stable from 1998 on. The five regions present a rather homogeneous upward behavior until the year 2000, when three different trends develop. The Midwest follows the national stabilization closely up to 2007 when a steady increase appears up to 2013, reaching a value roughly four times larger than in 1979. The North, Northeast and
__________________________________________________________________ Revista de Direito da Cidade, vol. 07, nº 4. Número Especial. ISSN 2317-7721 pp.1923-1943 1931 South regions exhibit important increases up to 2013, 264%, 480% and 156% respectively. On the other hand, the Southeast which had tripled its rate up to 1999, stabilizes until 2002 and shows a decline from then on, reaching a net increase (compared to 1979) of 66% in 2013.
Figure 3 – Cause specific mortality rate by homicide Index (1979=1), Brazil and Great Regions, 1979-2013
Source: Authors’ calculation
Note: Rates calculated without correction for coverage
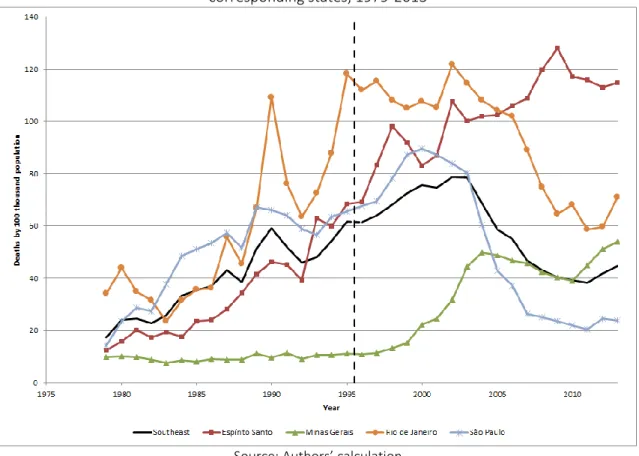
In the Southeast, the plateau (1999-2002) followed by the decline (2002-2013) is the compound result of individual state behaviors. Similar to what happened to the country as a whole, one can observe contradictory trends among these states, some even with net increases (
). The downward trend in the state of Rio de Janeiro was the first one to occur. It begins in 1995, with a temporary reversal between 2002 and 2003, then continuing the decline up to 2013, when the homicide rate for the state is virtually equal to the national rate (compare Erro! Fonte de referência não encontrada. and
). The homicide rate for Sao Paulo increases up to 1999, then decreases to reach a plateau between 2007 and 2013, with the lowest state value for the region, about half of the national
__________________________________________________________________ Revista de Direito da Cidade, vol. 07, nº 4. Número Especial. ISSN 2317-7721 pp.1923-1943 1932 average. The other two states, Minas Gerais and Espirito Santo present different behaviors: Minas Gerais displays, among the states of the region, the largest stable period, from the first year of data collection up to 1999, followed by an increase up to 2004 (with rates more than doubling its initial values), a slight decline in the following years and again an increase in the last interval. On the other hand, Espirito Santo which presented in 1979 a rate very close to that of the Southeast, experienced a very large increase, with values oscillating around 50 deaths by 100 thousand population by the end of the period.
Figure 4 – Cause specific mortality rate by homicide, Southeast Region and corresponding states, 1979-2013
Source: Authors’ calculation
Note: Rates calculated without correction for coverage Homicides among young adults: 15 to 24 years
In Brazil, as in most Latin America countries (PNUD, 2013), young adults are the most affected by homicides, both as perpetrators as well as victims. Young adult deaths represent around a third of all homicides during the period under analysis. Rates are even higher for young males.
__________________________________________________________________ Revista de Direito da Cidade, vol. 07, nº 4. Número Especial. ISSN 2317-7721 pp.1923-1943 1933 shows the cause specific mortality rate by homicide of young adults for Brazil as a whole and Great Regions from 1979 to 2013. For Brazil and regions, patterns for young adults are quite similar to the ones observed for all ages, but encompassing a larger dynamic range and much higher values for the rates. It is also worth mentioning the absence of the plateau observed for the Southeast between 1999 and 2003. In the last stretch between 2004 and 2013, while rates for Brazil remain almost stable (since 2000), trends for each region follow different patterns, similar to the ones observed for the total population: the Southeast presents a strong declining trend up to the last two years, against a strong increasing trend for the Northeast, North and Midwest regions and a rebound of the South reaching values close to those of the Southeast. This rebound in the South may be interpreted as a 5-year belated decrease (with respect to the Southeast).
Figure 5 – Cause specific mortality rate by homicide of Young adults (15-24), Brazil and Great Regions, 1979-2013
Source: Authors’ calculation
Note: Rates calculated without correction for coverage
Brazil’s rate stabilizes at a level fourfold larger than in 1979. The ratio between mortality rates for the young adults in the last and the first year is larger, for all Great Regions, than the one observed for all ages: North (4.7), Northeast (11.1), Southeast (2.6), South (4.7) and Midwest (8.6).
__________________________________________________________________ Revista de Direito da Cidade, vol. 07, nº 4. Número Especial. ISSN 2317-7721 pp.1923-1943 1934 Erro! Fonte de referência não encontrada. shows the same information of the previous Figure but disaggregated by the corresponding states of the Southeast region. Again, one observes a similar pattern at much higher values than those observed for all ages (
). The plateau for the Southeast region and for the Espírito Santo state changed into an increasing trend. Espírito Santo rates present an increasing trend for the whole period, reaching 115 deaths by 100 thousand, a tenfold increase from 1979.
Figure 6 – Cause specific mortality rate by homicide of Young adults (15-24), Southeast Region and corresponding states, 1979-2013
Source: Authors’ calculation
Note: Rates calculated without correction for coverage Homicides among young adult males
Young adult males present the highest mortality rate by homicide among all age groups and sexes considered.
__________________________________________________________________ Revista de Direito da Cidade, vol. 07, nº 4. Número Especial. ISSN 2317-7721 pp.1923-1943 1935 Figure 7 – Cause specific mortality rate by homicide of Young adult males (15-24), Brazil and Great
Regions, 1979-2013
shows cause specific mortality rate by homicide of young adult males (15-24) for Brazil and Great Regions in the 1979-2013 period, and the plateau since 2000 with a level twice the value observed for both sexes combined: 100.1 deaths per 100 thousand. For this group, the plateau is also the result of divergent trends, though similar to the ones observed for the population as a whole: decreasing for the Southeast, increasing for the North, Northeast and Mid-West and a bump for the South. As already mentioned this bump for the South can be interpreted as a belated decrease with respect to the Southeast.
Figure 7 – Cause specific mortality rate by homicide of Young adult males (15-24), Brazil and Great Regions, 1979-2013
Source: Authors’ calculation
__________________________________________________________________ Revista de Direito da Cidade, vol. 07, nº 4. Número Especial. ISSN 2317-7721 pp.1923-1943 1936 For young adult males, Brazil’s mortality rates by homicide stabilizes slightly higher than that of young adults of both sexes combined. The same happens for the breakdown by region. The ratio between mortality rates for the young adult males in the last and the first year is slightly larger than the one observed for young adults of both sexes: North (4.6), Northeast (11.5), Southeast (2.7), South (4.6) and Midwest (9.0).
shows the same information of the previous Figure but disaggregated by the corresponding states of the Southeast region. Again, one observes a similar pattern at much higher values than those observed for all ages (
) and for young adults of both sexes (Erro! Fonte de referência não encontrada.).
Figure 8 – Cause specific mortality rate by homicide of Young adult males (15-24), Southeast Region and corresponding states, 1979-2013
__________________________________________________________________ Revista de Direito da Cidade, vol. 07, nº 4. Número Especial. ISSN 2317-7721 pp.1923-1943 1937
Source: Authors’ calculation
Note: Rates calculated without correction for coverage Young adult population size and shar e
A hypothesis cited in Barbagli (2000) to explain homicide rate levels and changes is the absolute and relative size of the young adult population – the so called demographic hypothesis. Data for Brazil, Great Regions and states of the Southeast shown in
and
do not produce any evidence to support this hypothesis.
shows in the x-axis the proportion of young adults in the population and in the y-axis, the crude mortality rate by homicides for Brazil and Great Regions, from 1979 to 2013. The first year is denoted by a larger symbol. The overall trend for Brazil (black thin line) in the time interval is upward to the left, going from higher proportions of young adults and lower homicide rates to smaller proportions of young adults with higher homicide rates. All regions follow the same overall pattern. Looking closely one could disaggregate the curve for Brazil into four periods with different trends: 1979/91 (upward left), 1993/99 (upward right), 1999/2003 (upward left) and 2003/13
__________________________________________________________________ Revista de Direito da Cidade, vol. 07, nº 4. Número Especial. ISSN 2317-7721 pp.1923-1943 1938 (leveled to the left). This reinforces the idea that, at least in the case of Brazil, increases in homicide rates are not positively correlated with increases in the proportion of the young adult population in any of the ecological units considered, as proposed by the demographic hypothesis.
Figure 9 – Crude mortality rate by homicides as a function of the proportion of young adults (15-24) in the population - Brazil and regions – 1979 (with larger symbol)/2013
Source: Authors’ calculation
Note: Rates calculated without correction for coverage
If one were to consider the crude mortality rate for homicides among young adults as a function of the proportion of young adults in the population for Brazil as a whole and Great Regions (not shown) the patterns would be quite similar to the ones observed in
, only with a larger dynamic range and higher rates (as already commented) in the y-axis.
presents the same information displayed in
but disaggregated by state in the Southeast. The behavior of the state of Minas Gerais (green line) further reinforces the conclusion already reached that homicide rates are not always positively correlated with increases in the proportion of the young adult population: between 1979 and 1999, the curve is basically horizontal.
__________________________________________________________________ Revista de Direito da Cidade, vol. 07, nº 4. Número Especial. ISSN 2317-7721 pp.1923-1943 1939 Figure 10 – Crude mortality rate by homicides as a function of the proportion of young adults (15-24) in the population - Brazil, Southeast and corresponding states – 1979 (with larger symbol)/2013
Source: Authors’ calculation
Note: Rates calculated without correction for coverage CONCLUSIONS
As already mentioned, Brazil shares with several other Latin American countries a high homicide rate. This is the result of the evolution of homicide rates during the last quarter of the century. These rates are a dominant issue in Brazil, as far as crime is concerned. From 9.6 deaths per 100,000 population in 1979, it increases to a plateau with values oscillating around 27.3 from 1998 on. The corresponding figure for young adults doubles to 54.5, doubling again for young adult males to 101.7. The plateau for Brazil as a whole results from markedly different behaviors of three groups of Great Regions: a strong drop in the Southeast starting in 2003, after a period of stability; the Midwest presenting a stability similar to Brazil as a whole; and an important increase in the remaining regions (North, Northeast and South). The South shows a rebound at the end of the period. Concomitant with the diversity of cultural and sociopolitical characteristics of the states, within some Great Regions they can also exhibit markedly different behaviors with respect to the
__________________________________________________________________ Revista de Direito da Cidade, vol. 07, nº 4. Número Especial. ISSN 2317-7721 pp.1923-1943 1940 homicide rate. In the case of the Southeast, to compound the stability period and the downward trend, one can recognize three distinct patterns since 1994: a steady drop in the states of Rio de Janeiro and Sao Paulo; relative stability in the case of Espírito Santo (around 50 deaths per 100 thousand); and a strong increase in the state of Minas Gerais reaching another plateau around 20 deaths per 100 thousand. Note that these figures are all above the epidemic level as defined by the WHO.
The most striking feature when considering the evolution of the crude homicide rate for Brazil is the extremely large increase observed in the period: Brazil’s rate roughly tripled in the first 24 years under study and has been practically stable since 1998. The five regions present a rather homogeneous upward behavior until the year 2000 and diverge from then on. The Midwest follows the national stabilization closely up to 2007 when a steady increase appears in 2013, reaching a figure roughly four times larger than in 1979. The North, Northeast and South regions also exhibit important increases up to 2013, 264%, 480% and 156% respectively. On the other hand, the Southeast which had tripled its rate up to 1999, stabilizes until 2002 and shows a decline from then on, reaching a net increase (compared to 1979) of a mere 66% in 2013. Increases in the other regions were proportionally higher than the decrease in the Southeast, but because of the much larger population of the Southeast the final result for Brazil is the relative stability of the national homicide rate observed since 1998.
The demographic hypothesis raised in the literature to explain changes in crime levels proved itself not valid in Brazil’s case for the ecological units studied. In addition, it is worth mentioning that presently there are no satisfactory explanations to justify the apparent paradox in Brazil and Latin America in the first decade of the century: economic development and reduction in inequality, poverty and unemployment (PNUD, 2013) concomitant with high levels of criminality. Brazil differs from other Latin American countries, because its crude mortality rate by homicide/assault, though at an epidemic level, reached a plateau in 1998, while other countries present increasing trends in crime and violence up to the present date. This plateau precedes the current economic model associated with development based on increased consumption, an alleged reason for Brazil´s vulnerable situation for boosting crime levels (PNUD, 2013). The results of this paper suggest that the explanation, at least in the case of Brazil, should be further scrutinized, to better understand the complex situation associated with violence in the country.
In short, in recent years, Latin America has apparently been consolidating its position in the global arena, with poverty and inequality reductions, positive economic development and, in some
__________________________________________________________________ Revista de Direito da Cidade, vol. 07, nº 4. Número Especial. ISSN 2317-7721 pp.1923-1943 1941 countries, as was the case of Brazil, attaining a sustainable financial stability. Presently, this scenario changed dramatically for the worst in several countries in the region, including in Brazil. To make things even worse, in the background loomed the overwhelming challenge of violence in almost all Latin American societies. The region accounts for more than 100 thousand homicides per year and most of the countries of the region have epidemic level homicide rates. Between 2000 and 2010, the homicide rate for the region as a whole increased 11%. On the other hand, in most other world regions the homicide rate decreased or stabilized, widening the gap. According to data from the Ministry of Health, in 2013, there were 56,699 homicides in Brazil, on average, 155 people are murdered daily, much more than the total deaths occurring in the November 2015 Paris attacks. As shown in the text, confirming the literature on the subject, victims are mostly young adult males. Human and social costs of this violence in Brazil are so high that deaths exceed all United States soldiers killed in combat in the Vietnam War: 47,424. Brazil loses much more than that figure yearly by homicide.
Fundamental rights for life, human development, and physical and mental integrity of citizens are utterly undermined by violence, and annihilated forever by homicide. The resilience of violence in Brazil to multiple policies proposals originating from the different political parties in office, is striking. Finally, the recent problems of democracy in Brazil pose more uncertainties about the future, and about the future of our youth, the main victims and perpetrators of this violence. REFERENCES
AEBI, M.; LINDE, A. Is there a crime drop in Western Europe? European Journal on Criminal Policy and Research, v. 16, n. 4, p. 251-277, 2010.
BARBAGLI, M. Introduzione. Perché è diminuita la criminalità negli Stati Uniti? In: BARBAGLI, M. (Ed.), Perché è diminuita la criminalità negli Stati Uniti? Bologna: Società editrice il Mulino, p. 7-50, 2000.
BARKER, V. Explaining the great American crime decline: A review of Blumstein and Wallman, Goldberg and Rosenfeld, and Zimring. Law and Social Inquiry, v. 35, n. 2, p. 489-516, 2010.
BAUMER, E. P. An empirical assessment of the contemporary crime trends puzzle: A modest step toward a more comprehensive research agenda. In: GOLDBERGER, A.S.; ROSENFELD, R. (Ed.). Understanding Crime Trends: Workshop Report. National Research Council, Committee on Understanding Crime Trends, Committee on Law and Justice, Division of Behavioral and Social Sciences and Education, p. 127-176, Washington, DC: The National Academies Press, 2008.
__________________________________________________________________ Revista de Direito da Cidade, vol. 07, nº 4. Número Especial. ISSN 2317-7721 pp.1923-1943 1942 BELTRÃO, K. I.; DELLASOPPA, E. E. Anos de vida perdidos e hiato de gênero: Brasil e grandes regiões – 1980/2005. Texto para Discussão - Escola Nacional de Ciências Estatísticas, n. 31, Rio de Janeiro: Escola Nacional de Ciências Estatísticas, 2011a.
_____El designio de los hombres: años de vida perdidos en Brasil y en las grandes regiones,
1980-2005. Estudios Demográficos y Urbanos, v. 26, n. 2, p. 299-343,2011b.
BLUMSTEIN, A.; WALLMAN, J. The recent rise and fall of American violence. In: BLUMSTEIN, A.; WALLMAN, J. (Ed.). The Crime Drop in America. Revised Edition. New York: Cambridge University Press, p. 1-12, 2006.
BRASIL. Ministério da Justiça. Secretaria Nacional de Segurança Pública. Departamento de Pesquisa, Análise da Informação e Formação de Pessoal em Segurança Pública Análise das Ocorrências Registradas pelas Polícias Civis (Janeiro de 2004 a Dezembro de 2005), 2006. Disponível em: <http://www.observatorioseguranca.org/pdf/Mapacrimes.pdf>. Acesso em: 10 jul. 2013. _____Ministério da Saúde. Secretaria de Vigilância em Saúde – SVS. Redução de Homicídios no Brasil. In: Georgetown University. Center for Latin American Studies (CLAS). Political Database of
the Americas (PDBA), 2007. Disponível em:
<http://pdba.georgetown.edu/Security/citizensecurity/brazil/documents/rh.pdf>. Acesso em: 10 jul. 2013.
_____Classificação Estatística Internacional de Doenças e Problemas Relacionados à Saúde (CID-9). <http://tabnet.datasus.gov.br/cgi/sim/obtcid9br.htm>. 2010a.
_____Classificação Estatística Internacional de Doenças e Problemas Relacionados à Saúde (CID-10). <http://www2.datasus.gov.br/DATASUS/index.php?area=040203>. 2010b.
_____Ministério da Saúde. Datasus. Tabulador de estatísticas vitais, 2013. <http://tabnet.datasus.gov.br/cgi/deftohtm.exe?sim/cnv/obtuf.def>. Acesso em 10 jul. 2013. FARRELL, G. Five tests for a theory of the crime drop. Crime Science, v. 2, n. 5, 2013.
FERREIRA, H. O crescimento dos homicídios de crianças e adolescentes no Brasil: 1980 a 2003. Políticas sociais - acompanhamento e análise, v. 11, p. 178-185, 2005.
FOX, J. A. Demographics and US homicide. In: Blumstein, A.; Wallman, J. (Ed.). The Crime Drop in America. Revised Edition. New York: Cambridge University Press, p. 288-318, 2006.
HAGAN, J. Crime, inequality and efficiency. In: Glyn, A.; Miliband, D. (Ed.). Paying for inequality. The economic cost of social injustice. London: Rivers Oram Press, p. 80-99, 1994.
HAGEDORN, J. M.; RAUCH, B. Variations in urban homicide: Chicago, New York City, and global urban policy. Paper presented at “City Futures” conference, 2004. Chicago, US, 8 – 10 July 2004. Disponível em: <http://w.gangresearch.net/Archives/hagedorn/articles/homvar2.pdf>. Acesso em: 12 de dez. 2012.
HUME, M. (Young) Men With Big Guns: Reflexive Encounters with Violence and Youth in El Salvador. Bulletin of Latin American Research, v. 26, nº. 4, p. 480–496, 2007.
IBGE. Censo Demográfico 1980. Rio de Janeiro: Instituto Brasileiro de Geografia e Estatística, 1982. _____Censo Demográfico 1991. Rio de Janeiro: Instituto Brasileiro de Geografia e Estatística, 1996. _____Censo Demográfico 2000. Rio de Janeiro: Instituto Brasileiro de Geografia e Estatística, 2001.
__________________________________________________________________ Revista de Direito da Cidade, vol. 07, nº 4. Número Especial. ISSN 2317-7721 pp.1923-1943 1943 _____Censo Demográfico 2010. Rio de Janeiro: Instituto Brasileiro de Geografia e Estatística, 2011. _____Registro Civil, 2013. Disponível em: <http://www.registrocivil.ibge.gov.br/>. Acesso em: 1 nov. 2014.
KARSTEDT, S. Contextualizing mass atrocity crimes: The dynamics of ‘extremely violent societies’. European Journal of Criminology, v. 9, n. 5, p. 499–513, 2012.
KILLIAS, M.; AEBI, M. F. Crime trends in Europe from 1990 to 1996: how Europe illustrates the limits of the American experience. European Journal on Criminal Policy and Research, v. 8, n. 1, p. 43–63. 2000.
MELLO JORGE, M. H. P.; GOTLIEB, S. L. D.; LAURENTI, R. O sistema de informações sobre mortalidade: problemas e propostas para seu enfrentamento. II – mortes por causas naturais. Revista Brasileira de Epidemiologia, v. 5, n. 2, p. 197-211, 2002a.
_____O sistema de informações sobre mortalidade: problemas e propostas para seu enfrentamento. II – mortes por causas externas. Revista Brasileira de Epidemiologia, v. 5, n. 2, p. 212-222, 2002b.
MOELLER, K.; HESSE, M. Drug market disruption and systemic violence: Cannabis markets in Copenhagen. European Journal of Criminology, v. 10, n. 2, p. 206–221, 2013.
MORO, J. Juventudes, Violencia y Exclusión: Desafíos para las Políticas Públicas. Guatemala: INAP– INDES–BID, 2006.
PAHO. Epidemiology: New PAHO List 6/67 for Tabulation of ICD-10 Mortality Data. Epidemiological Bulletin, v. 20, n. 3, p. 4-9, 1999.
PEARCE, J. Bringing Violence Back Home. In: Glasius, M.; Kaldor, M.; Anheier, H. (Ed.) Global Civil Society. London: SAGE Publications, p. 64-89, 2006.
PNUD. Informe Regional de Desarrollo Humano 2013-2014. Seguridad ciudadana con rostro humano: diagnóstico y propuestas para América Latina. New York: PNUD, 2013.
RENNISON, C.M.; PLANTY, M. Reassessing who contributed most to the decline in violence during the 1990s: a reminder that size does matter. Violence and Victims, v. 21, n. 1, p. 23-47, 2006. RODGERS, D. Living in the shadow of death: Gangs, violence and social order in urban Nicaragua, 1996-2002. Journal of Latin American Studies, v. 38, n. 2, p. 267-292, 2006.
SOUZA, E.R. et al. Estudo multicêntrico da mortalidade por homicídios em países da América Latina. Ciênc. saúde coletiva [online] v. 17, n. 12, p. 3183-3193, 2012. Disponível em: <http://www.scielo.br/scielo.php?script=sci_arttext&pid=S141381232012001200004&lng=en&nr m=iso>. Acesso em: 23 jan. 2013.
TSELONI, A.; MAILLEY, J.; FARRELL, G.; TILLEY, N. Exploring the international decline in crime rates. European Journal of Criminology, v. 7, n. 5, p. 375-394, 2010.
__________________________________________________________________ Revista de Direito da Cidade, vol. 07, nº 4. Número Especial. ISSN 2317-7721 pp.1923-1943 1944 UNODC. Homicide Statistics, Criminal Justice Sources - Latest available year (2003-2008), 2011a. Disponível em: <http://www.unodc.org/unodc/en/data-and-analysis/homicide.html>. Acesso em: 14 nov. 2012.
_____Homicide Statistics, Public Health Sources - Latest available year (2003-2008), 2011b. Disponível em: <http://www.unodc.org/unodc/en/data-and-analysis/homicide.html>. Acesso em: 14 nov. 2012.
_____Global study on homicide – 2011, 2011c. Disponível em: <http://www.unodc.org/unodc/en/data-and-analysis/statistics/crime/global-study-on-homicide-2011.html>. Acesso em: 14 nov. 2012.
VAN WILSEM, J. Criminal Victimization in Cross-National Perspective - An Analysis of Rates of Theft, Violence and Vandalism across 27 Countries. European Journal of Criminology, v. 1, n. 1, p. 89–109, 2004.
WAISELFISZ, J.J. Mapa da Violência 2011 - Os Jovens do Brasil. Instituto Sangari and Ministério da
Justiça, 2011. Disponível em:
<http://www.mapadaviolencia.org.br/pdf2011/MapaViolencia2011.pdf>. Acesso em: 14 nov. 2012. WALLMAN, J.; BLUMSTEIN, A. Epilogue to the revised edition. After the crime drop. In: BLUMSTEIN, A.; WALLMAN, J. (Ed.). The Crime Drop in America. Revised Edition. New York: Cambridge University Press, p.319-348, 2006.
WILKINSON, R.G. The Impact of Inequality. New York: The New Press, 2005.
ZIMRING, F. E.; FAGAN, J. Le cause della diminuizione dei reati : alcune riflessioni sull´analisi degli omicidi a New York. In: BARBAGLI, M. (Ed.). Perché è Diminuita la Criminalità Negli Stati Uniti? Bologna: Società editrice il Mulino, pp. 225-238, 2000.
Trabalho enviado em 29 de janeiro de 2016. Aceito em 31 de janeiro de 2016.