ANÁLISE DAS ESTRATÉGIAS AMBIENTAIS COMO SUPORTE PARA AVALIAÇÃO ECONÔMICO-FINANCEIRA DAS EMPRESAS DO SETOR ENERGÉTICO DO ÍNDICE DE SUSTENTABILIDADE EMPRESARIAL – ISE ANALYSIS OF THE ENVIRONMENTAL STRATEGIES FOR SUPPORTTING THE
ECONOMIC-FINANCIAL EVALUATION OF ENERGY SECTOR FIRMS WITHIN THE CORPORATE SUSTAINABILITY INDEX – ISE
Luciano Queiroz de Araújo Júnior* E-mail: luciano.qajr@gmail.com Gioconda Suncion Acuña* E-mail: giocondasuncion@yahoo.com.br Alice Paraguassu Fonseca de Macedo* E-mail: aliceparaguassu@gmail.com
Luís Filipe Azevedo de Oliveira* E-mail: luisfilipeao@outlook.com Jamerson Viegas Queiroz * E-mail: viegasqueiroz@gmail.com
Fernanda Cristina B. Pereira Queiroz * E-mail: fernandacbpereira@gmail.com *Universidade Federal do Rio Grande do Norte (UFRN), Natal, RN
Resumo: As companhias empresariais têm inserido o desenvolvimento sustentável para alcançar o
crescimento no mercado em que atuam e permanecer em longo prazo, bem como a geração de maiores rendimentos. O objetivo do presente estudo é correlacionar as estratégias ambientais como suporte para avaliação e retorno financeiro das empresas do setor energético brasileiro que estão listadas no Índice de Sustentabilidade Empresarial (ISE) na Bolsa de Valores Bovespa/BMF. Para análise dessa correlação, utilizou-se a Análise Envoltória de Dados – DEA, para realizar a avaliação da eficiência por meio da fronteira clássica e construção de um ranking do índice combinado, com a análise estatística realizada pelo SPSS, com os dados das 10 empresas do setor de energia utilizadas na pesquisa. Para análise das estratégias ambientais, analisaram-se todos os anuários publicados, através de uma análise qualitativa. Como resultado, foi gerado um ranking das empresas, o qual apresenta a empresa Light S/A como a mais eficiente na correlação financeira e ambiental. Apresenta-se também um levantamento geral das principais estratégias utilizadas por cada empresa, de forma a contribuir com um alinhamento de ações sustentáveis ao estado da arte nacional.
Palavras-chave: Índice de Sustentabilidade Empresarial. Estratégias Ambientais. Avaliação
Econômico-Financeira. Setor Energético
Abstract: Business companies have entered the sustainable development to achieve growth in the
market in which they operate and remain in the long term, as well as the generation of higher income. The objective of the present study is to correlate the environmental strategies as support for assessment and financial return of the Brazilian energy sector companies that are listed in the corporate sustainability Index (ISE) in the Bolsa de Valores Bovespa/BMF. For this correlation analysis, we used the Data Envelopment Analysis DEA, to perform the assessment of efficiency through the classic border and construction of a combined index ranking, with statistical analysis conducted by SPSS, with the data from the 10 companies in the energy sector used in the research. For analysis of environmental strategies, analyzed all the Yearbooks published, through a qualitative analysis. As a result, was raised a ranking of companies which presents the company Light S/A as the most efficient financial and environmental correlation. Is also a general survey of the main strategies
used by each company, in order to contribute to a sustainable actions alignment to the State of national art.
Keywords: Corporate sustainability index. Environmental Strategies. Economic and Financial
Valuation. Energetic Sector.
1 INTRODUCTION
Currently, companies are in an environment where their responsibilities go beyond its economic character. The concept of sustainability has been used increasingly to support the economic processes. In addition to the regulatory and social pressures and the pursuit of better institutional image, environmental pressures can be imposed on undertakings by shareholders, partners, internal and external clients, government agencies of environmental control that are more interested in the relationship between businesses and the environment.
With this, corporate environmental practices tend to become less environmental issue and more a matter of competitive strategy, marketing, finance, human relations, operational efficiency and product development. It is noted that the institutions, for various reasons, ranging from market interests to the survival of the planet, in General, are increasingly employing the term sustainability in the designation of their actions.
The relation between the economic and environmental questions are relatively recent studies. Several scholars, among them Gubiani et al. (2010), Figueiredo et al. (2012), Machado et al. (2012), develop theories that try to explain and predict situations, linked to the economic and environmental aspects within organizations. These situations, which with heavy use of natural resources, has provided the appearance of phenomena such as: global warming, disease, imbalance in rainfall, flooding, droughts and etc. Therefore mankind seeks, through intervention mechanisms, both as legal economic, reducing their environmental impacts, in order to redefine their processes and services and the search for do not generate negative financial impact for organizations.
Facing this, Carrol (2008), since the middle of last century, Corporate Social responsibility, has been a theme present in business and academic spheres. Over the years, various definitions have been proposed for CSR. However, there is no
consensus on a unified definition. Blowfield & Murray (2008) say what you mean with CSR is constantly changing because society itself evolves and that affects expectations vis-à-vis undertakings and their relationship with society.
The business environment plays an important role in ensuring preservation of the environment and in the definition of the quality of life for communities. Socially responsible companies, besides generating value for who's next, achieve better results for themselves (KRAEMER, 2004). Because of this, companies have gaining various benefits such as the recognition of its processes by clients and economic-financial valuation.
Coupled with the foregoing, the growing global awareness related to sustainability, argues Pätäri et al. (2012), is now requiring organizations to include sustainable development issues and the principles of sustainability into their business strategies of the Organization and thereby contribute to the sustainability of the environment.
Within the market, one of the indicators of better representativeness is the corporate sustainability Index-ISE, a scorecard coupled to Stock Exchange Bovespa which “seeks to create an investment environment compatible with the demands of sustainable development of contemporary society and stimulate the ethical responsibility of corporations.” (BM&FBovespa), specific to companies engaged in sustainable practices.
According to Ducassy (2013) numerous studies have been devoted to the connection between social responsibility and financial environmental performance, in order to determine, assuming the existence of a relationship, if the social/sustainable performance influences the financial performance or vice versa.
To highlight the importance of sustainability, Aras and Crowther (2010) identified him as one of four key aspects needed to sustain competitive advantage, coupled with profitability, reputation and good governance.
A sector quite recognized by sustainable actions is the energy sector, the highlight for this sector is due to its representation vis-à-vis the Brazilian economy and its ability to reinvent itself. One of the foundations of the economic sustainability
of a country is its ability to provide logistics and energy to the development of its production, safely and on competitive terms and environmentally sustainable.
In the energy area, Brazil is already cited as international reference in deepwater oil production, in the production of ethanol in its hydroelectric generation Park, in the exploitation of wind energy, exponential in its extensive and integrated electric power transmission system and, especially, in its renewability energy both as array of electric power production.
The ID of the Brazil energy and environmental world power these days is not an exaggeration. The country, in fact, is rich in alternatives of production from various sources. The supply of raw material and the large-scale production capacity are examples for various countries.
In 2020, it´s estimated that the electricity consumption will be 61% higher than the year of 2010, reaching 730 TWh. The domestic industry has an important role in this expansion, being responsible for 138 TWh of 277 TWh of additional electricity consumption during this period. However, the self-production of the industrial sector grows at rates higher than those of the electricity demand in this sector, which reduces the pressure of demand on supply expansion in the network of the electrical system. Another highlight refers to the residential sector. It is estimated that in 2017 the Brazil recover the maximum level of the average residential consumption achieved prior to the period of rationing (179 kWh/month, in 1998).
Thus, the assumption of the profile of socially responsible companies, is no longer an option, becoming a matter of strategic vision and, in most cases, survival in the market. Based on the perception about the importance acquired sustainable practices by companies, the aim of this study is to analyze and discuss the possible effects that the incorporation of environmental strategies of energy sector companies, listed in the corporate sustainability Index-ISE influence in economic and financial gains for companies and support for their development in the market, through the analysis of efficiency calculated by the DEA.
Were observed 11 energy companies listed on the ISE, which will be the basis of study since article that is configured in the development of the theoretical framework, addressing the three main pillars scientific - Sustainability, corporate
strategies and Brazilian energy matrix - tied then the business analysis methodology, the analysis of data and bibliography. Regarding the structure of the article, in the first section took place the presentation of the work, as well as the definition of the research problem, the rationale for the theme and objectives of the study.
The second section discusses the management concept of sustainability, corporate sustainability index (ISE) and the Brazilian energy sector in more detail, and gives an overview of previous studies that examined the relationship between the ISE and the financial performance of companies. Then describes the research project, and presents the results of this study. Continuing with the discussion on the main results and the last section concludes the article and gives some suggestions for future research.
2 LITERATURE REVIEW
The literature review includes 03 pillars as theoretical foundation: Sustainability Management, Corporate Sustainability Index, and the Electric Power Industry in Brazil.
2.1 Sustainability Management
The demand for sustainable development continues to increase. Enterprises face more and more economic as well as ecological and social challenges, as do their business partners (LEYH et al., 2014). The concept of sustainability or sustainable development has become popular worldwide since 1987, through the report our common future, prepared by the World Commission on environment and development of the United Nations (CMMAD, 1991). The term sustainability proposes that the activities performed by the man do not cause damage to generations to come and serve as a model for development. Currently, this concept has been the lynchpin of research conducted by multilateral bodies and, even, for large companies (CMMAD, 1991).
Consumers and ecological lobbies are requiring companies to implement cleaner production processes and „„green‟‟ products (SARMENTO et al., 2005). It is in this business environment that sustainability becomes the major challenge for companies in search of the strategy as a company engaged in this environment. Thus, sustainability will mean enlightened and disciplined management-which, by the way, is the most important factor that investors take into account and should be seen in their buying decisions.
According to Buffara (2003), the current moment points a new socioeconomic-environmental context and a new responsibility to be assumed. Thus, the social role of organizations has been redesigning more broadly and comprehensively, characterizing themselves as agents of transformation and of influence on society as a whole. Tan and Kraemer (2004) understand that the recognition of the social dimension requires demonstration instruments to be created of the acts and relevant values for society or for partners, the company (stakeholders) and not just the economic and financial results.
In this way, for companies that adopt this procedure, the Social balance and other types of reports, duly audited, allow entrepreneurs and to social actors identify, measure and act upon the social facts linked to the company, both internally and externally. With that, the companies that disseminate sustainability reports, its adoption is a fact and no chance (INSTITUTO ETHOS, 2002).
In this context includes companies in the energy sector that comes along the last decades causing changes of various kinds in the environment, mainly on water resources and forestry, due to the construction of new hydroelectric plants (ELETROBRAS, 2012). Utilities and licensees of electric energy, these being basic to the system of production and consumption of an entire economy, environment and social extract resources needed to carry out their economic activities (natural inputs, labor, basic infrastructure of cities), and to perform their services, promote social change, economic, cultural and technological change.
To configure the corporate performance against environmental strand, Miles and Covin (2000), dealing with the importance of environmental performance for the Group and corporate stakeholders resulting in the adoption by organizations of two
divergent models of environmental policy: the compliance model and the strategic model. The first suggests that organizations must merely comply with the applicable laws and regulations, and corporate environmental spending seen only as costs or fees for driving business and not as investments in the development of competitive advantage. The strategic model, in turn, see environmental spending as an investment and indicates that companies must have the ability to generate value for shareholders, consumers and other stakeholders, developing core-competences and using environmental strategies that create sustainable competitive advantage.
Under the same approach of Miles and Covin (2000), according to Gardetti (2002), it can be said that the debate on the relationship between corporate environmental response and the economic growth of the companies has always been based on two structures, the Win-Win (in which all parties win) and Win-Lose (gain on the one hand, on the other). The divergence between the Win-Win scenarios and Win-Lose is focused on companies that have real opportunities to improve processes through environmental protection and also the focus of the analysis.
On the interrelation between investments in the environmental area and the financial impact arising from adjustments to the process and the mitigation of the environmental impact of company, Klassen and McLaughlin (1996, p. 1202) presents the figure below showing the relationship between environmental management and corporate profitability.
Picture 1- Relationship between environmental management and Profitability of the
companhy
ENVIRONMENTAL MANAGEMENT
Products and Technologies of operation for minimizing the environmental impact
Consistente Environmental Management system Improvement of the Environmental Performance Market Gains Certification of Products and processes Scale Economy based on Experience Increasing in the Product Contribution Technology and Administrative Parctice Paterns Improvement in the Finantial Performance Hard Competitive Positionfor the costs
Diminuition
Prevention and environmental resposibility
Lower costs, penalties and time
directed to the healing
Reduction in the consume of material and energy
Better productivity C o st s R ed u ct io n M ar ke t Sl ic es G ai n in gs
Source: Klassen and McLaughlin (1996, p. 1202)
It is undeniable that the development and implementation of environmental management procedures require a systemic vision company/environment, which can trigger innovations and changes that generate products with environmentally-friendly features and more efficient processes, which can be promoted through marketing strategies. For businesses perhaps the biggest benefit is the formation of an image that become more attractive in the face of globalized market, giving them greater competitiveness. By the side of costs, companies that invest heavily in management systems and environmental protection can prevent future disasters, crises and environmental responsibilities, and minimize wasted materials costs and inefficient processes.
For an assessment and that may publicly disclose the social, environmental and economic performance, Fonseca (2010), indicates, increasingly known document called the "sustainability report". This trend has been driven in part by the
spread of the Global Reporting Initiative (GRI), a voluntary communication tool that uses the term sustainability to describe the disclosures about the dimensions of sustainable development. The sustainability report is now the norm, not the exception, among the largest companies in the world (KPMG, 2008).Soon, companies who walk in front of the regulations minimize the environmental impact of its products and processes, and are better positioned in front of future standards.
2.2 Enterprise Sustainability Index
According to the Fundação Getúlio Vargas (2011), the corporate sustainability index (ISE) is a tool for benchmarking the performance of companies listed on BM&FBovespa under the aspect of corporate sustainability, based on economic efficiency, environmental balance, social justice and governance. The ISE also aims to reflect the return of a portfolio composed of shares of companies with recognized commitment to social responsibility and corporate sustainability, and also act as a promoter of best practices in the business community.
The most important internationally recognized socially responsible indices are the KLD Domini 400 Social Index, which was the first to appear in 1990, the Dow Jones Sustainability Index Group and the FTSE4Good Index Series. Some others less well known include: the Calvert Social Index, Ethibel Sustainability Index, Ethical Index Management System, the ASPI family of indices (ARESE Sustainable Performance Indices) and the Citizens Index. (CHARLO et al., 2013)
According to Bovespa (2012), companies participating in the ISE portfolio, 100% commitment to sustainable development have formally entered in the strategy; 100% publish sustainability report, being that in 79% of the cases the report is an integral part of the main corporate report; 84% follow the guidelines of the Global Reporting Initiative (GRI), in this case, 97% publish this commitment in the area of free access of the website.
ISE aims to be composed of companies that excel in social responsibility and sustainability in the long term; and encourage good practices, with a benchmark of the performance of the shares of such company. (MACEDO et al., 2007)
The basic concept of ISE is the triple bottom line (TBL), introduced by British consulting firm Sustainability, which assesses economic elements-financial, social and environmental issues in an integrated manner. TBL's principles, criteria and indicators have been added to corporate governance, following the model of the Johannesburg stock exchange index, which gave rise to a fourth thematic group.
The four blocks are preceded by a group of general basic indicators and nature of the product. Between these indicators and general nature of the product include, for example, if the company publishes Social report or Sustainability, if endorsed the UN Global Compact and the consumption or use of the products of the company involve actual damage or risks to health, physical integrity or security of consumers, third parties or related to public health and safety.
The companies' responses are analyzed by a statistical tool called "cluster analysis", which identifies groups of enterprises with similar performances and points the group with better overall performance. The companies of this group will compose the final portfolio of ISE (which will have a maximum number of 40 companies), after approval by the Council.
The measurement and elaboration of environmental and sustainability reports, albeit with different profiles in the various countries, is known as a current strategic priority among the main private organizations worldwide, with increasing interest at the international level (RAMOS et al., 2013).
In this sense, companies are picking up new investors, began to spread beyond the mandatory information, additional information about business management and social and environmental responsibility actions. Voluntary information may be either non-financial financial in nature. (VALENTE et al., 2008).
Companies must disclose their environmental goals, risks and performance, because the diffusion of information is part of the process of managerial decision-making, the result of this decision-making process is most likely to be accepted by stakeholders affected if they have been included in this process through the provision of information relevant to their interests (and Kriklani, Andrikopoulos, N, 2013) in this heart, reports Scott and Quelhas (2006), the world is following a trend of appreciation of the concepts of sustainable development. In the financial market, the demand for
socially responsible investment (Sri) by investors has given the creation of stock indices, to identify companies that incorporate these concepts in various countries.
2.3 Brazilian Electric Power Industry
Since the 1990s, the Electric Power sector in Brazil has been the subject of a variety of reform initiatives that are changing the market structure and the energy price levels. In a global market and in the face of growing concerns about the environment, this influence is increasingly decisive.
One of the foundations of the economic sustainability of a Country is its ability to provide logistics and energy to the development of its production, safely and environmentally sustainable and competitive conditions. In this context, the savings that best position regarding access to energy resources of low cost and low environmental impact are important competitive advantages.
Brazil, is the world's tenth largest consumer of electricity, according to data from the International Energy Agency (IEA) and has an odd competitive condition in the electricity sector. The advantage of the national electric matrix in relation to other countries lies in the dominance of hydroelectricity, which besides being a renewable source, is generated by power plants with long service life.
According to a forecast from the International Energy Agency (2012), the electric energy demand in Brazil should grow at 78% by the year 2035.
And to meet this growth, the industry seeks to prepare, with the forecast of construction of 71 new hydropower plants until 2017, according to the National energy balance (2012), we can analyze in the figure below, the structuring of the Brazilian energy matrix in 2010/2011 demonstrates an increase in the production of electrical energy within a scenario of increasing the potential of technologies and expansion of renewable energy in the country.
Picture 2 - Brazilian Electric Array in 2011
Source: Brazilian Energetic Balance Sheet (2012)
The availability of power in conditions of adequate quantity and quality, at competitive costs, has been constituted in one of the most important prerequisites for the economic development of Nations. In view of this, the energy has been treated as a commodity of strategic nature, and not by chance that energy security has become one of the most relevant topics of the world agenda.
Obviously, all forms of energy production in some way affect, to varying degrees the environment because, all arising from the processing of natural resources. Renewable energies, even those considered environmentally clean, can also cause problems.
It seems clear that the issue cannot be solved by choosing the form of lesser impact, but rather by the balance between the positive and negative effects of each case. However, in this process of analysis, becomes increasingly relevant aspect of regional development associated with energy use, since the use of certain sources affects a certain space, but your benefit is received by other regions, generally distant from the source of that energy.
Given this, Brazil has the corporate sustainability Index - ISE coupled to BMF/Bovespa that sets forth the main Bovespa's ranking companies on the requirements of sustainability. The ISE portfolio/2013 is composed of 10 companies in the energy sector, which are broken down below: AES Tiete, CEMIG, CESP, COPEL, CPFL, COELCE, Eletropaulo, Eletrobrás, Light and Tractebel.
These companies stand out by the strong bias of environmental practices in their business models mainly in mitigating the environmental impacts generated by obtaining energy that greatly interfere in sustainable development, and the understanding of them is essential for the analysis of energy planning and project implementation. These companies dominate partly or wholly part of the electricity supply chain, which includes energy production, distribution and marketing the mains for the various sectors of the economy.
Worth pointing out that every form of energy, renewable or not, has positives and negatives, however the weights for each point must be assigned correctly for that planning be valid and really can mitigate environmental impacts. Meet them and quantifies them is essential for the sustainable business model.
3 RESEARCH METHODS
The data used in the research are related to the year of 2010 and 2011 and were obtained by means of the income statement and balance sheet of companies surveyed. Selected companies are the 10 electric utilities that make up the corporate sustainability index.
To end of analysis, we used the Data Envelopment Analysis (DEA) in order to establish a ranking based on efficiency of each organization (ADLER et al., 2002).
DEA methodology is composed of a number of programming models Linear used to identify the technical efficiency of production units borrowing decision (Decision Making Units - DMU). (TORRES JÚNIOR, LOPES, 2013)
In this process, the study is developed in two steps:
a) Application of DEA model classic to get the efficiency of each company's score. At this stage, the analysis focused on the conversion of inputs into outputs, to obtain an indicator of efficiency, in a cross-sectional analysis.
b) Calculating the combined index from the inverted and classical borders, capable of establishing a ranking that will benefit companies that have better performance in converting all the inputs in all its outputs, excluding from the efficient group those that exhibit excellent performance in only one variable.
3.1 Evaluation of the eficiency by means of the classic border
Based on linear programming, DEA is a non-parametric technique to measure the relative efficiency of a set of similar organizations, which differ in the arrangement of the inputs and outputs of its processes (EMROUZNEJAD; WITTER, 2010; JOO et al., 2011). This method does not indicate only the position of the companies efficient and inefficient, but also provides a parameter to increase the performance of inefficient companies facilitating the visualization of how these companies must evolve to achieve the performance of the benchmark companies the market (COOPER et al., 2007; COOK; SEIFORD, 2009).
Classic literature includes two basic models that are commonly used in applications. The first is the CRS (Constant Returns to Scale), introduced by Charnes et al. (1978), assumes constant returns to scale, that is, any variation in inputs produces proportional variation in the outputs of a DMU (Decision Marking Unit). The second is the VRS (Variable Returns to Scale), developed by Banker et al. (1984), and incorporate the concept of returns to scale variables DEA, assuming the units analyzed can adopt technologies with constant scale yields, increasing and decreasing.
These templates allow two types of guidelines: the input orientation, in which scores of efficiency are achieved by minimizing resources and inputs, given a constant level of production; and the output orientation, which seeks the maximization of the outputs, in a fixed amount of inputs (COOPER et al., 2007).
The DEA model used is oriented to results that maximize the outputs of the Electric Power Companies and considers returns of scale variables, as proposed by Banker et al. (2004), since they are considered different sized companies, and with this feature yields constant scale technologies, increasing and decreasing. For such conditions, the linear programming model used can be described as Expression 1.
Max 𝑧0− 𝜀 𝑠𝑗− 𝑚 𝑖=1 + 𝑠𝑟+ 𝑠 𝑟=1 Sujeito a: 𝑦𝑟𝑗𝜆𝑗 𝑛 𝑗 =1 − 𝑠𝑟+= 𝑦𝑟0𝑧0 𝑟 = 1, … , 𝑠 , 𝑥𝑖𝑗𝜆𝑗 𝑛 𝑗 =1 + 𝑠𝑗−= 𝑥 𝑖0 𝑖 = 1, … , 𝑚 , 𝜆𝑗 𝑛 𝑗 =1 = 1 𝜆𝑗, 𝑠𝑗−, 𝑠𝑟+≥ 0 ∀ 𝑖, 𝑟, 𝑗 , 𝑧0 irrestrito ( 1)
The coefficients yrj and xij, are, respectively, the outputs and inputs of known
organizations under review j (j = 1, ..., n), constant values, obtained through past observations, in decisions about the inputs i (i = 1, ..., m), resulting in a set r of outputs (r = 1, ..., s).
The reverse of the score of technical efficiency, output-oriented, is represented by z0; xi0 and yr0 are the quantities of the ith input and the r-th output,
respectively, presented by DMU 0 parsed; si- and sr+ are the slacks observed in
inputs and outputs; and λj represents the contribution of the DMU j to design efficient
border 0. As a tool to facilitate the use of the DEA, was employed Frontier software Analyst.
The data used for the analysis were the same used in the construction of the ranking of the Yearbook. Thus, the following variables were considered of inputs: i) owners' equity, representing here their sources of funds, for it being used as a proxy of what had been invested to accomplish your transformation process; and, ii) environmental Investments, which would be the permanent applications in order to bring positive results for the environment. As a result, outputs the following outputs were considered: i) financial income, adding the entire result of the productive process of the company.
Subject to:
3.2 Construction of the ranking through the Combined Index
Due to the need to address situations of a tie between efficient DMUs, fairly common in the classical models of data envelopment analysis (DEA), we used the principle of Reverse Border, introduced by Yamada et al. (1994) and Entani et al. (2002), which can be seen as a pessimistic assessment of productive units.
According to these principles, the more efficient it would be one DMU be able to produce a lot of all outputs and spend little of all the inputs. What makes efficient is more balanced performance when analyzed under the two perspective - classic border and border reversed. Therefore, the border search of delete inverted DMUs efficient those that exhibit excellent performance in only a single input or in just a single output, assisting in the selection of the most efficient among the DMU set analyzed, electing as the most efficient unit that you can have a more balanced performance, maximizing the production of all outputs, minimizing the use of all inputs.
According to Almeida et al. (2007), can systematize the combined index calculation between the classical boundaries and flipped through the following steps: It is solved the problem in the form of classic border, as the model that most suits the problem; Reverse the inputs and the outputs and is solved the problem of linear programming, following the same steps adopted with the classic border to find the efficiency. Will be found a value defined as the efficiency of DMUs Pessimist in analysis; Inverts the value of efficiency pessimistic found.
Because it is greater than 1, it is necessary a process standardization of application data in a range of zero to one. Thus, we obtain the border efficiency index Reversed;
Finally, it is estimated the combined indexes for each DMU, obtained by the arithmetic average of the scores of Classic Border efficiency and the inverted border. Com the adoption of analysis of inverted border it is possible to obtain a more reliable index to reality, called combined index and calculated on the basis of the original borders and reversed, that provides more adequately the effectiveness of units deemed proficient in math (YAMAKAWA; SASAKI, 2010).
Picture 2 systematizes the model adopted for the assessment of 10 national acting electric power companies, representing the relevant input and output variables in mathematical evaluation of the system, by means of the combination between the models of Classic Border and Inverted Border.
Picture 3 – Features and model variables to be used
Source: Authors (2014)
The scores combined efficiency, obtained as a result of the DEA model that considers the classical inverted border, were used as parameter for the construction of a new ranking. The ranking from these results was used to compare with the available in the database, in order to evaluate the inductive characteristics of subjectivity in rankings for the private insurance sector.
4 DATA ANALYSIS
In table 1 are listed the data needed for the analysis of the financial efficiency of the energy sector companies of ISE.
Table 1 – Data of input and output for analysis
Source: Data collected in companies‟ Sustainability Report
According to the table above, you can obtain that Eletrobrás is the company that invests most in environmental projects, investing around R $ 412,000 .00 for the years 2010/2011, seen its high performance in the market.
Right behind are COPEL's investments, this invested R$ 333,262. The company that, in two years, invested less in the environment was the Light S/A, this invested R $ 14,287.
With the data was studied regression analysis between the variables environmental investments and equity financial result. The empirical model to be determined follows a linear function, as expressed in Equation 2.
(2)
Where in β0 is the linear parameter and β1 and β2 are the slope, identifying
the marginal effect of Equity (EQ) and Environmental Investments (EI) over the Incomes (IN); and u represents the observed residual.
For the year 2010, estimating the parameters of interest, β0, β1 and β2 from the observed sample, by means of OLS, we obtain the results shown in Table 2.
Table 2 - Results of the parameters for the empirical model in 2010 E(βi) ep(βi) t P-valor
β0 -336,268 221,299 -1,519 0,179
β1 -0,007 0,007 -0,995 0,358
β2 0,002 0,002 1,03 0,342
This model shows that the marginal increase of EQ implies in reduction IN in -0.007; although, the marginal effect of variable EI carries on increasing the dependent variable IN in 0.002. We can, however, note that the parameters β0, β1 and β2 estimates are not statistically significant at any confidence level.
Table 3 presents the summary statistics of the empirical model 1. Starting the R², it is clear that only 18.2% of the variance is explained IN the dependent variables EI and EQ, with that, 81.8% of the variation in iN is contained in u. The residue standard error of σ around the regression 364.355, indicating a high dispersion of data around the estimated mean value.
Table 3 – Statistical Resume of the Empirical Model for 2010 Regression Statistics
R 0,428
R² 0,182
Σ 364,355
n 10
The analysis of variance (ANOVA) for the year 2010 is shown in Table 4. Can be seen that the regression isn´t significant at any confidence level, since the F statistic is 0.671.
Table 4 - ANOVA for the empirical model in 2010
SS MS F Significance F
Regression 178178,01 89089,01 0,671 0,546
Residual 796528,783 132754,8
Similarly to what was discussed in 2010, the same process is applied to the 2011 data. Estimating the parameters of interest, β0, β1 and β2 from the observed sample, through OLS, we obtain the results shown in Table 5, with the results for the year 2011.
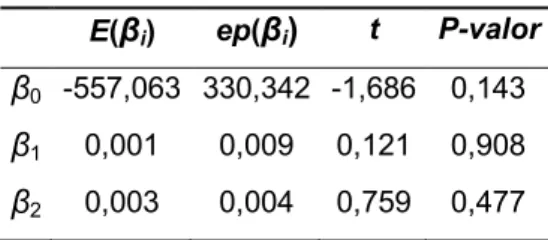
Table 5 - Results of the parameters for the empirical model in 2011
E(βi) ep(βi) t P-valor
β0 -557,063 330,342 -1,686 0,143
β1 0,001 0,009 0,121 0,908
β2 0,003 0,004 0,759 0,477
The results for the model in 2011 indicate both EI and EQ variables have a positive effect on the explained variable IN: marginal increase in EQ implies the increase IN in 0,001; while the marginal effect of variable EI carries on increasing the dependent variable IN in 0.003. However, the parameters β0, β1 and β2 estimates are not statistically significant at any confidence level.
Table 6 presents the summary statistics for the 2011 model year. Starting the R², it is clear that only 19.8% of the variance is explained IN the dependent variables EI and EQ, with this, 80.2% variation in iN is contained in u. The residue standard error of σ around the regression 446.07, indicating a high dispersion of data around the estimated mean value.
Table 6 – Statistical Resume of the Empirical Model for 2011 Regression Statistics
R 0,445
R² 0,198
σ 446,07
n 10
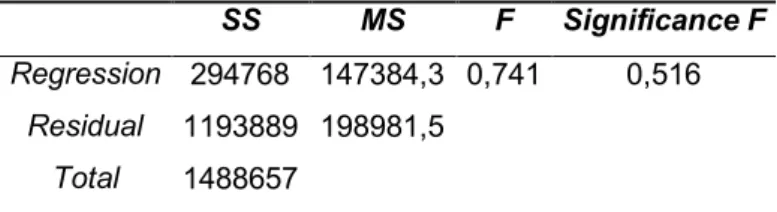
Finally, analysis of variance (ANOVA) for the year 2011 is shown in Table 7. Can be seen that the regression is significant at any confidence level, as is the F statistic of 0.741.
Table 7 - ANOVA for the empirical model in 2010
SS MS F Significance F
Regression 294768 147384,3 0,741 0,516
Residual 1193889 198981,5
Total 1488657
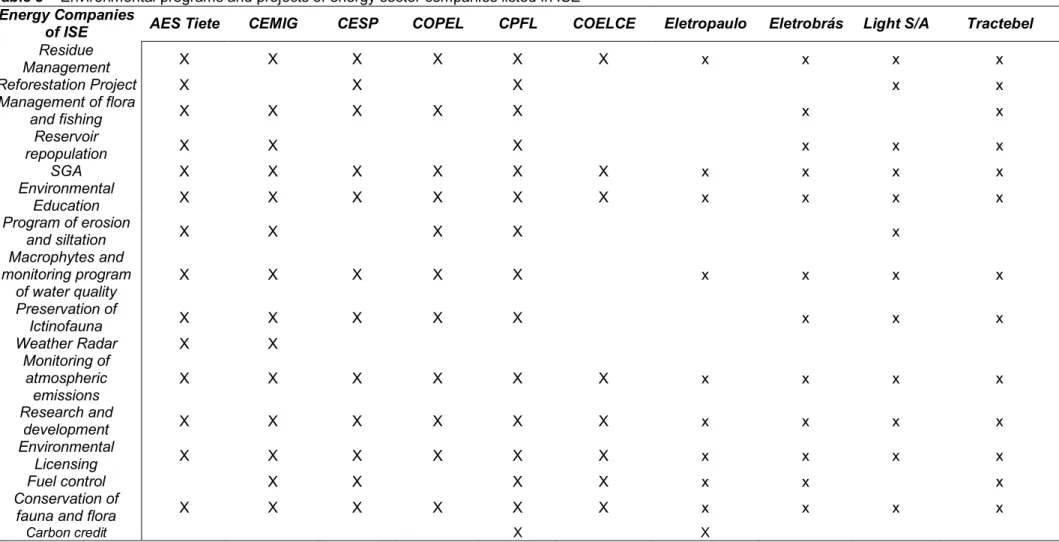
To this end, he researched the sustainability reports issued by companies which were the main investments and environmental costs, as can be seen in table 8. An exception can be made in this part of the article. The collection of these data has been difficult to build due to a lack of standardization of corporate reports.
Table 8 – Environmental programs and projects of energy sector companies listed in ISE Energy Companies
of ISE AES Tiete CEMIG CESP COPEL CPFL COELCE Eletropaulo Eletrobrás Light S/A Tractebel
Residue Management X X X X X X x x x x Reforestation Project X X X x x Management of flora and fishing X X X X X x x Reservoir repopulation X X X x x x SGA X X X X X X x x x x Environmental Education X X X X X X x x x x Program of erosion and siltation X X X X x Macrophytes and monitoring program of water quality X X X X X x x x x Preservation of Ictinofauna X X X X X x x x Weather Radar X X Monitoring of atmospheric emissions X X X X X X x x x x Research and development X X X X X X x x x x Environmental Licensing X X X X X X x x x x Fuel control X X X X x x x Conservation of
fauna and flora X X X X X X x x x x
Carbon credit X X
Realize that most organizations have a similar environmental performance chart, with the exception of a few differentiators. It is worth mentioning that as companies are listed on the ISE, these practices are properly documented and disseminated through sustainability reports and are effective for the company and society.
Even with the data of Table 1, efficiency analysis was carried out through the Frontier Analyst, in order to evaluate companies that best improved its balance sheet, i.e. the tool assists in identifying the companies that use its resources efficiently, in this particular case was combined the values of the balance sheet and investments in environment as inputs and financial revenue as output. From this, please find attached the data referring to the ranking, the classic border, the border and the inverted index of combination of the companies analyzed.
Table 9 – Financial Efficiency Analysis
This assessment of financial efficiency was made with the aim of finding out which company could maximize the value of financial results with the best combination between the environmental and equity investments.
As can be seen in the analysis of financial efficiency the company Light, despite investing less in environmental projects (see table 1), was the company that best honed his financial resources, and so was the most efficient. What this might represent?
The Light S/A can be more efficient in allocating its resources and have similar environmental benefits industry competitors. The analysis of classical border States that the AES tiete, COPEL, COELCE, Eletrobrás and Light S/A are the companies that best utilize their resources, however, when you analyze the border reversed, i.e. reversing the variables, one can obtain the Light S/A occupies the top ranking, were detected inefficiencies in other organizations.
5 FINAL CONSIDERATIONS
The relationship between environmental performance and financial performance is quite complex, and this study was not exhaustive. With respect to the objectives proposed for the work is doable assert that they were completed, to the extent that an assessment was developed, through the DEA financial efficiency of companies taking into consideration equity and amount of environmental investments. The method was shown to be able to assist in the responses of the proposed objectives, and respond to the research problem, to the extent that it is concluded that a guarantee of good environmental performance, but does not necessarily imply that financial improvements can occur.
One of the main difficulties of the research was the analysis of sustainability reports disclosed by the organizations. These do not follow a logical pattern of information which makes the comparison between them, so it would be a viable term of reference which establishes criteria for elaboration of these, as well as for dissemination of information, which hindered a deeper analysis and careful environmental practices adopted by companies.
This same conclusion was also singled out by Gubiani et al. (2010), Figueiredo et al. (2012), Machado et al. (2012) where it was reported that one considers unsatisfactory the level of disclosure of environmental companies of electricity at ISE, even with an increase of categories and subcategories.
Based on the perception about the importance acquired sustainable practices by companies, this work has met its overall objective to discuss how companies in
the energy sector, listed corporate sustainability index-ISE influence in economic and financial gains for companies as support for its development on the market.
Through the DEA methodology adopted for the analysis of corporate data, identified which companies have a greater correlation between investments in projects of environmental impact and its gains in the economic and financial field.
Even concluding that may not be significant relationships between the costs/environmental investments and financial gains in the energy sector companies that compose the ISE, is known as perception and fact, so-called sustainable companies generate greater value for shareholders in the long run, because they are more prepared to face economic, social and environmental risks.
In this sense one can see that most of the information disclosed assigns positive image to companies. Implement such concepts into reality and daily life of companies represents the main challenge encountered by enterprises and organizations engaged in the adoption, dissemination and positive transformation of your surroundings.
It is important to emphasize that the success of environmental policies is directly related to the development of an environmentally correct behavior awareness of all actors of society, and not just the financial aspect of the companies in the energy sector. Thus we must break the standards with which the society is accustomed and meet the challenges to the development of a more sustainable energy future.
Among the environmental costs of monitoring programs predominated impacts of its projects, environmental management system, followed by the inventory of greenhouse gas emissions and waste management.
It is believed that, above all, manage with social and environmental responsibility is the duty of the whole organization and can be compatible with effective, competitive and profitable business, since the company to act proactively, incorporating environmental issues in their business strategy, as well as conclude Silva (2002) and Karagozoglu and Lindell (2000).In this context, still prevail some questions, which may indicate opportunities for future research, such as: i) analyze environmental investments with other financial variables, such as: VSIPL, ROA,
ROE, ROS, etc. ii) companies in the energy sector that are not listed on the ISE has better financial performance than those listed in ISE?
REFERENCES
ADLER, N. et al. Review of ranking methods in the data envelopment analysis context. European Journal of Operational Research, v. 140, n. 2, p. 249–265, 2002. http://dx.doi.org/10.1016/S0377-2217(02)00068-1
ALMEIDA, M. R. et al. Análise de eficiência dos aeroportos internacionais brasileiros. In: Encontro Nacional de Engenharia de Produção, 27, Foz do Iguaçu, 2007. Anais
do XXVII ENEGEP. Rio de Janeiro: ABEPRO, 2007
ANDRIKOPOULOS, A., KRIKLANI, Nikoleta. Environmental Disclosure and Financial Characteristics of the Firm: The Case of Denmark. Corporate Social Responsibility
and Environmental Management, v. 20, 2013, p. 55-64.
http://dx.doi.org/10.1002/csr.1281
ARAS, G; CROWTHER, D. Sustaining business excellence. Total Quality
Management and Business Excellence, v. 21, n. 5, 2010, pgs. 565–576. Balanço Energético Brasileiro 2012. Disponível em:
<https://ben.epe.gov.br/downloads/Resultados_Pre_BEN_2012.pdf> Acessado em 26 de junho de 2013.
BANKER, R. D. et al. Returns to scale in different DEA models. European Journal
of Operational Research, v. 154, n. 2, 2004, p. 345-362.
http://dx.doi.org/10.1016/S0377-2217(03)00174-7
BAUMGARTNER, R. J.; WINTER, T. The Sustainability Manager: A Tool for Education and Training on Sustainability Management. Corporate Social
Responsibility and Environmental Management. doi: 10.1002/csr.1313, 2013.
http://dx.doi.org/10.1002/csr.1313
CAMARGO, A.S.G. et al. Proposta de definição de indicadores de sustentabilidade para geração de energia elétrica. Revista Educação e Tecnologia, Rio de Janeiro, n. 8, 2004, p. 51-60.
CHARNES, A. et al. Measuring efficiency of decision making units. European
Journal of Operational Research, v. 1, 1978, p. 429-444.
http://dx.doi.org/10.1016/0377-2217(78)90138-8
CHARLO, M. J.; MOYA, I.; MUÑOZ, A. M. Sustainable Development and Corporate Financial Performance: A Study Based on the FTSE4Good IBEX Index. Business
Strategy and the Environment, doi: 10.1002/bse.1824, 2013.
http://dx.doi.org/10.1002/bse.1824
COOK, W. D. & SEIFORD, L. M. Data envelopment analysis (DEA): Thirty years on.
European Journal of Operational Research, v. 192, 2009, p. 1-17.
COOPER, W. et al. Introduction to Data Envelopment Analysis and Its Uses: With DEA-Solver Software and References. New York: Springer, 2007.
http://dx.doi.org/10.1016/j.ejor.2008.01.032
Comissão Mundial sobre Meio Ambiente e Desenvolvimento (CMMAD). Nosso
futuro comum. 2 ed. Editora da Fundação Getulio Vargas: Rio de Janeiro, 1991.
DUCASSY, Isabelle. Does Corporate Social Responsibility Pay Off in Times of Crisis? An Alternate Perspective on the Relationship between Financial and Corporate Social Performance. Corporate Social Responsibility and
Environmental Management, v. 20, n. 3, 2013, p. 157–167.
http://dx.doi.org/10.1002/csr.1282
ENTANI, T. et al. Dual models of interval DEA and its extensions to interval data.
European Journal of Operational Research, v. 136, 2002, p. 32-45.
http://dx.doi.org/10.1016/S0377-2217(01)00055-8
FIGUEIREDO, M. A. G; ALVES, E. D. L; VECCHIA, F. Análise dos relatórios de sustentabilidade de empresas do setor enérgitico com ações na carteira do ISE – BOVESPA. In: Congresso Nacional de Excelência em Gestão, Rio de Janeiro, 8, 2012. Anais do VIII CNEG. Rio de Janeiro, 2012.
FONSECA, A. How credible are mining corporations‟ sustainability reports? A critical analysis of external assurance under the requirements of the International Council on Mining and Metals. Corporate Social Responsibility and Environmental
Management. v. 17, n. 6, 2010, p. 355-370. http://dx.doi.org/10.1002/csr.230
GUBIANI, C.A.; SANTOS, V; BEUREN, I.M. Informações ambientais evidenciadas pelas empresas do setor energético listadas no ISE. In: Simpósio de Administração da Produção, Logística e Operações Internacionais, 8, 2010. Anais do XIII SIMPOI. São Paulo: SIMPOI, 2010.
Índice de Sustentabilidade Empresarial. Disponível online em:
<http://www.bmfbovespa.com.br/indices/ResumoIndice.aspx?Indice=ISE&idioma=pt-br>. Acessado em: 29 abr 2013
JOO, S. J. et al. Benchmarking with data envelopment analysis: a return on asset perspective. Benchmarking: An International Journal, v. 18, n. 4, 2011, p. 529-542.
KARAGOZOGLU, N.; LINDELL, M. Environmental management: testing the win-win model. Journal of Environmental Planning and Management, v. 43, n. 6, 2000, p. 817-829. http://dx.doi.org/10.1080/09640560020001700
KLASSEN, R. D.; McLaughlin, C. P. The impact of environmental management on firm performance. Management Science, v. 42, n. 8, 1996, p. 1199-1214.
KPMG International Survey of Corporate Responsibility Reporting 2008. KPMG
Sustainability Services: Amstelveen, 2008.
http://dx.doi.org/10.1287/mnsc.42.8.1199
MACEDO, M. A. S.; SOUSA, A. C.; SOUSA, A. C. C.; CÍPOLA, F. C. Socially Responsible Companies Performance: An analysis with financial and accounting ratios. Edição especial/dez 2007.
LEYH, C.; MATTEO, R.; MARIO, D. Sustainability management and its software support in selected Italian enterprises. Computers in Industry, v. 65, 2004, p. 386-392. http://dx.doi.org/10.1016/j.compind.2014.01.005
MACHADO, M. A. V.; MACEDO, M. A. S.; SIQUEIRA, J. R. M. Análise da relação entre investimentos socioambientais e a inclusão de empresas no Índice de Sustentabilidade Empresarial - (ISE) da BM&Fbovespa. Revista de Ciência da
Administração, v. 14, n. 32, 2012.
O Setor elétrico Brasileiro e a Sustentabilidade no Século 21: Oportunidades e
desafios / ed. Paula Franco Moreira - Brasília: rios internacionais - Brasil, 2012 PÄTÄRI, S.; JANTUNEN, A.; KYLÄHEIKO, K.; SANDSTRÖM, J. Does Sustainable Development Foster Value Creation? Empirical Evidence from the Global Energy Industry. Corporate Social Responsibility and Environmental Management, v. 19, n. 6, 2012, p. 317-326. http://dx.doi.org/10.1002/csr.280
RAMOS, T.B. et al. Corporate sustainability reporting and the relations with
evaluation and management frameworks: the Portuguese case, Journal of Cleaner
Production, 2013. http://dx.doi.org/10.1016/j.jclepro.2013.03.002
ROVER, S.; MURCIA, F. D.; BORBA, J. A. Divulgação de informações ambientais nas demonstrações contábeis: um estudo exploratório sobre o disclosure das empresas brasileiras pertencentes a setores de alto impacto ambiental. In: Congresso ANPCONT, 2, 2008, Salvador. II Anais do ANPCONT. São Paulo: ANPCONT, 2008.
SARMENTO, M.; DURÃO, D.; DUARTE, M. Study of enviromental sustainability: The case of Portuguese polluting industries. Energy, v. 30, 2005, p. 1247-1257.
http://dx.doi.org/10.1016/j.energy.2004.02.006
SILVA, A. A. (2002). A estratégia empresarial e o gerenciamento dos riscos
Assemblea Consejo Latinoamericano de Escuelas de Administración - CLADEA, Porto Alegre, RS, Brasil 37.
SILVA, A.; LIMA, J. T. G. P; CABRAL, A. C. A; SANTOS, S. M.; PESSOA, M. N. M. Corporate Social Responsability: Analysis of the relationship between net income and social and environmental investiments os PETROBRAS. Revista Produção
Online, v. 13, 2013, p.108-133. http://dx.doi.org/10.14488/1676-1901.v13i1.1057
TOLMASQUIM, M. T., GUERREIRO, A.; GORINI, R. Matriz energética brasileira: uma prospectiva. Novos estudos - CEBRAP, no.79, 2007, p.47-69.
TORRES JUNIOR, N.; LOPES, A. L. M. Productivity in services: A systematic review.
Revista Produção Online, V. 13, n.1, 2013,
p.318-350. http://dx.doi.org/10.14488/1676-1901.v13i1.1164
VAZ, A. C. et al. Análise comparativa sobre informações voluntárias
divulgadas: o social disclosure das empresas latino-americanas listadas na Nyse. In: Encontro da Associação Nacional de Pós-Graduação e Pesquisa em
Administração, 32, 2008, Rio de Janeiro. Anais do XXXII ENANPAD. Rio de Janeiro: ANPAD, 2008.
World Commission on Environment and Development (WCED). Our common
future. Oxford: Oxford University Press, 1987.
YAMADA, Y. et al. New analysis of efficiency based on DEA. Journal of the
Operations Research Society of Japan, v. 37, 1994, p. 158-67.
YAMAKAWA, E.; SASAKI, T. A method for classification of decision-making units using dea and inverted dea with scale efficiency. Technology Reports of Kansai
University, v. 52, 2010, p. 83-91.
Artigo recebido em 27/11/2013 e aceito para publicação em 31/03/2014 DOI: http://dx.doi.org/ 10.14488/1676-1901.v14i4.1709