UM
inho | 20
14
Fábio José dos Sant
os T
rigo
The ph
ysiology and biochemis
tr
y of Me
th
y
lacidiphilum fumariolicum SolV
Universidade do Minho
Escola de Ciencias
Fábio José dos Santos Trigo
The physiology and biochemistry of
Methylacidiphilum fumariolicum SolV
Fábio José dos Santos Trigo
The physiology and biochemistry of
Methylacidiphilum fumariolicum SolV
October 2014
Master Thesis
Master Degree in Molecular Genetics
Work conducted under the supervision of
Dr. Huub Op den Camp
and
Professora Doutora Ana Preto
Universidade do Minho
Escola de Ciencias
DECLARAÇÃO
Nome: Fábio José dos Santos Trigo
Endereço eletrónico: fabio.j.trigo@hotmail.com Telefone: 910548706
Número de identificação civil: 13778602
Título da Tese de Mestrado: The physiology and biochemistry of Methylacidiphilum
fumariolicum SolV
Orientador: Dr. Huub Op den Camp
Co-orientadora: Professora Doutora Ana Preto
Instituição de acolhimento: Microbiology Department Radboud University Nijmegen Ano de conclusão: 2014
Designação do mestrado: Mestrado em Genética Molecular
1. É AUTORIZADA A REPRODUÇÃO INTEGRAL DESTA TESE, APENAS PARA EFEITOS DE INVESTIGAÇÃO MEDIANTE DECLARAÇÃO ESCRITA DO INTERESSADO QUE A TAL SE COMPROMETE.
Universidade do Minho, 31 de Outubro de 2014
iii
ACKNOWLEDGMENTS
I would like to thank Prof. Huub for being such a supportive supervisor over the last year.
I am thankful for his teachings, his dedication, and most of all, for his friendship. To Mike I would like to thank for all the support, kindness, the funny moments and the wonderful parties at the microbiology corner he has provided during my stay at his lab. I am grateful to all my lab colleagues and friends at the student corner for all the help and good company they have been giving me since I first joined the lab.
To everyone in Mike's lab, thank you for welcoming me in such a great spirit.
A special reference to Arjan and Sepher for their wisdom and for helping and explaining me whenever I needed.
To my housemates in Vossenveld thank you for making my stay in Nijmegen so joyful. I am most grateful to all my friends whose company has been so important over all these years and a special thanks for all my friends that visited me in Holland.
A special appreciation to my family, of course, whose caring and support have been an essential constant in my life.
Finally, thank you Nanda for giving me strength over this past year and for being always there for me...
iv
ABSTRACT
“Methylacidiphilum fumariolicum” SolV is a verrucomicrobial methanotroph that can grow in extremely acidic environments at high temperature. In this study the nitrosative stress on strain SolV was investigated using batch cultivations. Nitrite production was measured at different ammonium concentrations under methane concentrations in a range of 0 to 3%. In this study we found that SolV can use ammonium when methane is limited. The second part of this study is the growth of this strain SolV on higher alkanes such as ethane, propane and butane. Strain SolV has three
pmoCAB operons and one of these operons was not expressed while growing on
methane. Therefore, it was hypothesized that the third operon might be expressed under growth conditions in the presence of higher alkanes. Thus, studies on higher alkanes (ethane and propane) were performed. Strain SolV can grow on both alkanes but further experiments and optimizations are necessary.
v
RESUMO
“Methylacidiphilum fumariolicum” SolV é um metanotrofo verrucomicrobial que cresce em ambientes extremamente ácidos a uma temperature elevada. Neste estudo o nitrossative stress na estirpe SolV foi investigada usando cultivações batch. A produção de nitrito foi medida em diferentes concentrações de amónio sob diferentes concentrações de metano numa gama de 0 a 3%. Neste estudo descobrimos que SolV pode consumir amónio quando metano é limitado.
A segunda parte deste estudo é o crescimento desta estirpe SolV em alcanos superiores tais como etano, propano e butano. A estirpe SolV tem três operões pmoCAB e um destes operões não foi expresso durante o crescimento em metano. Portanto, foi hipotetizado que o terceiro operão poderia ser expresso sob condições de crescimento na presença de alkanos superiores. Assim, estudos em alkanos superiores (etano e propano) foram realizados. A estirpe SolV cresce em ambos os alkanos mas futuras experiências e optimizações são necessárias.
vi
TABLE OF CONTENTS
ACKNOWLEDGMENTS _______________________________________________ iii ABSTRACT __________________________________________________________ iv RESUMO _____________________________________________________________ v LIST OF ABBREVIATIONS ___________________________________________ viii LIST OF FIGURES ___________________________________________________ ix 1-INTRODUCTION ________________________________________________ 12 1.1-Methane______________________________________________________ 12 1.2-Methanotrophs ________________________________________________ 13 1.2.1-Anaerobic methanotrophs ____________________________________ 13 1.2.2-Aerobic methanotrophs ______________________________________ 14 1.3-The discovery of the aerobic verrucomicrobial methanotrophs ___________ 16 1.4 - proteobacterial vs. verrucomicrobial methanotrophs __________________ 18
1.4.1 - Energy metabolism in aerobic methanotrophs ___________________ 18
1.4.2- Methane oxidation pathway __________________________________ 19
1.4.2.1-Methane oxidation _____________________________________ 19 1.4.2.2-Methanol oxidation _____________________________________ 20 1.4.2.3-Formaldehyde oxidation _________________________________ 21 1.4.2.4-Formate oxidation ______________________________________ 21 1.4.2.5-Carbon assimilation ____________________________________ 22 1.5-Objectives ____________________________________________________ 23
2-MATERIALS & METHODS _______________________________________ 25
2.1-Microorganism ________________________________________________ 25 2.2-Medium composition for growth __________________________________ 25 2.3-Ammonium determination _______________________________________ 25 2.4-Nitrite determination ____________________________________________ 25 2.5-Gas analyses __________________________________________________ 26 2.6-Batch cultivation _______________________________________________ 26 2.7-Chemostat cultivation ___________________________________________ 26 3-RESULTS _______________________________________________________ 29
3.1-Ammonium conversion to nitrite in batch experiments _________________ 29 3.2-Growth on higher alkanes in batch experiments _______________________ 35
4-DISCUSSION ____________________________________________________ 40 5-CONCLUSION & OUTLOOK _____________________________________ 44 6-REFERENCE LIST ______________________________________________ 46
vii 7-SUPPLEMENTARY INFORMATION ______________________________ 55 7.1-Appendix I ___________________________________________________ 55 7.2-Appendix II ___________________________________________________ 57 7.3-Appendix III __________________________________________________ 59 7.4-Appendix IV __________________________________________________ 60 7.5-Appendix V ___________________________________________________ 61
viii
LIST OF ABBREVIATIONS
CH4 Methane OH. Hydroxyl radical NOx Nitrogen oxides CH2O Formaldehyde O3 Ozone CO Carbon monoxide N-damo nitrite-driven anaerobic methane oxidation O2 Oxygen
RuMP ribulose monophosphate pathway
RuBisCO 1,5 bisphosphate carboxylase/oxygenase CH3OH Methanol
H2O Water
CHOOH Formate
NAD Nicotinamide adenine dinucleotide ATP Adenosine-5'-triphosphate
FDH Formate dehydrogenase MMO Methane monooxygenase AMO Ammonia monooxygenase
pMMO Particulate methane monooxygenase sMMO Soluble methane monooxygenase MDH Methanol dehydrogenase
FADH Formaldehyde dehydrogenase CO2 Carbon dioxide
CBB Calvin-Benson-Bassham N2 Nitrogen
ICP-MS Inductively coupled plasma mass spectrometry CH3SH Methanethiol
NH4+ Ammonium
NH2OH Hydroxylamine
ix
LIST OF FIGURES
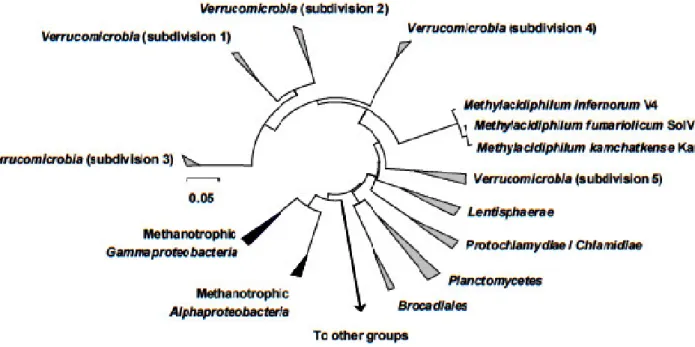
Figure 1 - Phylogenetic tree showing the position of the verrucomicrobial aerobic
methanotrophs (strains V4, SolV and Kam1) relative to the proteobacterial aerobic methanotrophs (modified from Op den Camp et al. (2009))………...17
Figure 2 - (A) Transmission electron micrograph of type I (scale bar, 1 μm) and (B) type II (scale bar, 200 nm) proteobacterial aerobic methanotrophs, showing the discshaped and the parallel membranes in these microorganisms, respectively. (C) In Methylacidiphilum fumariolicum strain SolV circular bodies of about 50-70 nm were observed (scale bar, 200 nm). Pictures were modified from Kip et al. (2011) and Pol et al. (2007)………..…18
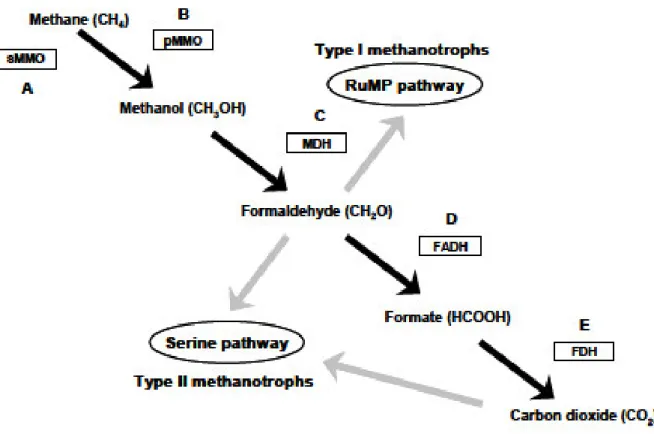
Figure 3 - Established pathways for the oxidation of methane (black arrows) and
assimilation of formaldehyde (grey arrows) in type I and type II proteobacterial aerobic methanotrophs (modified from Hanson & Hanson, 1996). The enzymes involved in methane oxidation are indicated within the boxes. (A) The soluble methane monooxygenase (sMMO). (B) The particulate methane monooxygenase (pMMO). (C) The methanol dehydrogenase (MDH). (D) The formaldehyde dehydrogenase (FADH). (E) The formate dehydrogenase (FDH). The formaldehyde, produced during the oxidation of methane can be assimilated via the serine pathway or the ribulose monophosphate (RuMP) pathway (adapted from khadem PhD thesis)………..20
Figure 4 - SolV Incubations with 0.5 mM NH4+. (A) Incubation with no CH4, (B)
incubations with 0.5% CH4, (C) incubations with 1% CH4, (D) incubations with 2%
CH4, (E) incubations with 3% CH4……….…30
Figure 5 - SolV Incubations with 1 mM NH4+. (A) Incubation with no CH4, (B)
incubations with 0.5% CH4, (C) incubations with 1% CH4, (D) incubations with 2%
x Figure 6 - SolV Incubations with 2 mM NH4+. (A) Incubation with no CH4, (B)
incubations with 0.5% CH4, (C) incubations with 1% CH4, (D) incubations with 2%
CH4, (E) incubations with 3% CH4……….32
Figure 7 - SolV Incubations with 5 mM NH4+. (A) Incubation with no CH4, (B)
incubations with 0.5% CH4, (C) incubations with 1% CH4, (D) incubations with 2%
CH4, (E) incubations with 3% CH4……….33
Figure 8 - SolV Incubations with 8 mM NH4+. (A) Incubation with no CH4, (B)
incubations with 0.5% CH4, (C) incubations with 1% CH4, (D) incubations with 2%
CH4, (E) incubations with 3% CH4……….34
Figure 9 - SolV Incubations with 16 mM NH4+. (A) Incubation with no CH4, (B)
incubations with 0.5% CH4, (C) incubations with 1% CH4, (D) incubations with 2%
CH4, (E) incubations with 3% CH4……….35
Figure 10 -Incubation of SolV with natural gas containing methane and ethane at
different concentrations. Observation of growth (blue squares) and methane (red squares) and ethane (green triangles) consumption……….36
Figure 11 - Incubation of SolV with 2% methane and 5% ethane. Observation of
growth (blue squares) and methane (red squares) and ethane (green triangles) consumption……….37
Figure 12 - Incubation of SolV with 2% methane and 5% propane. Observation of
growth (blue squares) and methane (red squares) and propane (green triangles) consumption……….37
Figure 13 - Incubation of SolV with 5% propane. Observation of growth (green
12
1-INTRODUCTION
1.1-Methane
Methane (CH4) is a very important fossil fuel for both households and industry.
Methane is known as the second most important greenhouse gas and it contributes up to 20 % of the greenhouse effect. In addition, methane is approximately 30 times more effective than CO2 as a greenhouse gas on a 100 year-scale indicating the importance of
its study as a powerful climate affecting gas in the atmosphere (Forster et al., 2007; Houghton et al., 1996; Denman et al., 2007; Shindell et al., 2009).
The concentration of methane in the atmosphere has been greatly increased over the last 200 years due to the activity of mankind. Recently the report of the Intergovernmental Panel on Climate Change indicates that the methane concentration in atmosphere has been decreased during the last 5 years (Singh, 2011). It is not known if the decrease of the methane in the atmosphere is caused by a decline in emission or an increase in methane sink activities.
The biogenic methane produced by Archaea under anoxic conditions during decomposition of organic matter is up to 80% and it is emitted from anthropogenic activities (landfills, rice paddy fields and coal mining) and natural ecosystems (ruminants, wetlands and termites) (Conrad, 2009; Etiope et al., 2011; Schink, 1997; Thauer, 1998). Due to the global warming concern, it is important to study the sinks and sources of methane.
The remaining part of the methane emission comes from thermal decomposition of organic matter (> 80 °C) within the Earth's crust by which methane is expelled to the atmosphere from geothermal areas such as mud volcanoes, mud pots, fumaroles and seeps. (Conrad, 2009; Etiope & Klusman, 2002; Etiope et al., 2011).
These environments add up to 70 Tg methane emission per year in a total of 600 Tg per year (Castaldi & Tedesco, 2005; Kvenvolden & Rogers, 2005), though these emissions need to be quantified more accurately (Etiope & Klusman, 2002). All methane does not reach the atmosphere, because a large part is oxidized by anaerobic and aerobic methane-oxidizing bacteria which are called methanotrophs. These microorganisms are the central engine to keep the methane balance on the earth. The
13
methane that escapes from the oxidation of methanotrophs is oxidized in the troposphere by the hydroxyl radical (OH.) that is the major radical in this layer of the
atmosphere forming water vapor and carbon dioxide. In the presence of high levels of nitrogen oxides (NOx), methane oxidation with the hydroxyl radical leads to the
formation of formaldehyde (CH2O), ozone (O3) and carbon monoxide (CO). Through
this reaction the removal of methane is around 490 Tg per year. Thus the hydroxyl radical is the most important factor that removes methane from the atmosphere (Houweling et al., 1999; Khalil & Shearer, 2000; Lelieveld et al., 1998; Moss et al., 2000).
Recent studies showed that volcanoes act as important methane sinks by the activity of aerobic verrucomicrobial methanotrophs and their methane oxidation. They were isolated independently from volcanic regions in Russia, New Zealand and Italy (Dunfield et al., 2007; Islam et al., 2008; Pol et al., 2007). In this study, we concentrate on Methylacidiphilum fumariolicum SolV the recently isolated aerobic methanotroph from a volcanic region near Naples in Italy (Pol et al. 2007).
1.2-Methanotrophs
1.2.1-Anaerobic methanotrophs
Methane-oxidizing archaea and sulfate-reducing bacteria together perform anaerobic oxidation of methane (Boetius et al., 2000; Valentine & Reeburgh, 2000). Furthermore, this process can be performed by nitrite-reducing bacteria (Ettwig et al., 2008; Raghoebarsing et al., 2006).
Despite evidence for sulfate-driven methane oxidation from profile analysis in anoxic organic rich sediments (Barnes & Goldberg, 1976; Martens & Berner, 1974; Reeburgh, 1976) the process was controversial for some time because neither responsible microorganisms nor mechanisms could be identified. It has been shown that sulfate-reducing bacteria and anaerobic methanotrophic archaea perform this process in deep sea environments (Boetius et al., 2000).
First report on nitrite-driven anaerobic methane oxidation (n-damo) hypothesized that a consortium of archaea conducting reverse methanogenesis was
14
affiliated with a denitrifying bacterial partner (Raghoebarsing et al., 2006). Thereafter, it has been shown that the bacterial partner could complete the process independently (Ettwig et al., 2008), and the bacterium responsible for the n-damo process belongs to the division ‘NC10’ (Rappe & Giovannoni, 2003).
In anoxic environments the n-damo process follows a classical aerobic methane oxidation pathway (Ettwig et al., 2010). It has been shown that ‘Candidatus Methylomirabilis oxyfera’ has a unique ability to produce intracellular oxygen through a denitrification pathway. Geochemical evidences exist for iron (III)-driven anaerobic methane oxidation as a thermodynamically favorable process (Beal et al., 2009; Sivan
et al., 2007; Zehnder & Brock, 1980). Recent geochemical studies indicate that this
process occurs in deep ocean sediments being located below a depth of 25-cm, which is deeper than the location where sulfate and nitrate are available as well as the zone of methanogenesis (Sivan et al., 2011).
1.2.2-Aerobic methanotrophs
The aerobic methanotrophs among the methylotrophs form a unique group of microorganisms, because they utilize methane as the only source of carbon and energy (Hanson & Hanson, 1996). Thus far 18 genera of aerobic methanotrophs have been described within the bacterial phylum Proteobacteria and these proteobacterial methanotrophs are divided into two subphyla, the Gamma and Alpha proteobacteria.
The methanotrophic members of the Gammaproteobacteria (type I methanotrophs) are represented by the family Methylococcaeae and the methanotrophic members of the Alphaproteobacteria (type II methanotrophs) are represented by two families, the Methylocystaceae and the Beijerinckiaceae.
The type I and II of methanotrophs are categorized based on their internal membrane structure (ultrastructure), phylogeny (Gammaproteobacteria versus
Alphaproteobacteria), cell morphology, the dominant phospholipid fatty acids (18C
versus 16C) and the metabolic pathways used for biomass production (serine pathway versus ribulose monophosphate (RuMP) pathway (Chistoserdova, 2011; Chistoserdova
et al., 2009; Hanson & Hanson, 1996). The terms type I and II methanotrophs are now
synonyms of Gammaproteobacteria and Alphaproteobacteria. (Op den Camp et al., 2009). The family Methyolococcaceae of the Gammaproteobacteria contains the most genera of the proteobacterial methanotrophs, but not all the genera fit to this family, for
15
example Methylohalobius and Methylothermus are classified in this family but analysis of the 16S ribosomal RNA and pmoA genes demonstrate that these microorganisms may not be monophyletic with this family (Heyer et al., 2005; Tsubota et al., 2005).
Another example is the family Crenotrichaceae (Crenothrix and Clonothrix), which is validated but it is phylogenetically a subset of the Methylococcaceae (Op den Camp et al., 2009; Stoecker et al., 2006; Vigliotta et al., 2007).
Aerobic proteobacterial methanotrophs are microorganisms that are widespread in nature and man-made environments such as marine and fresh waters, sediments, landfills, rice paddies and soils where they consume up to 90% of the methane produced by methanogenic archaea in the anoxic zones of these environments after the organic matter is degraded anaerobically (Segers, 1998).
These microorganisms are also found in symbiosis with marine invertebrates (the sponge Cladorhiza methanophila, the hydrothermal vent snails tubeworms of the
Siboglinum genus, Ifremeria nautilei and Alviniconcha hessleri, and deep-sea
bathymodiolin mussels of two genera, Idas and Bathymodiolus) at hydrothermal vents and cold fonts in the deep Sea (Petersen & Dubilier, 2009).
Physiological experiments using labeled methane in whole animals or tissues containing the methanotrophic symbionts, 16S ribosomal RNA analysis, activity assays with crucial enzymes of the methane oxidation pathway and ultrastructure analysis of the internal cytoplasmic membrane system are various methods used to demonstrate that symbionts are methanotrophs.
Thus far, only type I methanotrophs appear to be involved in the symbiosis with marine invertebrates and that may be caused by the efficiency of the RuMP pathway used for carbon assimilation. On the other hand the serine pathway used by type II methanotrophs is less efficient (Leak et al., 1985).
Marine invertebrate fully rely on their symbiont for most or even all their carbon and energy needs, so it is advantageous for them to be in association with type I methanotrophs.
Type II methanotrophs are found in association with wetland plants (Raghoebarsing et al., 2005). These plants are autotrophs. Thus these associations with type II methanotrophs supply plants only around 15% of the cellular carbon, because the dependence for their organic carbon is much lower.
16 1.3-The discovery of the aerobic verrucomicrobial methanotrophs
Mesophils and neutrophils are the most known genera within the aerobic proteobacterial methanotrophs and the only exceptions are the Methylothermus,
Methylococcus and Methylocaldum genera that are found in geothermal springs where
the optimal growth temperatures were reported in a range of 45-58ºC.
There are reports on Methylocystis, Methylocapsa, Methylocella and
Methyloferula which are mild acidophilic genera that are abundant in peatlands, and
these microorganisms grow at pH between 3.5 to 7.5 (Dedysh et al., 2000; Dedysh et
al., 2002; Dedysh et al., 2007; Trotsenko & Khmelenina, 2002; Tsubota et al., 2005;
Vorobev et al., 2011). A report of geothermal areas shows that a significant amount of methane is consumed in areas with high temperatures (50-95ºC) and very low pH (below 1.8) (Castaldi & Tedesco, 2005), which indicates methanotrophy under more extreme conditions.
In late 2007 to early 2008, this geological evidence was supported and validated by three independent isolations of novel aerobic methane oxidizing bacteria in pure cultures from volcanic regions (Dunfield et al., 2007; Islam et al., 2008; Pol et al., 2007). These three cultures were isolated from the Hell's Gate, Tikitere (New Zealand), the Uzon Caldera, Kamchatka, (Russia) and Solfatara at Pozzuoli near Naples (Italy).
Based on 16S ribosomal RNA gene sequences, all the three strains isolates (V4, Kam1, and SolV) could be identified as members of the Verrucomicrobia phylum and they belong to a single genus for which the name Methylacidiphilum was proposed (Op den Camp et al., 2009; Fig.1).
17
Environmental clone libraries show a large biodiversity in Verrucomicrobia and their presence in many ecosystems (landfill leachate, acid rock drainage, soils and peat bogs), often in relative high numbers and most members remain uncultivated and their physiology is not well understood (Wagner & Horn, 2006). This was the first time that the widely distributed Verrucomicrobia phylum was associated to a geochemical cycle.
A complete genome sequence was published for Methylacidiphilum infernorum strain V4 (Hou et al., 2008) and a draft genome was available for Methylacidiphilum
fumariolicum strain SolV (Op den Camp et al., 2009; Pol et al., 2007) and this was
added to the several verrucomicrobial genome assemblies (van Passel et al., 2011). Preliminary studies of Methylacidiphilum strains (V4, SolV and Kam1) indicated some similarities but also differences with the proteobacterial aerobic methanotrophs such as carbon dioxide fixation pathways and distinct enzymes of the methane oxidation.
It was observed that Methylacidiphilum strain has circular bodies of 50-70 nm (Fig.2) instead of stacked membrane structures characteristics for methanotrophs
Figure 1 - Phylogenetic tree showing the position of the verrucomicrobial aerobic methanotrophs (strains V4, SolV and
18
expressing particulate methane monooxygenase. Afterwards, it was hypothesized that these circular bodies in Methylacidiphilum strain may be compared with carboxysomes or novel subcellular compartments for methane oxidation (Islam et al., 2008; Op den Camp et al., 2009). These carboxysomes are compartments that are found in cyanobacteria and in a limited numbers of chemoautotrophs and thought to enhance carbon fixation by increasing its level for the enzyme ribulose-1,5-bisphosphate carboxylase/oxygenase (RuBisCO), which has a low affinity for carbon dioxide (Yeates
et al., 2008).
1.4 - proteobacterial vs. verrucomicrobial methanotrophs
1.4.1 - Energy metabolism in aerobic methanotrophs
The chemical equation of CH4 + 2 O2 → CO2 + 2 H2O indicates the aerobic oxidation
of methane. During this oxidation, energy is obtained at the level of methanol (CH3OH),
formaldehyde (CH2O) and formate (CHOOH) oxidation (Fig. 3) (Chistoserdova et al.,
2009; Hanson & Hanson, 1996).
Figure 2 - (A) Transmission electron micrograph of type I (scale bar, 1 μm) and (B) type II (scale bar, 200 nm)
proteobacterial aerobic methanotrophs, showing the discshaped and the parallel membranes in these microorganisms, respectively. (C) In Methylacidiphilum fumariolicum strain SolV circular bodies of about 50-70 nm were observed (scale bar, 200 nm). Pictures were modified from Kip et al. (2011) and Pol et al. (2007).
19 1.4.2- Methane oxidation pathway
1.4.2.1-Methane oxidation
The first step in the methane oxidation pathway is the conversion of methane to methanol by methane monooxygenase (MMO). It is known that Proteobacterial aerobic methanotrophs have two distinct forms of this enzyme; the particulate membrane-associated form (pMMO, cytochrome c dependent) and the soluble cytoplasmic form (sMMO, NADH-dependent; figs.3B and 3A; Hanson & Hanson, 1996). The sMMO expressed under conditions of copper limitation is only found in a certain number of methanotrophs compared to pMMO that is expressed under conditions of no copper limitation and it is present in all known methanotrophs, but Methylocella vestris BL2 (Chistoserdova, 2011).
It is known that proteobacterial aerobic methanotrophs contain several copies of
pmo operons. Two similar copies of pmoCAB1 in both type I and type II proteobacterial
methanotrophs were found (Murrell et al., 2000; Semrau et al., 1995). The hypothesis is that the sequence-identical copies have appeared by gene insertions and duplications. By mutation studies in Methylococcus capsulatus Bath the requirement of both sequence-identical copies of pMMO was shown (Stolyar et al., 1999).
The pmoCAB2 was demonstrated to be absent in type I proteobacterial methanotrophs, and widely but not universally distributed in type II proteobacterial methanotrophs (Baani & Liesack, 2008).
Lately, it was discovered that the genera of type I proteobacterial methanotrophs encode a new sequence-divergent pmo. Unlike the CAB order for pMMO and AMO operon, it was encoded in the pxmABC operon (Tavormina et al., 2011). The presence of sequence-divergent copies supports the hypothesis that these enzymes evolved from the same ancestor but took different physiological function on different environmental conditions.
Using the complete genome of M. infernorum strain V4 and the draft genome of
M. fumariolicum strain SolV it was shown that none of the genes encoding the sMMO
subunits were found in these verrucomicrobial aerobic methanotrophs despite of three complete pmoCAB operons and an extra copy of pmoC being identified in these strains (Hou et al., 2008; Op den Camp et al., 2009; Pol et al., 2007).
20
The analysis of the draft genome of M. kamchatkense strain Kam1 showed orthologues of each of the three pmo operons discovered in strains V4 and SolV (Op den Camp et al., 2009).
A high similarity between the genes pmoA1, pmoA2 and pmoA3 of each strain and the pmoA4 of Kam1 was found, based on phylogenetic analysis of the Verrucomicrobial pmoA genes, so they represented a new branch, which is distinct from
pmoA and amoA genes of other cultured organisms (Op de Camp et al., 2009).
1.4.2.2-Methanol oxidation
The second step of methane oxidation pathway of proteobacterial aerobic methanotrophs is the oxidation of methanol to formaldehyde by the methanol
Figure 3 - Established pathways for the oxidation of methane (black arrows) and assimilation of formaldehyde (grey
arrows) in type I and type II proteobacterial aerobic methanotrophs (modified from Hanson & Hanson, 1996). The enzymes involved in methane oxidation are indicated within the boxes. (A) The soluble methane monooxygenase (sMMO). (B) The particulate methane monooxygenase (pMMO). (C) The methanol dehydrogenase (MDH). (D) The formaldehyde dehydrogenase (FADH). (E) The formate dehydrogenase (FDH). The formaldehyde, produced during the oxidation of methane can be assimilated via the serine pathway or the ribulose monophosphate (RuMP) pathway (adapted from khadem PhD thesis).
21
dehydrogenase (MDH) enzyme (Fig.3C). The MDH consists of large and small subunits, encoded by the mxaFI genes, and requires a cytochrome c electron accepter and a cofactor (pyrroloquinoline quinone). The later encoded by mxaG gene and it also needs calcium insertion to its active center.
Recently, the activity of this enzyme in verrucomicrobial methanotroph M.
fumariolicum strain SolV was shown to be dependent (Pol et al., 2007; 2013) on
lanthanides, a group of rare earth elements (cerium, lanthanum, neodymium and praseodymium) as a cofactor in a homodimeric MDH.
1.4.2.3-Formaldehyde oxidation
The third step of the methane oxidation pathway is the conversion of formaldehyde into formate by the formaldehyde dehydrogenase enzyme (Fig.3D). This step is very important for methanotrophs because it keeps intracellular formaldehyde concentrations at non-toxic levels and it is extremely important for energy generation (Chistoserdova, 2011).
1.4.2.4-Formate oxidation
The fourth and last step in methane oxidation pathway is the conversion of formate into carbon dioxide and it is performed by the enzyme formate dehydrogenase (FDH) (Fig. 3E).
It is known that different organisms as well as Methylotrophs have different types of formate dehydrogenases. A good example is M.extorquens species which contains four different FDH enzymes: a novel type of FDH, a predicted molybdenum-containing FDH, a predicted cytochrome-linked FDH that is likely periplasmic and a tungsten-containing FDH (Chistoserdova, 2011).
Based on the genome data of the strains V4 and SolV (verrucomicrobial methanotrophs), it was suggested that NAD-dependent formate dehydrogenase enzyme conducts this last step of methane oxidation pathway(Hou et al., 2008; Pol et al., 2007).
22 1.4.2.5-Carbon assimilation
In this pathway (Figure 3) carbon assimilation is located at the oxidation level of formaldehyde in aerobic methanotrophs (Hanson & Hanson, 1996).
The group of Alphaproteobacteria uses the serine pathway while the group of
Gammaproteobacteria uses the RuMP pathway for the assimilation of formaldehyde to
produce CO2(Chistoserdova et al., 2009).
Genome data of non-proteobacterial aerobic methanotrophs (Methylacidiphilum
infernorum V4, Methylacidiphilum fumariolicum SolV and ‘Candidatus
Methylomirabilis oxyfera’ [Ettwig et al., 2010; Hou et al., 2008; Op den Camp et al., 2009]) and proteobacterial methanotrophs (Methylococcus capsulatus Bath,
Methylocella silvestris BL2 [Chen et al., 2010; Ward et al., 2004]) showed the presence
of ribulose-1,5-bisphosphate carboxylase/oxygenase (RuBisCO), Calvin-Benson-Bassham (CBB) cycle key enzyme. It was found that M. capsulatus Bath contained RuBisCO in an active form (Stanley & Dalton, 1982), and the genome analysis suggested that a variant of the CBB cycle might be present (Kelly et al., 2005; Ward et
al., 2004).
Analyses of the draft genome of M. fumariolicum strain SolV showed that this verrucomicrobial methanotrophs and a complete genome sequence of M. infernorum strain V4 (Hou et al., 2008) lack the key enzymes for both the ribulose monophosphate and serine pathways (Op den Camp et al., 2009), but it was shown that a complete set of genes encoding the enzymes of the CBB cycle is present which indicates that these methanotrophs could fix CO2, presumably using CH4 as an energy source.
The Calvin-Benson-Bassham cycle has been related with a large use of ATP per mol of CO2 fixed and was never thought to be considered a pathway that supports
growth on CH4 (Chistoserdova et al., 2009).
Khadem et al., (2011) used 13CH
4 or 13CO2 in growth experiments to show that CO2 is
the only carbon source for M. fumariolicum strain SolV during growth on CH4.
Similarly in this paper it was demonstrated that all genes needed for a complete CBB cycle were transcribed, using the transcriptome study of the SolV. It was also shown that the small and the large subunits of RuBisCO were highly expressed.
23 1.5-Objectives
The aim of this project was the study of the biochemistry and physiology of the verrucomicrobia methyladiciphilum fumariolicum strain SolV.
The project is divided in two parts:
In the first part, we studied how strain SolV could handle nitrosative stress which is the result of NH4+ oxidation to NH2OH and further NO2- in the presence of various
concentrations of CH4. The pMMO enzyme involved in the first step of methane
oxidation can also oxidize ammonium to hydroxylamine which is a highly toxic compound, and it further be converted to nitrite which is also toxic. Thus, strain SolV should use a mechanism to detoxify these compounds.
The second part of this project was the study of growth in the presence of higher alkanes including ethane, propane and butane. Strain SolV has three pmoCAB operons and one of these operons was not expressed under nitrogen fixing and oxygen limited cultures, where electron donor was methane (Khadem et al., 2012). It is hypothesized that the third operon might be expressed in growth conditions using higher alkanes.
25
2-MATERIALS & METHODS
2.1-Microorganism
In this study, we used the bacteria Methylacidiphilum fumariolicum strain SolV, which was originally isolated from the volcanic region, Campi Flegrei, near Naples, Italy (Pol et al., 2007).
2.2-Medium composition for growth
The medium used in this study to grow strain SolV contained in g/L: MgCl2.6H2O, 0.0406; CaCl2.2H2O, 0.03; Na2SO4, 0.142; K2SO4, 0.35; (NH4)2SO4,0.528
and the concentration of trace elements were 0.1 µM (Ni, Co, Mo, Zn, Ce); 2 µM (Mn, Fe); 3 µM (Cu). The pH of medium was brought to a value of 2.7 with H2SO4 before
autoclaving. CaCl2.2H2O was autoclaved separately and added to avoid the formation of
precipitation. The amounts were calculated based on the growth till optical density (OD) 1, unless otherwise stated.
2.3-Ammonium determination
Ammonium concentrations were measured using the ortho-phthaldialdehyde (OPA) method (Taylor et al., 1974). Samples were centrifuged 5 minutes at 13000 rpm and diluted 5 times prior to the determination. The standard curves were made using concentrations of ammonium in a range of 0 till 5 mM ammonium instead of samples and then following the protocol.
2.4-Nitrite determination
Nitrite concentrations were measured using sulfanilic acid (Reagent A) and naphtylethylene diaminedihydrochloride (Reagent B) method (Griess, 1879). Samples were centrifuged 5 minutes at 13000 rpm and based on the expected nitrite concentrations, diluted or undiluted samples were used in this protocol. The standard
26
curves were made using concentrations of nitrite in a range of 0 till 0.1 mM nitrite instead of samples and then following the protocol.
2.5-Gas analyses
Methane, ethane and propane (100 µl) were analyzed on a HP 5890 gas chromatograph (GC) (Agilent, USA) equipped with a Porapak Q column (1.8 m x 2 mm) and a flame ionization detector.
2.6-Batch cultivation
Batch incubations were prepared with 60 ml serum bottles containing 5ml culture from reactor that were washed twice with medium and sealed with grey stoppers. Incubations were performed in duplicate at 55ºC with shaking at 380 r.p.m. The headspace contained air as the oxygen source and CH4 and CO2 concentrations of
10 and 5 %, respectively. In incubations to test nitrite production, CH4 and ammonium
concentrations were used in a range of 0-3 % and 0.5-16 mM, respectively. Nitrite and ammonium were measured using the nitrite and ammonium determination protocols.
The growth on higher alkanes (ethane and propane) was also studied using batch cultures with 250 ml plastic flasks containing 20 ml medium with 5 % (v/v) inoculum and sealed with red rubbers. Incubations were performed in duplicate at 55 ºC with shaking at 380 r.p.m. The headspace contained 5 % CO2 with different concentrations
of higher alkanes. Ethane and propane consumption was measured using GC and growth was observed using the spectrophotometer.
2.7-Chemostat cultivation
In the chemostat reactor with methane as an electron donor, liquid volume was 550 ml, and it was operated at 55 °C with stirring at 900 rpm with a stirrer bar. The chemostat was supplied with medium at a flow rate of 14.5 ml h-1 (D = 0.026 h-1), using a peristaltic pump. The cell-containing medium was removed automatically from the chemostat by a peristaltic 3 pump when the liquid level reached the sensor in the reactor. Supply of 10% CH4 (v/v), 8% O2 (v/v) and 68% CO2 (v/v) took place by mass
27
stirrer bar. An O2 sensor in the liquid was coupled to a Biocontroller (Applikon) regulating the O2 mass controller. The initial pH was 3.4 and was regulated with 1 M carbonate connected to the vessel by a peristaltic pump. The pH was gradually increased to 6.2 and after obtaining a steady state, all experiments were performed at this pH.
In the chemostat reactor with hydrogen as an electron donor, liquid volume was 1.3 L and it was operated at 55 °C with stirring at 1000 rpm. The chemostat was supplied with medium at a flow rate of 29.9 ml h-1 (D = 0.023 h-1). A gas supply of 12%
H2 (v/v), 10 % air (v/v) and 78% Ar/CO2 (95:5, v/v) took place by mass flow controllers through a sterile filter and sparged into the medium. An O2 sensor in the
liquid was coupled to a Biocontroller (Applikon) regulating the O2 mass controller. The
initial pH was 2.9 and the pH was regulated by 1 M NaOH. A pH range from 3 to 5.5 was investigated in the steady state.
29
3-RESULTS
3.1-Ammonium conversion to nitrite in batch experiments
In order to study nitrification (ammonium conversion to nitrite) of the strain SolV batch incubations were performed for 3 hours. The cells were washed 3 times with medium with an r.p.m of 13000. After that the bottles were pre-incubated 45 minutes before the beginning of the experiment. After pre-incubation, different concentrations of NH4+ were added in a range of 0.5 to 16 mM. Samples were taken every 15 minutes
during the first hour and then every half an hour till 3 hours, and then placed on ice for further ammonium and nitrite determination. These procedures were the same for all the NO2- production experiments.
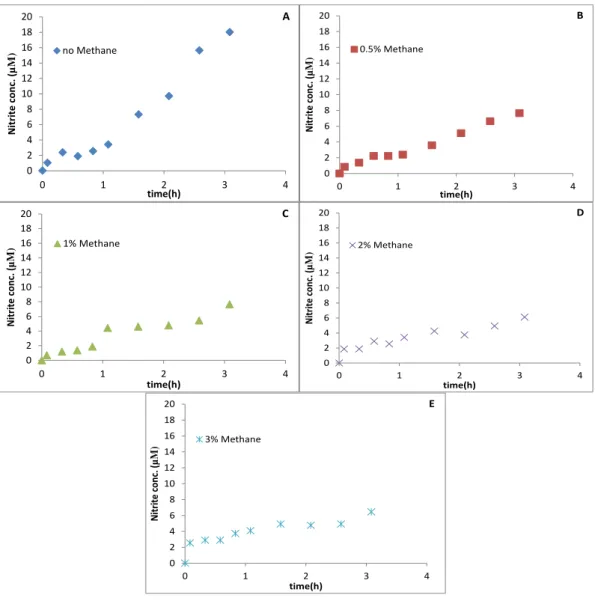
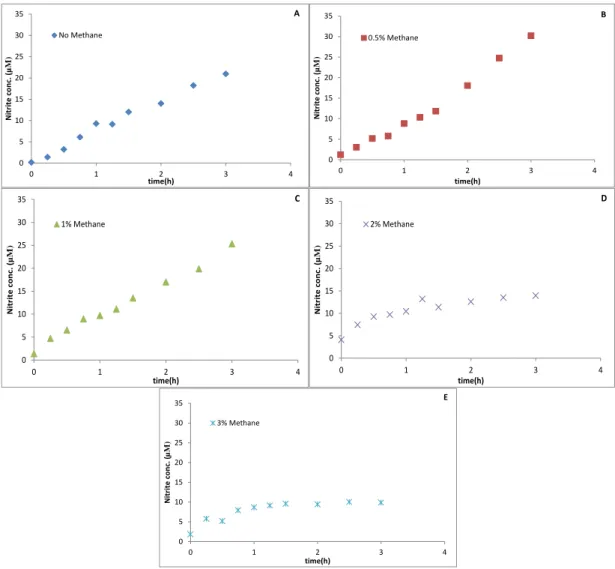
In the experiment with 0.5 mM NH4+, we tested 5 different incubations in
duplicate with 0, 0.5, 1, 2 and 3% CH4 in each one. In the incubation without methane,
after 3 hours, nitrite was produced to a final concentration of 19 µM with a production rate of 0.039 µM min-1, which was calculated in the first hour. The final nitrite
concentrations in the experiment with 0.5,1,2 and 3% methane were 9,9,8 and 7 µM, respectively (Fig. 4).The nitrite production rates were 0.025, 0.062, 0.025 and 0.025 µM
30
In addition to that an experiment with 1 mM NH4+ was performed. We had 5
different incubations in duplicate within a range of 0 to 3% CH4 in each one. In the
incubation without methane, after 3 hours, nitrite was produced to a final concentration of 20 µM with a production rate of 0.07 µM min-1, which was calculated in the first
hour. The final nitrite concentrations in the experiment with 0.5,1,2 and 3% methane were 20,10,7 and 6 µM, respectively (Fig. 5). The nitrite rates were 0.06, 0.09, 0.051
and 0.037 µM min-1, respectively.
0 2 4 6 8 10 12 14 16 18 20 0 1 2 3 4 N itr ite c o n c. (µ M ) time(h) no Methane A 0 2 4 6 8 10 12 14 16 18 20 0 1 2 3 4 N itr ite c o n c. (µ M ) time(h) 0.5% Methane B 0 2 4 6 8 10 12 14 16 18 20 0 1 2 3 4 N itr ite c o n c. (µ M ) time(h) 1% Methane C 0 2 4 6 8 10 12 14 16 18 20 0 1 2 3 4 N itr ite c o n c. (µ M ) time(h) 2% Methane D 0 2 4 6 8 10 12 14 16 18 20 0 1 2 3 4 N itr ite c o n c. (µ M ) time(h) 3% Methane E
Figure 4 - SolV Incubations with 0.5 mM NH4+. (A) Incubation with no CH4, (B) incubations with 0.5% CH4,
31
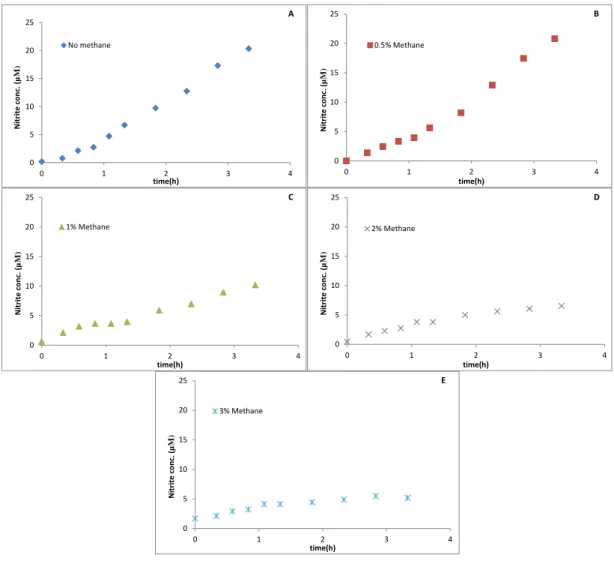
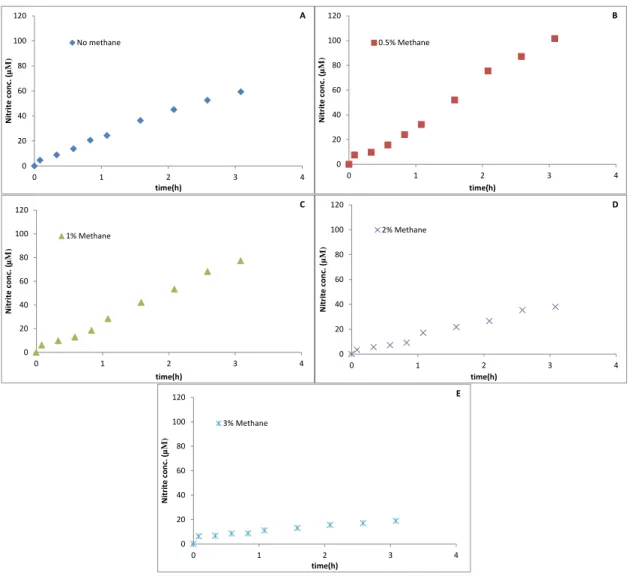
In the experiment with 2 mM NH4+ we had the same incubations similar to the
last experiments. In the incubation without methane, after 3 hours, nitrite was produced to a final concentration of 23 µM with a production rate of 0.152 µM min-1, which was
calculated in the first hour. The final nitrite concentrations in the experiment with 0.5, 1, 2 and 3% methane were 31,26,15 and 10µM, respectively (Fig.6). The nitrite rates were 0.126, 0.139, 0.106 and 0.114µM min-1, respectively.
0 5 10 15 20 25 0 1 2 3 4 N itr ite c o n c. (µ M ) time(h) No methane A 0 5 10 15 20 25 0 1 2 3 4 N itr ite c o n c. (µ M ) time(h) 0.5% Methane B 0 5 10 15 20 25 0 1 2 3 4 N itr ite c o n c. (µ M ) time(h) 1% Methane C 0 5 10 15 20 25 0 1 2 3 4 N itr ite c o n c. (µ M ) time(h) 2% Methane D 0 5 10 15 20 25 0 1 2 3 4 N itr ite c o n c. (µ M ) time(h) 3% Methane E
Figure 5 - SolV Incubations with 1 mM NH4+. (A) Incubation with no CH4, (B) incubations with 0.5% CH4,
32
In the 5mM NH4+ experimentwe had the same incubations as well as the last
experiments. In the incubation without methane, after 3 hours, nitrite was produced to a final concentration of 63 µM with a production rate of 0.329 µM min-1, which was
calculated in the first hour. The final nitrite concentrations in the experiment with 0.5, 1, 2 and 3% methane were 105,82,40 and 21µM, respectively (Fig.7). The nitrite rates were 0.410, 0.371, 0.229 and 0.079 µM min-1, respectively.
0 5 10 15 20 25 30 35 0 1 2 3 4 N itr ite c o n c. (µ M ) time(h) No Methane A 0 5 10 15 20 25 30 35 0 1 2 3 4 N itr ite c o n c. (µ M ) time(h) 0.5% Methane B 0 5 10 15 20 25 30 35 0 1 2 3 4 N itr ite c o n c . (µ M ) time(h) 1% Methane C 0 5 10 15 20 25 30 35 0 1 2 3 4 N itr ite c o n c . (µ M ) time(h) 2% Methane D 0 5 10 15 20 25 30 35 0 1 2 3 4 N itr ite c o n c. (µ M ) time(h) 3% Methane E
Figure 6 - SolV Incubations with 2 mM NH4+. (A) Incubation with no CH4, (B) incubations with 0.5% CH4,
33
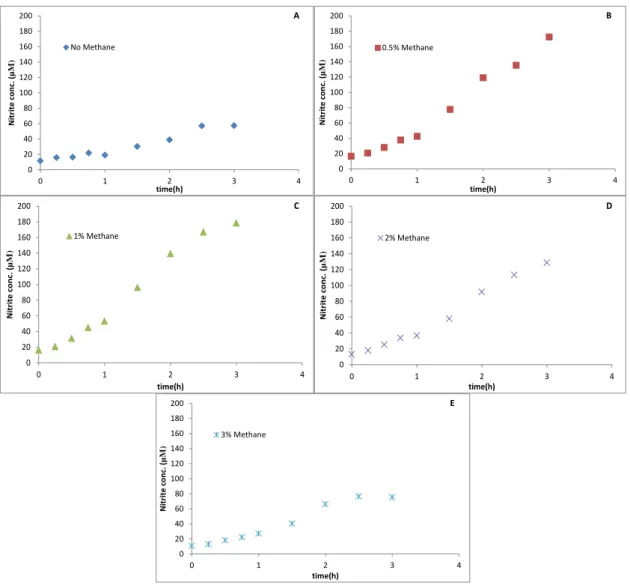
Moreover in the experiment with 8 mM NH4+ the procedure was identical to the
last experiments. In the incubation without methane, after 3 hours, nitrite was produced to a final concentration of 70 µM with a production rate of 0.445 µM min-1, which was
calculated in the first hour. The final nitrite concentrations in the experiment with 0.5, 1, 2 and 3% methane were 240,230,160 and 110 µM, respectively (Fig.8). The nitrite rates were 0.860, 1.027, 0.643 and 0.415µM min-1, respectively.
0 20 40 60 80 100 120 0 1 2 3 4 N itr ite c o n c. (µ M ) time(h) No methane A 0 20 40 60 80 100 120 0 1 2 3 4 N itr ite c o n c. (µ M ) time(h) 0.5% Methane B 0 20 40 60 80 100 120 0 1 2 3 4 N itr ite c o n c. (µ M ) time(h) 1% Methane C 0 20 40 60 80 100 120 0 1 2 3 4 N itr ite c o n c. (µ M ) time(h) 2% Methane D 0 20 40 60 80 100 120 0 1 2 3 4 N itr ite c o n c. (µ M ) time(h) 3% Methane E
Figure 7 - SolV Incubations with 5 mM NH4+. (A) Incubation with no CH4, (B) incubations with 0.5% CH4,
34
The graphs below show the 16mM NH4+ experiment being the procedure
identical to the last experiments. In the incubation without methane, after 3 hours, nitrite was produced to a final concentration of 58 µM with a production rate of 0.126 µM min-1, which was calculated in the first hour. The final nitrite concentrations in the
experiment with 0.5, 1, 2 and 3% methane were 172,178,128 and 75 µM, respectively (Fig. 9). The nitrite rates were 0.435, 0.617, 0.395 and 0.268µM min-1, respectively.
0 50 100 150 200 250 0 1 2 3 4 N itr ite c o n c. (µ M ) time(h) No Methane A 0 50 100 150 200 250 0 1 2 3 4 N itr ite c o n c. (µ M ) time(h) 0.5% Methane B 0 50 100 150 200 250 0 1 2 3 4 N itr ite c o n c . (µ M ) time(h) 1% Methane C 0 50 100 150 200 250 0 1 2 3 4 N itr ite c o n c . (µ M ) time(h) 2% Methane D 0 50 100 150 200 250 0 1 2 3 4 N itr ite c o n c. (µ M ) time(h) 3% Methane E
Figure 8 - SolV Incubations with 8 mM NH4+. (A) Incubation with no CH4, (B) incubations with 0.5% CH4,
35 3.2-Growth on higher alkanes in batch experiments
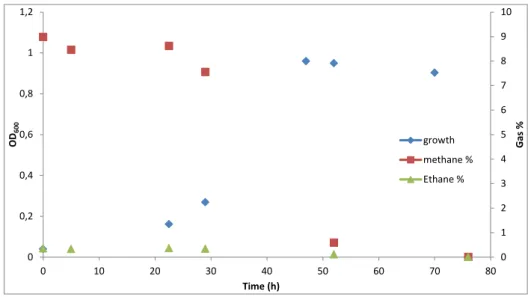
In order to study the growth of strain SolV on higher alkanes, different batch incubations were performed. The first experiment was with natural gas which contains various concentrations of different alkanes in their composition. In this experiment, we added 12 ml of natural gas that was 9% methane and 0.3% ethane of the bottle’s head of space total volume. It was observed that during the exponential phase that started after 20 hours and ended after 50 hours of incubation the percentage of gases was almost
0 20 40 60 80 100 120 140 160 180 200 0 1 2 3 4 N itr ite c o n c. (µ M ) time(h) No Methane A 0 20 40 60 80 100 120 140 160 180 200 0 1 2 3 4 N itr ite c o n c. (µ M ) time(h) 0.5% Methane B 0 20 40 60 80 100 120 140 160 180 200 0 1 2 3 4 N itr ite c o n c . (µ M ) time(h) 1% Methane C 0 20 40 60 80 100 120 140 160 180 200 0 1 2 3 4 Ni tr ite c on c. (µ M ) time(h) 2% Methane D 0 20 40 60 80 100 120 140 160 180 200 0 1 2 3 4 N itr ite c o n c. (µ M ) time(h) 3% Methane E
Figure 9 - SolV Incubations with 16 mM NH4+. (A) Incubation with no CH4, (B) incubations with 0.5% CH4, (C)
36
consumed. The percentage of methane went from 9 to 1.7% and ethane from 0.3 to 0%, while the OD increased till 1(Fig.10). After observing the decrease of ethane, further experiments on higher alkanes were performed.
Since ethane was consumed by strain SolV, the next experiments were performed using the incubations with higher alkanes such as ethane and propane.
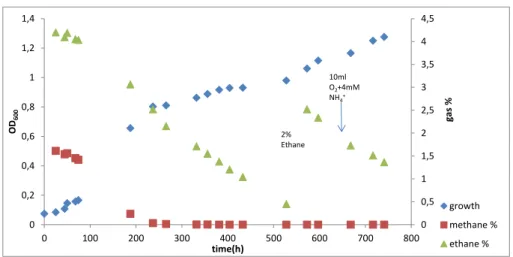
The incubation with ethane was performed in duplicate with 2% CH4+ + 5%
C2H6 for 30 days. In this experiment the initial OD was 0.09 and it grew till 1.3. During
the exponential phase that was between 90 and 200 hours it was visible a decrease in alkanes, being methane almost consumed and just remaining ethane, while the OD was approximately 0.8. Till the end of the experiment the cells grew till OD 1.3 only on ethane. During the experiment it was added to the incubation ethane, O2 (it is used in
the first step of oxidation of alkanes) and NH4+ (N-source) because they were limited
(Fig.11). 0 1 2 3 4 5 6 7 8 9 10 0 0,2 0,4 0,6 0,8 1 1,2 0 10 20 30 40 50 60 70 80 Gas % OD 600 Time (h) growth methane % Ethane %
Figure 10 -Incubation of SolV with natural gas containing methane and ethane at different concentrations.
37
The incubation with propane was performed in duplicate with 2% CH4+ + 5%
C3H8 for 28 days. In this experiment the initial OD was 0.09 and it grew till 1.7. The
exponential phase (which is not well visible in the graph) was between 50 and 200 hours and it was visible a decrease in alkanes, being methane completely consumed after 100 hours and just remaining propane, while the OD was approximately 1. Till the end of the experiment the cells grew till OD 1.7 only on propane. During the experiment, extra oxygen (10 ml), ammonium (4 mM) and trace elements (concentration enough till OD 10) were added because they were limited (Fig.12).
0 0,5 1 1,5 2 2,5 3 3,5 4 4,5 0 0,2 0,4 0,6 0,8 1 1,2 1,4 0 100 200 300 400 500 600 700 800 g as % OD 600 time(h) growth methane % ethane % 2% Ethane 10ml O2+4mM NH4+ 0 0,5 1 1,5 2 2,5 3 3,5 4 4,5 0 0,2 0,4 0,6 0,8 1 1,2 1,4 1,6 1,8 0 100 200 300 400 500 600 700 g ases % OD 600 Time(h) growth methane % ethane % 10ml O2+4mM NH4 trace elements added
Figure 11 - Incubation of SolV with 2% methane and 5% ethane. Observation of growth (blue squares) and
methane (red squares) and ethane (green triangles) consumption.
Figure 12 - Incubation of SolV with 2% methane and 5% propane. Observation of growth (blue squares)
38
After the experiment with methane and propane, other incubations were performed. In this incubation the only electron donor was propane and it was used inoculations from the previous experiment (Fig.12). The initial OD value was 0.12 and the final value was 1. The percentage used was 5% and the experience continued for 20 days. The exponential phase held between 60 and 335 hours with an OD of 1, while the percentage of propane decreased till 2%.
0 0,5 1 1,5 2 2,5 3 3,5 4 4,5 5 0 0,2 0,4 0,6 0,8 1 1,2 0 100 200 300 400 500 g as % OD 600 Time (h) growth propane %
Figure 13 - Incubation of SolV with 5% propane. Observation of growth (green triangles) and propane (blue
40
4-DISCUSSION
In this study, the nitrosative stress and growth on higher alkanes in batch experiments of Methylacidiphilum fumariolicum strain SolV were investigated.
Regarding nitrosative stress, nitrite production was investigated with different ammonium concentrations under methane concentration in a range of 0 to 3%.
Methane and ammonia are very similar molecules, and therefore microorganisms using ammonia as the only energy source (nitrifiers or ammonia oxidisers), and microorganisms that use methane as the only energy source (methanotrophs) possess similar features (Stein et al., 2012).
The genome of SolV shows only the pMMO enzyme (particulate MMO), thus it has been hypothesized that strain SolV could oxidase ammonium to nitrite in the presence of methane.
To test this hypothesis, the experiments with different concentrations of methane and ammonium were performed. At 1% methane the nitrite production rate was found higher except with 2 and 5 mM NH4+ experiments.
This could be because 1% methane is the ideal methane percentage limitation for the consumption of ammonium and consequently a higher nitrite production rate. A reason for those exceptions could probably be the determination reagents, because they were not fresh and these reagents lose their sensitivity over time.
Another plausible reason is the spectrophotometer, because the absorbance fluctuates from 0.002 to 0.006 which interferes with the results, because we were looking to the nM scale. Differences in the initial OD600 values from 0.05 to 0.1 could
also interfere with this variation within the nitrite production rate.
In this experiment, it is also clear that higher concentration of ammonium leads to a higher nitrite production rate and to a higher concentration of nitrite after 3 hours of incubation.
On the other hand with 16 mM ammonium the story is different because at that value, the values of nitrite production rate and the concentration of nitrite after the 3 hours decreased. This could be because it was reached a saturation point where the enzyme cannot degrade the substrate at the same speed as at lower concentrations.
41
Attempts to obtain a Michaelis Menten curve was not successful, because of problems referred above, insufficient concentrations of ammonium experiments, and time intervals.
Regarding the different percentages of methane, 3 % was chosen as the maximum, because in the first attempts methane concentrations up to 10 % were tried and no nitrite production was observed.
A reason for this is because pMMO has more affinity to methane than to ammonium and with higher concentrations of methane the enzyme does not uptake the ammonium.
Afterwards, further experiments were made till 3% because 2 and 3% are the percentages where nitrite production starts to decrease in all experiments with different concentrations of ammonium.
These experiments are correlated with the rigorous review from (Hanson & Hanson, 1996) where it says that pMMO has much more affinity to methane than to ammonium in higher concentrations of methane but in low concentrations of methane the ammonium inhibit the methane oxidation.
Regarding growth on higher alkanes, SolV growth on short-chain alkanes in alternative to methane and which operon is involved was investigated.
All methanotrophs use the enzyme MMO to oxidase methane. Analyzing the genome of SolV showed that pMMO has three pmoCAB operons and one of these operons was not expressed under nitrogen fixing and oxygen limited conditions, where electron donor was methane (Khadem et al., 2012). It is hypothesized that the third operon might be expressed under growth conditions using higher alkanes.
In order to test this hypothesis, batch incubations with natural gas were performed. The natural gas contains different gases, including alkanes, in their composition.
This experiment was continued for approximately 76 hours and it can be seen that the 0.3% and 9% of ethane and methane respectively were totally consumed after this time. Both gases were consumed during the exponential phase.
After observing the consumption of ethane even if in small concentrations the next experiments was the growth with higher concentrations and with different alkanes.
Two different experiments were initiated. The first incubation was with 2% methane and 5% ethane, and incubation with 2% methane and 5% propane.
42
The bottles used were of 300 ml. The percentages of gases in the graphs are a bit lower because the calculations were made for head of space of 250 ml instead of 280ml. It was evident that on both incubations the exponential phase starts later in comparison to using higher concentrations of methane. A reason for this could be that the cells are adapting to these new alkanes.
Furthermore after the total consume of methane in both incubations it was evident that ethane and propane continued to decrease and the OD600 increasing. The
OD600 on ethane increased till 1.3 and on propane increased till 1.7.
NH4+, trace elements and O2 were added in the experiments. NH4+ and trace
elementswere added to avoid any limitations. O2 is needed for the first step of oxidation
to be performed therefore it was added because the concentration was lower after some time.
After the consumption of different alkanes a new experiment with only propane was performed. Thus, inoculum from cells growing on methane and propane was used as cells were already adapted to this alkane. In Fig.13 is visible that SolV could grow only on propane till OD600 of 1 after 10 days.
A reason for taking so long to grow could be that the cells are still adapting to grow only on propane or because they take longer to convert propane.
Experiments on ethane, ethanol, propanol and butanol were made but they need to be optimized. Nevertheless those experiments reached an OD600 of 0.2/0.3.
These results correlate with the study of the methanotroph Methylocella
silvestris, which shows that this strain could grow on propane in absence of methane
44
5-CONCLUSION & OUTLOOK
In this study, we analyzed the nitrosative stress and growth on higher alkanes on “Methylacidiphilum fumariolicum” strain SolV, which improves our understanding about the physiology of this bacterium.
The study of nitrosative stress shows that in strain SolV, the pMMO enzyme can use ammonium under limited values of methane and oxidize it to hydroxylamine, which further is oxidized to nitrite.
The study of growth on higher alkanes shows that this strain could also grow on propane. Regarding future work, transcriptome analysis needs to be performed to test whether the third pmoCAB operon is expressed under the growth on higher alkanes. Experiments with ethane, ethanol, propanol and butanol need to be optimized, and further transcriptome analysis could be performed. Experiments with butane could be also planned as well to test whether strain SolV can grow on C4 compounds.
46
6-REFERENCE LIST
Auman, A. J., Speake, C. C. & Lidstrom, M. E. (2001). nifH sequences and nitrogen fixation in type I and type II methanotrophs. Appl Environ Microbiol 67, 4009-4016.
Baani, M. & Liesack, W. (2008). Two isozymes of particulate methane monooxygenase with different methane oxidation kinetics are found in Methylocystis sp. strain SCZ. Proc Natl Acad
Sci USA 105, 10203-10208.
Barnes, R. O. & Goldberg, E. D. (1976). Methane production and consumption in anoxic marine-sediments. Geology 4, 297-300.
Beal, E. J., House, C. H. & Orphan, V. J. (2009). Manganese- and iron-dependent marine methane oxidation. Science 325, 184-187.
Boetius, A., Ravenschlag, K., Schubert, C. J., Rickert, D., Widdel, F., Gieseke, A., Amann, R., Jorgensen, B. B., Witte, U. & other authors (2000). A marine microbial consortium apparently mediating anaerobic oxidation of methane. Nature 407, 623-626.
Castaldi, S. & Tedesco, D. (2005). Methane production and consumption in an active volcanic environment of Southern Italy. Chemosphere 58, 131-139.
Chen, Y., Crombie, A., Rahman, M. T., Dedysh, S. N., Liesack, W., Stott, M. B., Alam, M., Theisen, A. R., Murrell, J. C. & other authors (2010). Complete genome sequence of the aerobic facultative methanotroph Methylocella silvestris BL2. J Bacteriol 192, 3840-3841. Chistoserdova, L. (2011). Modularity of methylotrophy, revisited. Environ Microbiol 13, 2603-2622.
Chistoserdova, L., Kalyuzhnaya, M. G. & Lidstrom, M. E. (2009). The expanding World of methylotrophic metabolism. Annu Rev Microbiol 63, 477-499.
Conrad, R. (2009). The global methane cycle: recent advances in understanding the microbial processes involved. Environ Microbiol Rep 1, 285-292.
47 Crombie, Andrew, T. & Murrell, J. Colin (2014). Trace-gas metabolic versatility of the facultative methanotroph Methylocella silvestris. Nature
Dedysh, S. N., Belova, S. E., Bodelier, P. L. E., Smirnova, K. V., Khmelenina, V. N., Chidthaisong, A., Trotsenko, Y. A., Liesack, W. & Dunfield, P. F. (2007). Methylocystis
heyeri sp nov., a novel type II methanotrophic bacterium possessing 'signature' fatty acids of
type I methanotrophs. Int J Syst Evol Micr 57, 472-479.
Dedysh, S. N., Khmelenina, V. N., Suzina, N. E., Trotsenko, Y. A., Semrau, J. D., Liesack, W. & Tiedje, J. M. (2002). Methylocapsa acidiphila gen. nov., sp nov., a novel methane-oxidizing and dinitrogen-fixing acidophilic bacterium from Sphagnum bog. Int J Syst Evol Micr 52, 251-261.
Dedysh, S. N., Liesack, W., Khmelenina, V. N., Suzina, N. E., Trotsenko, Y. A., Semrau, J. D., Bares, A. M., Panikov, N. S. & Tiedje, J. M. (2000). Methylocella palustris gen. nov., sp nov., a new methane-oxidizing acidophilic bacterium from peat bags, representing a novel subtype of serine-pathway methanotrophs. Int J Syst Evol Micr 50, 955-969.
Denman, K. L., G. Brasser, A. Chidthaisong, P. Ciais, P. M. Cox, R. E. Dickinson, D. Hauglustaine, C. Heinze, E. Holland & other authors (2007). Couplings between changes in the climate system and biogeochemistry. In Climate change 2007: The physical science basis
Contribution of working group I to the fourth assessment report of the intergovernmental panel
on climate change, PP 499-587. Cambridge: Cambridge University Press.
Dunfield, P. F., Yuryev, A., Senin, P., Smirnova, A. V., Stott, M. B., Hou, S. B., Ly, B., Saw, J. H., Zhou, Z. M. & other authors (2007). Methane oxidation by an extremely acidophilic bacterium of the phylum Verrucomicrobia. Nature 450, 879-883.
Etiope, G. & Klusman, R. W. (2002). Geologic emissions of methane to the atmosphere.
Chemosphere 49, 777-789.
Etiope, G., Oehler, D. Z. & Allen, C. C. (2011). Methane emissions from Earth's degassing: Implications for Mars. Planet Space Sci 59, 182-195.
Ettwig, K. F., Butler, M. K., Le Paslier, D., Pelletier, E., Mangenot, S., Kuypers, M. M. M., Schreiber, F., Dutilh, B. E., Zedelius, J. & other authors (2010). Nitrite-driven anaerobic methane oxidation by oxygenic bacteria. Nature 464, 543-550.
48 Ettwig, K. F., Shima, S., van de Pas-Schoonen, K. T., Kahnt, J., Medema, M. H., Op den Camp, H. J. M., Jetten, M. S. M. & Strous, M. (2008). Denitrifying bacteria anaerobically oxidize methane in the absence of Archaea. Environ Microbiol 10, 3164- 3173.
Forster, P., Ramaswamy, V., Artaxo, P., Berntsen, T., Betts, R. A., Fahey, D. W.,
Haywood, J., Lean, J., Lowe, D. C. other authors (2007). Changes in atmospheric
constituents and in radiative forcing. In Climate change 2007: The physical science basis
Contribution of working group I to the fourth assessment report of the intergovernmental panel
on climate change, PP 129-234. Cambridge: Cambridge University Press.
Hanson, R. S. & Hanson, T. E. (1996). Methanotrophic bacteria. Microbiol Rev 60, 439- 471. Heyer, J., Berger, U., Hardt, M. & Dunfield, P. F. (2005). Methylohalobius crimeensis gen. nov., sp. nov., a moderately halophilic, methanotrophic bacterium isolated from hypersaline lakes of Crimea. Int J Syst Evol Micr 55, 1817-1826.
Hou, S. B., Makarova, K. S., Saw, J. H. W., Senin, P., Ly, B. V., Zhou, Z. M., Ren, Y., Wang, J. M., Galperin, M. Y. & other authors (2008). Complete genome sequence of the extremely acidophilic methanotroph isolate V4, Methylacidiphilum infernorum, a representative of the bacterial phylum Verrucomicrobia. Biol Direct 3, 26.
Houghton, J. T., Meira Filho, L. G., Callander, B. A., Harris, N., Kattenberg, A. Maskell, K. (1996). In Climate Change 1995: The Science of Climate Change, IPCC, PP 572. Cambridge: Cambridge University Press.
Houweling, S., Kaminski, T., Dentener, F., Lelieveld, J. & Heimann, M. (1999). Inverse modeling of methane sources and sinks using the ad joint of a global transport model. J
Geophys Res [Atmos] 104, 26137-26160.
Islam, T., Jensen, S., Reigstad, L. J., Larsen, O. & Birkeland, N. K. (2008). Methane oxidation at 55 °C and pH 2 by a thermoacidophilic bacterium belonging to the
Verrucomicrobia phylum. Proc Natl Acad Sci USA 105, 300-304.
Kelly, D. P., Anthony, C. & Murrell, J. C. (2005). Insights into the obligate methanotroph