OPPORTUNITIES FOR THE ENERGY EFFICIENCY IMPROVEMENT IN
THE DAIRY FOOD SECTOR – THE CASE STUDY OF PORTUGUESE
TRADITIONAL CHEESE INDUSTRIES
J. NUNES
(*), P.D. SILVA
(**), L.P. ANDRADE
(*), C. DOMINGUES
(**),P.D. GASPAR
(**)(*)
Agriculture School, Polytechnical Institute of Castelo Branco, Apartado 119, 6001-909 Castelo Branco, Portugal.
E-mail: [email protected];[email protected]
(**)
Engineering Faculty, University of Beira Interior, Rua Marquês d' Ávila e Bolama, 6200 Covilhã, Portugal.
E-mail: [email protected]; [email protected] ;[email protected]
ABSTRACT
Worldwide, cheese is a major dairy food product with great nutritional value and organoleptic characteristics. Over 20.4 million metric tons of cheese were produced worldwide in 2012 (80 thousand tons in Portugal). This paper characterizes the production process and the energy consumption of traditional cheese industry in Portugal (31 companies) and discusses the average specific energy consumption (SEC). Data collection was conducted via survey to obtain information about the facilities, the production process, quantities of raw materials, characteristics of cooling systems, and energy consumption. The average value of this indicator for this sample was 0.152 kWh/l.RM (handmade type) to 0.283 kWh/l.RM (industrial type). Electricity consumption is about 63% of the total energy consumption, mainly due to the energy supply of the refrigeration systems. The potential of energy saving was estimated at 20.8% (handmade type) and 19.4% (industrial type).
1.
INTRODUCTION
The dairy sector is of great importance in production activities at a worldwide level. Between 1970 and 2012, milk production grew 64%, reaching a value of 790 million metric tons in 2012. The manufacture of cheese assumes considerable importance with a weight of 27% within this sector. Between 2000 and 2012, the world cheese production increased by 32%, reaching the value of 20.4 million metric tons in 2012 (Mikkelsen, 2014). In EU the trend is similar, with an increase of 21% in the same period and reaching a production of 9.4 million metric tons at the end of 2012. Forecasts suggest that in 2020 the world production of cheese reaches values close to 25 million metric tons (10.6 million metric tons only in Europe).
In Portugal, the dairy sector is the second largest sector of agro-food industries below to meat processing industries. According to Afonso et al. (2012), in 2009, the sector involved 430 companies, 6840 jobs a turnover of 1538 million euros. In 2012, production was 1868 million litres of milk (INE, 2014) and 80 thousand tons of cheese (GPP, 2014). According to the DGAV (2015) there are 398 cheese-making industries from raw milk (mainly sheep and goat). The main products obtained are ripened cheese, fresh cheese and cheesecurd. In the course of their activities, companies use electrical energy to drive cooling systems, pumps, fans, compressed air systems and lighting and one or more types of fuel to burn in combustion plants (boilers), for water heating or for steam production (cleaning operations or production processes).
The increase of people in the major population centers as well as the need to provide food of good quality, in good health and safety conditions, such as cheese, makes the supply chain more energy demanding, especially on the refrigeration systems (Artés, 2004; Coulomb, 2008; James and James, 2010). These refrigeration systems are referenced in the food industry as major consumers of energy due to the high number of used systems and required refrigeration power (Ramirez, 2006; McFarland et al. 2007; Tassou et
al., 2010; Gaspar et al., 2014). Several studies conducted on this sector, point out that the high consumption
of electricity due to refrigeration systems (Gautherin et al., 2007; Ramirez, 2006; Silva et al., 2014). Sometimes simple energy efficiency measures linked to improved operational practices and good maintenance of the facilities, could help to reduce the energy consumption by 15% (Fritzson and Berntsson, 2005; Guilpart, 2009; Mirade, 2012). Some authors highlight the possibility of assessing the energy performance of food industry, such as cheese making, through the use of benchmarking indicators as the specific energy consumption (Reindl, 2005; Unido, 2010; Xu and Flapper, 2010; Nunes et al., 2014).
The objectives of this study are to analyse the profile of electricity consumption of the traditional cheese manufacturing industries, to determine the specific energy consumption indicators of these industries and finally to study the potential energy savings.
2.
CHEESE MANUFACTERING PROCESS
The production process of cheese from raw milk, involves a number of steps that are similar in all traditional industries. However, there are industries that carry out all stages of the process using technology (traditional industrial manufacturing process of cheese making), while others, still perform some of the steps by hand, in particular, salting, pressing and washing the cheese (traditional handmade manufacturing process).
Figure 1 shows a typical diagram of the ripened cheese manufacturing process from raw milk performed by most traditional industries of Portugal and the operations of the cheese making process, temperatures and the times are indicated.
Figure 1. Diagram of cheese manufacturing process.
During the maturation process, the cheeses are periodically washed. In general the manufacturing of the ripened cheese has a duration between 30 to 45 days, depending on the company.
The main raw materials used for the cheese manufacture are the sheep and goat milk. The obtained products are the sheep cheese, goat cheese, mixed cheese (sheep milk with goat milk). In addition to the ripened cheese, certain industries also produce fresh cheese (pasteurized milk without maturation and with a short lifespan) and cheese curd (resulting from whey heated to a temperature of 90 to 95°C, for 2 to 2.5 hours, followed by filtration). The conservation of these two products is performed in cooling chambers at a
RAW MILK RECEPTION
FILTRATION/CLARIFICATION MILK STORAGE (T< 4ºC) PRODUCTION - Coagulation (28 to 30ºC;60 minutes) - Curd cut DRAINING CURD PRE-PRESSING AND SHAPE
PRESSING (2 to 2.5 hours)
SALTING
Salt on the cheese; brine (T=4 to 8ºC)
CHEESE MATURATION 1.ª Phase – Fermentation (T=4-8ºC; RH=90 to 98 %; 10 to 15 days) 2.ª Phase – Drying (T=8 -12ºC; RH=85 to 90 %,; 15 to 30 days) PACKAGING/SHIPPING
WHEY – CHEESECURD MANUFACTURE
(T=90 to 95ºC)
PACKAGING/STORAGE
(T< 6ºC; RH=90%)
SHIPPING
temperature of 4 to 6°C and relative humidity of 85 to 90%. As can be seen in Figure 1, the manufacturing process of these products requires a great use of cold and heat. In particular, refrigeration systems are used during the cool down and preservation of milk and cheese products and also to perform the cheese maturation operation.
3.
MATERIAL AND METHODS
3.1. Sample
The present study was conducted on a sample of 31 traditional cheese manufacturing industries located in the interior region of central Portugal. The sample was divided into two categories: traditional industrial
producers (plants 1 to 13) and traditional handmade industries (plants 14 to 31).
3.2. Data collection
To perform the collection of information from the industrial facilities a wide inquiry was developed. This inquiry consists of several sections, each to record specific information industry: general description, quantities of raw materials, production quantities, energy consumption, refrigerating and freezing chambers characteristics, environmental conditions, cooling systems characteristics and finally activity and production process characteristics. The process of data collection was conducted in personal visits, during which the facilities, equipment, technical operations and production processes were observed.
3.3. Database
A computer database with an Access application was created for registration of all information collected in the industries. This database was also set to perform the analysis and processing of the data. It also allows us to obtain several indicators of industry performance and simultaneously perform a comparative analysis between various industries of this sector.
3.4. Equipment and measurement techniques
The environmental conditions inside and outside of refrigeration equipment were measured by a digital equipment Testo 435-2 with a multifunction temperature and humidity probe with an accuracy of 0.3°C and ± 2%, respectively. To measure the temperature of the surfaces we use the same equipment and a contact probe with type K thermocouple, with an accuracy of ± 0.5ºC. To evaluate the electrical power of compressors a clamp meter Escort ECT-620 with an accuracy of 1.5% was used to measure the intensity of the electric current and voltage input to the compressor motors. The values of the electrical power obtained experimentally, were then compared with the estimated values by using software and catalogues of official representatives of the brands, for the operating conditions, and we checked differences which were always less than 10% of the total. Although energy consumption were quantified by analysing the monthly bills of electricity supplier, the analysis of electricity consumption profile through the use of an energy analyser was also performed, through the Elcontrol-Energy Explorer, with an accuracy of 0.5%, 1%, 2% and 2% for voltage, current, electrical power and energy, respectively. The dimensional measurements of cold (refrigeration and freezing chambers) equipment was performed using an infrared rangefinder, Bosch DLE-40, with an accuracy of ± 1.5 mm.
4. RESULTS AND DISCUSSION
The traditional cheese manufacturing industries (handmade production) are smaller, much more similar to each other, both in size and the equipment used. In turn, the traditional industrial cheese manufacturing industries have a greater variation in their infrastructure, size and amount of equipment used in production processes. Consequently the handmade industries presents a mean value of the purchased electrical power of 40 kW with a standard deviation of 28.9 and the industrial facilities presents the corresponding values of 210 kW and 151.3, respectively.
The cooling systems are used for cooling milk, cheese maturation, preservation of cheese products, brine cooling and air conditioning of the manufacturing environment. In these industries we found 221 mechanical compression refrigeration systems of direct expansion and 16 of indirect expansion with a secondary fluid. Most compressors are semi-hermetic type (66%), followed by the hermetic (23%) and finally open type (11%). In terms of lifespan, 50% of the compressors were over 20 years old, 34% were between 10 and 20 years, and only 12% were under 10 years. The condensers of the refrigeration systems are mostly pipes and
fins heat exchangers, air-cooled by forced convection (99%) and only a small number are the evaporative type (1%).
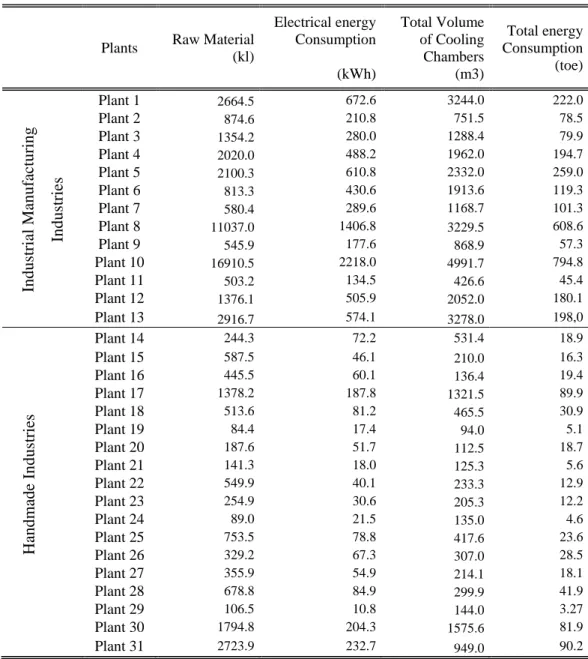
Table 1 presents the main results, in particular the raw material processed, the annual electricity consumption and the total volume of cooling chambers. The average electrical energy consumption in the industrial manufacturing industries has a value of 615.3 MWh well above of the average consumption of 75.6 MWh found for the handmade industries. The thermal and electrical energy represent 38% and 62% of the total energy consumption in the industrial manufacturing industries and the values for handmade industries are 36.5% and 63.5% respectively. This slight increase of the thermal energy consumption on the industrial manufacturing industries is due to their larger size and also to the milk thermisation and pasteurization operations for fresh cheese production.
Table 1. Results of the cheese manufacturing industries.
Plants Raw Material (kl) Electrical energy Consumption (kWh) Total Volume of Cooling Chambers (m3) Total energy Consumption (toe) Plant 1 2664.5 672.6 3244.0 222.0 Plant 2 874.6 210.8 751.5 78.5 Plant 3 1354.2 280.0 1288.4 79.9 Plant 4 2020.0 488.2 1962.0 194.7 Plant 5 2100.3 610.8 2332.0 259.0 Plant 6 813.3 430.6 1913.6 119.3 Plant 7 580.4 289.6 1168.7 101.3 Plant 8 11037.0 1406.8 3229.5 608.6 Plant 9 545.9 177.6 868.9 57.3 Plant 10 16910.5 2218.0 4991.7 794.8 Plant 11 503.2 134.5 426.6 45.4 Plant 12 1376.1 505.9 2052.0 180.1 Plant 13 2916.7 574.1 3278.0 198,0 Plant 14 244.3 72.2 531.4 18.9 Plant 15 587.5 46.1 210.0 16.3 Plant 16 445.5 60.1 136.4 19.4 Plant 17 1378.2 187.8 1321.5 89.9 Plant 18 513.6 81.2 465.5 30.9 Plant 19 84.4 17.4 94.0 5.1 Plant 20 187.6 51.7 112.5 18.7 Plant 21 141.3 18.0 125.3 5.6 Plant 22 549.9 40.1 233.3 12.9 Plant 23 254.9 30.6 205.3 12.2 Plant 24 89.0 21.5 135.0 4.6 Plant 25 753.5 78.8 417.6 23.6 Plant 26 329.2 67.3 307.0 28.5 Plant 27 355.9 54.9 214.1 18.1 Plant 28 678.8 84.9 299.9 41.9 Plant 29 106.5 10.8 144.0 3.27 Plant 30 1794.8 204.3 1575.6 81.9 Plant 31 2723.9 232.7 949.0 90.2
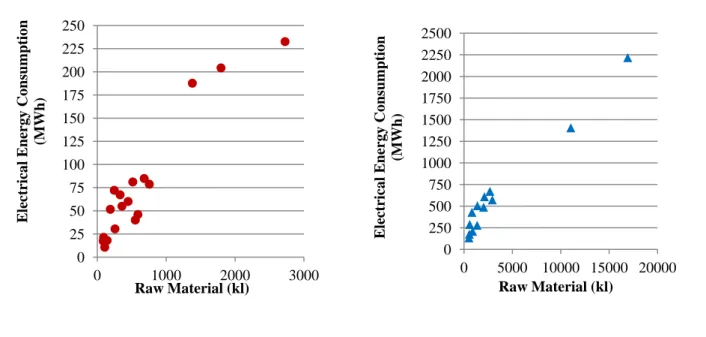
The electrical power consumption by refrigeration compressors is strongly correlated with the amount of processed raw material as shown in figure 2. As can be seen, the electric power consumption increases with increasing raw material, partly due to the power consumption achieved by refrigeration. However, this increase is not uniform within the two categories which may indicate a less efficient use of energy by some industries.
Industrial Manufacturing
Industries
Handmade In
Figure 2. Electrical energy consumption vs. raw material use: handmade industries (left) industrial
manufacturing industries (right).
As shown in Figure 3, the compressors electrical power tends to increase with increasing raw material to be processed. This increase is most evident on the industrial manufacturing industries since other industries still maintain some handmade operations such as the cheese salt process even with larger raw material processing. Furthermore, as some industries have compressor electric power values lower than expected, this may indicate that these industries operate on partial load or that their cooling systems are not well sized.
Figure 3. Electrical power of refrigeration compressors vs. raw material use: handmade industries (left) industrial manufacturing industries (right).
The total volume of the cooling chambers is closely related to the type of stowage used, the amount of raw material processed and product permanence time inside. The results show that the industrial manufacturing industries have an average of 8 cooling chambers with an average volume of 264 m3, while the traditional handmade industries only have an average of 4 chambers with an average volume of 104 m3. According to fieldwork information, 48% of the cooling chambers are built in polyurethane panels with thicknesses of 60 mm (42%), 80 mm (39%) and 100 mm (19%). The remaining cooling chambers 52%, are built with other materials, with emphasis on the masonry and with thicknesses between 250 mm and 300 mm. The average
0 25 50 75 100 125 150 175 200 225 250 0 1000 2000 3000 Electrical Energy Consumption (MWh) Raw Material (kl) 0 250 500 750 1000 1250 1500 1750 2000 2250 2500 0 5000 10000 15000 20000 Electrical Energy Consumption (MWh) Raw Material (kl) 0 5 10 15 20 25 30 35 40 45 50 55 60 65 0 1000 2000 3000 Electrical Power of Refrigeration Compressors (kW) Raw Material (kl) 0 25 50 75 100 125 150 175 200 225 250 0 5000 10000 15000 20000 Electrical Power of Refrigeration Compressors (kW) Raw Material (kl)
ratio of the total electrical energy consumption by the total volume of the cooling chambers, presents values of 270 kWh/m3 for industrial manufacturing industries and 210 kWh/m3 for handmade industries. However, both categories display a high standard deviation showing that that these industries are using different amounts of electrical energy per unit volume of the cooling chambers. There is also a wide variation in the volume occupancy rate of the cooling chambers in both industries as shown in Figure 4.
Figure 4. Chambers total volume vs. raw material use: handmade industries (left) industrial manufacturing industries (right).
To perform the analysis of the energy performance of the different industries we consider the specific energy consumption (SEC) calculated according to Eq. (1).
) 1 ( RM E SEC
Where, E is the electrical consumption on annual basis (kWh), RM the amount of raw material (l) on annual basis, and SEC the specific energy consumption of electricity (kWh/l.RM). This indicator was used in many scientific studies to analyze the evolution of energy efficiency in industries (ICAEN, 2010; Ramirez et al., 2006, Wardrop, 1997). This indicator, provides information about the energy use per unit of production and can be used to characterize the energy performance of industries through benchmarking analysis. The SEC values are shown in Figure 5 to both categories and are within the range found in the literature for this type of industry: between 0.039 and 0.448 kWh/l.RM (Canales and Vidal, 2005) and between 0.22 a 0.3 kWh/l.RM (IFC, 2007).
0 200 400 600 800 1000 1200 1400 1600 1800 0 1000 2000 3000 Total Volume of Chambers (m3) Raw Material (kl) 0 500 1000 1500 2000 2500 3000 3500 4000 4500 5000 5500 0 5000 10000 15000 20000 Total Volume of Chambers (m3) Raw Material (kl)
Figure 5. Specific energy consumption of cheese manufacturing industries.
Since each category of industries, develop very similar activities, the difference of the SEC values, suggests different ways in energy use. In this case this indicator can be used to assess the potential for energy savings and also find out where they are carried out best practices that contribute to improve the energy efficiency of industries. Figure 5 show that 5 companies of traditional industrial manufacture category and 7 companies of traditional handmade category have specific value of electricity consumption SEC above their average values. If we use the average SEC value as a reference value for each of the industries’ categories, and all industries implement measures that will achieve the specific energy consumption, identical to the average values in each category, we expect an electrical energy saving of 19.4% on the industrial manufacturing industries and 20.8% on the handmade industries.
5. CONCLUSIONS
In this work we performed the energy characterization of traditional cheese making industries and quantified the potential energy savings that could be achieved. The traditional cheese industry includes both the industrial manufacturing companies and the handmade companies. We conclude that electrical energy represent 62% of the total energy consumption for the industrial manufacturing industries and 63.5% in the handmade industries. Within the traditional cheese making sector, well represented by our sample, the industrial cheese manufacturing companies are the largest energy consumers and those that have higher specific consumption of electrical energy with an average value of the SEC of 0.283 kWh/l.RM while the handmade ones have a correspondent value of 0.152 kWh/l.RM. These SEC values are within the range of the benchmarking indicators found in the literature for this type of industry.
6. REFERENCES
1. Afonso O, Cruz I, Azevedo P. 2012, Portugal Excepcional- Estratégia de Internacionalização do Sector
Agroalimentar 2012-2020, PotugalFoods e Gabinete de Planeamento e Politicas (GPP), Lisboa, Portugal,
314p.
2. Artés, F. 2004, Le rôle du froid dans le maintien de la qualité et l'amélioration de la sécurité des
produtis alimentaires d'origine végétale. L’Institut International du Froid, Bulletin de L'IIF 1, Paris.
3. Canales CC, Vidal AP. 2005, Guía de Mejores Técnicas Disponibles en España del Sector Lácteo. Ministério de Medio Ambiente, España.
4. DGAV. 2015, Estabelecimentos Aprovados de Géneros Alimentícios de Origem Animal-Regulamento
(CE) n.º853/2004-Secção IX-Leite e Produtos Lácteos, Direcção Geral de Alimentos e Veterinários,
Ministério da Agricultura e do Mar, Lisboa, Portugal.
5. Mikkelsen, P. 2014, World Cheese Market 2000-2020, PM Food & Dairy Consulting, Denmark, 700p. Coulomb, D., 2008. Refrigeration and cold chain serving the global food industry and creating a better
0.000 0.050 0.100 0.150 0.200 0.250 0.300 0.350 0.400 0.450 0.500 0.550 0.600
Plant 1 Plant 2 Plant 3 Plant 4 Plant 5 Plant 6 Plant 7 Plant 8 Plant 9 Plant 10 Plant 11 Plant 12 Plant 13 Plant 14 Plant 15 Plant 16 Plant 17 Plant 18 Plant 19 Plant 20 Plant 21 Plant 22 Plant 23 Plant 24 Plant 25 Plant 26 Plant 27 Plant 28 Plant 29 Plant 30 Plant 31
SEC (kWh/l.RM)
Cheese manufacturing industries
SEC of industrial manufacturing industries (kWh/l.RM) SEC average of industrial manufacturing industries = 0.283 kWh/l.RM SEC of handmade industries (KWh/l.RM) SEC average of handmade industries = 0.152 kWh/l.RM
future: two key IIR challenges for improved health and environment, Food Science & Technology 19, 413-417.
6. Fritzson A, Berntsson T. 2005, Efficient energy use in a slaughter and meat processing plant--opportunities for process integration, Journal of Food Engineering 76: 594-604.
7. Gautherin W, Fournaison L, Guilpart J. 2007. Évaluation des gisements d'économies d'énergie-Filière des produits laitiers et fromagers, Revue Générale du Froid & du Conditionnement d'air 1077: 31-40. 8. Gaspar PD, Silva PD, Nunes J, Andrade LP. 2014, Characterization of the specific electrical energy
consumption of agrifood industries in the central region of Portugal, Applied Mechanics and Materials 590: 878-882.
9. GPP, 2014, Anuário Agrícola 2013, Gabinete de Planeamento e Politicas (GPP) e Ministério da Agricultura e do Mar, Lisboa, 371p.
10. Guilpart J. 2009, L’audit énergétique appliqué au froid: Contenu, attendus, impacts, Viandes Prod.
Carnés 27 (2): 45-50.
11. ICAEN. 2010, Estudi i analisi dels resultats de les diagnosis energètiques en càmeres frigorifiques de fruita. Institut Català d'Energia, Department d'Agricultura Alimentació i Acció Rural, Catalunya,p144. 12. IFC. 2007. Environmental, Health, and Safeety Guidelines for Dairy Processing. IFC-International
Finance Corporation. World Bank Group. Washington, USA, 15p.
13. INE. 2014. Estatísticas Agrícolas 2013, Instituto Nacional de Estatística, I.P., Edição 2014, Lisboa, Portugal, 168p.
14. James SJ, James C. 2010. The food cold-chain and climate change. Food Research International 43: 1944-1956.
15. McFarland M, Bivens DB. 2007. Energie, efficacité et environnement. Revue Générale du Froid & du
Conditionnement d'air 1077: 42-47.
16. Mirade PS, Perret B, Guillemin H, Picque D, Desserre B, Montel MC, Corrieu G. 2012, Quantifying energy savings during cheese ripening after implementation of sequential air ventilation in an industrial cheesemaking plant, Energy 46: 248-258.
17. Nunes J, Neves D, Gaspar PD, Silva PD, Andrade LP. 2014, Predictive tool of energy performance of cold storage in agrifood industries: The portuguese case study, Energy Conversion and Management 88: 758–767.
18. Ramirez CA, Patel M, Blok K. 2006. From fluid milk to milk powder: Energy use and energy efficiency in the European dairy industry. Energy 31: 1984-2004.
19. Reindl DT, Jekel T B, Elleson JS. 2005, Industrial Refrigeration Energy Efficiency Guidebook. IRC, Industrial Refrigeration Consortium, The University Wisconsin, Madison.
20. Silva PD, Gaspar PD, Nunes J, Andrade LP. 2014, Specific electrical energy consumption and CO2 emissions assessment of agrifood industries in the central region of Portugal, Applied Mechanics and
Materials 675-677: 1880-1886.
21. Tassou SA, Lewis JS, Ge YT, Hadawey A, Chaer I. 2010. A review of emerging technologies for food refrigeration applications. Applied Thermal Engineering 30: 263-276.
22. Unido, 2010. Global Industrial Energy Efficiency Benchmarking, United Nations Industrial Development Organization, Vienna, Austria,76p.
23. Wardrop, 1997, Guide to Energy Efficiency Opportunities in the Dairy Processing Industry. Wardrop Engineering, Report for the Dairy Council of Canada, 36p.
24. Xu T, Flapper J. 2010, Reduce energy use and greenhouse gas emissions from global dairy processing facilities. Energy Policy: 39, 234-247.