Evaluating the use of ECG signal in low frequencies as a biometry
Eduardo José da S. Luz
a, David Menotti
a, William Robson Schwartz
b,⇑aUniversidade Federal de Ouro Preto, Computing Department, Ouro Preto, MG, Brazil
bUniversidade Federal de Minas Gerais, Computer Science Department, 31.270-010 Belo Horizonte, MG, Brazil
a r t i c l e
i n f o
Keywords: Biometrics ECG
Frequency sampling Majority voting scheme
a b s t r a c t
Traditional strategies, such as fingerprinting and face recognition, are becoming more and more fraud susceptible. As a consequence, new and more fraud proof biometrics modalities have been considered, one of them being the heartbeat pattern acquired by an electrocardiogram (ECG). While methods for sub-ject identification based on ECG signal work with signals sampled in high frequencies (>100 Hz), the main goal of this work is to evaluate the use of ECG signal in low frequencies for such aim. In this work, the ECG signal is sampled in low frequencies (30 Hz and 60 Hz) and represented by four feature extraction meth-ods available in the literature, which are then feed to a Support Vector Machines (SVM) classifier to per-form the identification. In addition, a classification approach based on majority voting using multiple samples per subject is employed and compared to the traditional classification based on the presentation of single samples per subject each time. Considering a database composed of 193 subjects, results show identification accuracies higher than 95% and near to optimality (i.e., 100%) when the ECG signal is sam-pled in 30 Hz and 60 Hz, respectively, being the last one very close to the ones obtained when the signal is sampled in 360 Hz (the maximum frequency existing in our database). We also evaluate the impact of: (1) the number of training and testing samples for learning and identification, respectively; (2) the sca-lability of the biometry (i.e., increment on the number of subjects); and (3) the use of multiple samples for person identification.
Ó2013 Elsevier Ltd. All rights reserved.
1. Introdution
The identification of a subject using a unique biological feature,
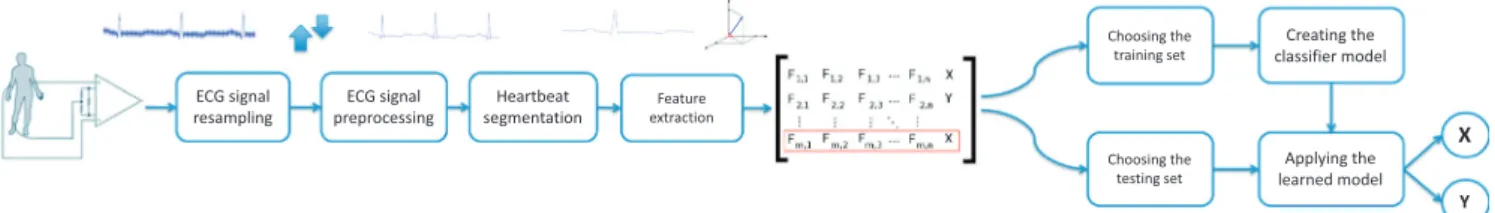
i.e., biometric feature, is very important in the society nowadays. Therefore, the study and development of automatic and accurate systems for such aim are a subject of high interest in the research community. Traditional strategies, such as fingerprinting and face recognition, are becoming more and more susceptible to frauds (Singha, Singhb, & Guptac, 2012). As a consequence, novel fraud proof biometrics modalities have been studied, such as the heart-beat pattern acquired by an electrocardiogram (ECG) (Odinaka et al., 2012). The ECG describes the variation of the electric activity produced by the heart as a function of time, as illustrated in the top row ofFig. 1. Its acquisition is extremely simple and non-invasive, which makes it easy to be employed as a biometry. According to
Odinaka et al. (2012), the ECG signal has been studied as a biome-try for more than one decade and has shown promising results.
Features extracted from the ECG signal can be categorized into three classes: fiducial, non-fiducial and hybrids of them. The first class considers the fiducial points extracted from the ECG signal,
as inChazal, O’Dwyer, and Reilly (2004) and Song, Lee, Cho, Lee, and Yoo (2005), which are more affected by the sub-sampling as illustrated inFig. 1. One can see the lost of information in lower frequencies (e.g., the R peak – the impulse locus). Methods based on non-fiducial features do not use fiducial points directly as fea-tures. For example, one can use the fiducial points Q, R and S to cre-ate a segment of the heartbeat. The length of the segment is considered a fiducial feature but if the area under the segment is used as a feature, it is considered a non-fiducial feature. Some authors do not use fiducial points to build the non-fiducial fea-tures, but segment the ECG signal into several parts that may (Li & Narayanan, 2010) or not (Yu & Chou, 2008) present overlapping. In addition, there are several authors (Güler & Übeyli, 2005; Yu & Chen, 2007) that use a mix of fiducial and non-fiducial features to create the feature vector. Such mix of classes of feature are called hybrids.
The first work using the ECG as a biometry was proposed by
Biel, Pettersson, Philipson, and Wide (2001), in which the authors reported an accuracy of 100% to identify 22 subjects using 12 fidu-cial points in the ECG curve, principal component analysis (PCA) to reduce the dimensionality and a generative model classifier (GMC) to identify the samples. After that seminal work, other methods have been proposed.Irvine, Wiederhold, and Gavshon (2001) re-ported accuracy of 91% to identify 104 subjects using 15 fiducial
0957-4174/$ - see front matterÓ2013 Elsevier Ltd. All rights reserved.
http://dx.doi.org/10.1016/j.eswa.2013.09.028
⇑ Corresponding author. Tel.: +55 31 3409 5860; fax: +55 31 3409 5858. E-mail addresses: [email protected], [email protected] (E.J.S. Luz),
[email protected], [email protected] (D. Menotti), [email protected],
[email protected](W.R. Schwartz).
Contents lists available atScienceDirect
Expert Systems with Applications
points chosen by Wilks Lambda Feature Selection and the Linear Discriminant Analysis classifier. Employing PCA and GMC,Zhang and Wei (2006)employed 14 features extracted from the fiducial points, which was able to identify 520 subjects with accuracy of 97.4%. Using an approach based on the wavelet coefficients ex-tracted from ECG,Chiu, Chuang, and Hsu (2008)achieved an accu-racy of 95.71% considering 45 subjects. Recently, in Fanga and Chanb (2013), a QRS detection-free ECG biometric based on the phase space trajectory of the ECG signal using a coarse grained-structure was proposed. They performed tests using 100 subjects and the achieved accuracy was 99% when using three-lead ECG. The high accuracies achieved by these works indicate the viability of using ECG as a biometry.
The ECG signal is usually sampled in high frequency (higher than 100 Hz) to capture features associated with cardiac diseases (Luz, Nunes, de Albuquerque, Papa, & Menotti, 2013). For this rea-son, the equipments that acquire the ECG signal (e.g.,Holter), are projected to sample the ECG signal in frequencies higher than 100 Hz.Sidek and Khalil (2013)investigated the impact of the sam-pling frequency of the ECG signal for the subject identification. In that work, the results showed that the increase in the sampling fre-quency provides a higher accuracy. However, the authors consid-ered samples with at least 128 Hz and not lower frequencies. To the best of our knowledge, there are no works in the literature that investigate the impact of the sampling in lower frequencies (<100 Hz) to perform subject identification, which will be one of the focus of this work.
This work investigates the viability and reliability of performing identification based on ECG sampled in low frequencies. From the ECG signals sampled in low frequency, four ECG feature extractors are employed to extract representations aiming at identifying sub-jects using a Support Vector Machines (SVM) classifier. Since in identification based on the ECG signal, each sample is a heartbeat, multiple samples of a subject can be acquired in a few seconds. Therefore, this work also evaluates the impact caused by changing the number of samples per subject used during training and test-ing. In addition, we employ a majority voting scheme since for each subject we can decide his/her identity using several heartbeats in-stead of a single one because we know that those samples belong to a single, but still unknown, subject. Hence, the evaluation of each sample does not need to be independent, one by one, such as in other biometrics such as picture-based face identification. According to the experimental results, the classification based on multiple samples using a majority voting scheme, referred to as
dependent classificationis more stable and accurate than the tradi-tional classification approach, referred to asindependent classifica-tion. Moreover, the biometry scalability (i.e., increment on the number of subjects) is also evaluated.
The experimental results, presented in Section3, show the via-bility of performing subject identification in low sampling frequen-cies (30 Hz and 60 Hz), which might guide new researches on heart-signal based biometry applications such as the usage of Eule-rian Video Magnification (Wu et al., 2012) (at 30 Hz from a video), smart mobile phone and video game control accelerometers (at 60 Hz or higher in practice for iPhone and Wii control) (Kwon, Lee, Chung, & Park, 2011).
The remainder of this work is organized as follows. The evalua-tion methodology considered in this work is presented in Secevalua-tion2. In Section3, the experiments performing the proposed evaluations are described and also a discussion regarding the results is pre-sented. Finally, in Section4, conclusions are pointed out.
2. Evaluation methodology
This section describes the methodology employed for perform-ing the proposed evaluations. First, the ECG signal is sampled in a specific frequency and then it is preprocessed. Then, ECG fiducial points are detected aiming at segmenting each heartbeat so that feature extraction might be executed. Once the features have been extracted, samples are randomly selected and this new set is then split into training and testing sets. The training samples are used to build subject’s models with a standard classifier (e.g., SVM), which are employed then to classify the testing samples. The flowchart in
Fig. 2illustrates the methodology and each step of the process is described in details in the following sections. Note that the ECG signal sampling step is omitted here because it is data dependent. It will be discussed in more details when the datasets are described in Section3.
2.1. ECG preprocessing
In the first step, the ECG signal obtained from different dat-abases publicly available are frequency normalized using simple linear interpolation. The preprocessing step aims at reducing the noise from the ECG signal, derived from muscular interference or more commonly from the power grid (50 Hz or 60 Hz). Finite im-pulse response (FIR) recursive digital filters are the mostly used for attenuation of these noises. In addition, signal amplitude nor-malization is also performed in the preprocessing step.
2.2. Heartbeat segmentation
The ECG segmentation consists of delimiting the heartbeat most interesting part, the QRS complex, its points (Sayadi & Shamsollahi, 2009), and other interesting fiducial points such as P and T points and the segments related to them. Such information is used by fea-ture extraction techniques. Once the QRS complex and fiducial points are segmented, one can obtain several physiological infor-mation such as the heart rate, length and amplitude of pulse. For performing the heartbeat segmentation task, there are in the liter-ature algorithms with accuracy near to the optimality (i.e., almost 100%) (Afonso, Tompkins, Nguyen, & Luo, 1999; Hu, Tompkins, Urrusti, & Afonso, 1990; Pan & Tompkins, 1985;Sayadi & Shamsol-lahi, 2009). However, in this work, we use databases in which this information was previously annotated.
2.3. Feature extraction
To evaluate different representations, four distinct set of fea-tures are extracted from the ECG signal. These sets were selected from works that use techniques largely disseminated in the litera-ture for representing a heartbeat to classify arrhythmia, in which the goal is to discriminate/classify a single heartbeat of a subject,
i.e., a single sample (Güler & Übeyli, 2005; Song et al., 2005; Yu & Chen, 2007; Yu & Chou, 2008). The feature extraction methods con-sidered in this work are detailed in the next paragraphs.
Song et al. (2005).The authors used the wavelet transform to ex-tract 15 features of each heartbeat. The wavelet transform allows the analysis of the signal in both time and frequency domain (Mallat, 1999). The heartbeat is represented by a 400 ms window of sampling points from ECG signal around the R peak. This dis-crete curve composed by these points is decomposed in seven lev-els of wavelet transform, in which only the detail subbands are used. Along with these wavelet features, other two features from the RR interval (temporal distance between the peak (R point) of two consecutive heartbeats/points): the RR interval between the current beat and its predecessor (RR-predecessor), the RR interval between the current beat and its successor (RR-posterior); were in-cluded to the feature vector, resulting in 37 features.
Güler andÜbeyli (2005). The authors also used the wavelet transform to decompose a ECG signal of 700 ms approximately sur-rounding the R peak in four detail and one approximation sub-bands. In order to reduce the dimensionality to 19 features, the authors have proposed the use of statistical techniques: absolute mean, standard deviation and power of the coefficients in each wavelet subband, besides the ratio of the absolute mean of the underlying subbands. The researchers highlighted that the choice of the mother Wavelet function used for feature extraction is cru-cial for the final effectiveness of the classification model. Thus, all methods re-implemented in this work that use the wavelet trans-form were carefully reproduced taking into account the same wavelet transform and mother function originally proposed by the authors of those works.
Yu and Chen (2007). In the work proposed in Yu and Chen (2007), the authors used statistical techniques directly on heart-beat samples and, also, in three wavelet sub-bands: details of the first level of wavelet transform decomposition and approximation and details of the second level one. It is also used the AC power of the original signal, the AC power of each wavelet sub-band, the AC power of the autocorrelation function of the coefficients of each sub-band, and the ratio between the maximum and minimum val-ues in each sub-band, adding up to 12 features. Besides these 12 statistical features, the authors also used the RR interval (RR-predecessor).
Yu and Chou (2008).The authors usedIndependent Component Analysis(ICA) for extracting 100 coefficients of a heartbeat com-posed of 200 sampling points centered at the R peak. The ICA coef-ficients are computed using the linearFast-ICAalgorithm proposed in Hyvärinen (1999)and only the 33 first coefficients are used. According to these researchers, the ICA is used to decompose the original ECG in a weighted sum of the components that are statis-tically and mutually independents. Besides these coefficients, it is included the RR interval (RR-predecessor), adding up to 34 features.
2.4. Sample classification
Usually, the effectiveness of subject identification methods is measured using the accuracy of heartbeat classification. In this
work, we propose to evaluate the effectiveness of this system using a majority voting scheme since for each subject we can decide his/ her identity using several heartbeats instead of a single one. Thus, in this work, we use two measures of accuracy in order to deter-mine the subject identification effectiveness. The first, referred to asindependent classification, is based on the traditional and inde-pendent approach in which the accuracy is calculated as the num-ber of correctly classified heartbeat over the total numnum-ber of heartbeats. The second, referred to as dependent classification, is based on a majority voting scheme considering the classification of a sequence of consecutive samples (heartbeats) obtained from a subject. A subject being classified for the dependent classification approach has assign the identity that appears the maximum num-ber of times, considering all his/her samples collected during one section.
After the feature extraction, a classification model is learned using the SVM algorithm (Cortes & Vapnik, 1995; Schölkopf & Smola, 2002) using a training database. This model is then used to evaluate a testing database. The SVM has been chosen as learn-ing algorithm since it is one of the most popular classifiers found in the literature and it has reported promising results for subject identification using ECG signal (Li & Narayanan, 2010; Ye, Coimbra, & Kumar, 2010).
2.5. Computational complexity
The computational complexity of this methodology is as fol-lows. All processes (ECG signal sampling, ECG signal preprocessing, heartbeat segmentation, and feature extraction), developed for predicting/identifying a sample/subject, have linear time complex-ity with respect to the number of sampled points in the ECG signal, except the classification phase, which is bounded by the type of the kernel used in the SVM and the support vectors learned on the training phase.
The learning phase, which involves the same steps of the pre-diction phase except the training phase, depends on the SVM algo-rithm, which is cubic in the worst case with respect to the training set and feature vector sizes. The implementation of the majority voting scheme using buckets for subject votes has also linear time complexity regarding the number of possible subjects to be classi-fied. Although the methodology described does not present a final linear time complexity, its runtime for evaluating heartbeats is suitable for real-time applications.
3. Experimental evaluation
In this section, we evaluate different sampling frequencies de-scribed by different feature extraction methods to assess the feasi-bility of ECG-based recognition in low sampling frequencies, such as 30 and 60 Hz. In addition, we evaluate the employment of the majority voting scheme (dependent classification) to subject identi-fication, the scalability of ECG signals by varying the number of subjects and the impact in the accuracies when changing the num-ber of training and testing samples for learning and identification, respectively.
3.1. The databases and experimental setup
There are several publicly available databases for evaluating systems aiming at the identification of patterns in ECG signals. Nonetheless, other non public databases have been also used in several studies. The popular databases are available in Physionet’s web (Moody & Mark, 2001) and in this work we chose four dat-abases from there: MIT-BIH Arrhythmia (MITDB), MIT-BIH Supra-ventricular Arrhythmia Database (MITSUP), MIT-BIH Normal Sinus Rhythm (NSRDB), and European ST-T (EDB).
The MITDB database contains 48 records of heartbeats, each one of approximately 30 min, sampled in 360 Hz, belonging to 47 dif-ferent patients/subjects (there are two records for a same patient). These records were chosen from a set of more than 4000 patient’s records usingholtersof theBeth Israel Hospital Arrhythmia Labora-tory(todayBeth Israel Deaconess Medical Center) from 1975s until 1979s. 23 out of 48 were randomly chosen from this large set. To obtain a balanced sampling of patients with varied heart diseases (i.e., arrhythmia), the remaining 25 records (to accomplish 48) were carefully selected. Among these 25, rare and hard to classify disease type situations were chosen in order to create a database with very different conditions. The ECG signals were acquired from 25 men varying between 32 and 89 years old and 22 women from 23 to 89 years old. Note that this database is the most researched one for arrhythmic studies.
The MITSUP database comprises 78 records of patients, with 30 min of duration each, sampled in 128 Hz, and has been pro-posed to be a complement of the MITDB. Its records also were ob-tained using holters of the Beth Israel Hospital Arrhythmia Laboratoryin the same epoch.
The NSRDB database includes records of 18 subjects acquired in the Arrhythmic Laboratory of theBeth Israel Hospital. These sub-jects were chosen to compose this database because they had no ‘‘visible’’ heart disease, that is, they had a healthy heart. This data-base is composed of records from 5 men (from 26 to 45 years old) and 13 women (from 20 to 50 years old). All these records were sampled in 128 Hz.
The EDB database is a collection of 90 records acquired from 79 subjects, sampled in 250 Hz. These records were extracted from 70 men (from 30 until 84 years old) and 8 women (from 55 until 71 years old). As all of these subjects were suffering from a specific cardiac disease (i.e., myocardial ischemia), the database was origi-nally built to allow ST-segment and T-wave analysis.
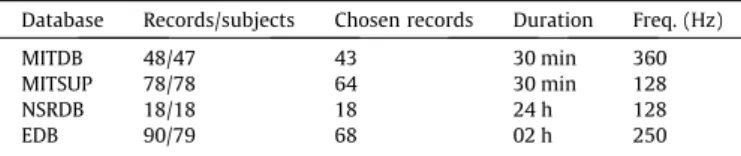
Table 1summarizes these figures with respect to the databases. It is important to note that: (1) Subjects with duplicated records are present in the MITDB and EDB databases and one of each dupli-cated record was discarded; (2) Records of subjects/patients using pacemakers were not selected; (3) Records of subjects/patients containing in majority arrhythmic heartbeats were not selected as well. Thus, those records of such subjects were not used, result-ing then on 193 subjects/records for our experiments.
The aforementioned databases were chosen mainly because they were made using the same type ofholter for acquiring the ECG signal of all subjects. In contrast, as the frequency sampling of these databases are different (seeTable 1, in Freq. column), it was required a frequency normalization process as stated in
previous sections. Indeed, all records were re-sampled using the maximum frequency among the database (360 Hz) by employing a simple linear interpolation process before the preprocessing phase of our methodology.
All experiments performed in this work were executed 30 times. Each time, an experimental set was created by choosing samples randomly fromninitially specified subjects to generate the training and testing sets. That is, for each run of an experiment set, the subjects used were randomly chosen from the database composed of 193 records. For each subject, a sequence of consecu-tive samples (heartbeats) are randomly chosen as well. The aver-age (
l
) and standard deviation (r
) of the effectiveness (i.e., accuracies) were computed. InFigs. 3 and 4, confidence intervals using 5% significance level are indicated as vertical bars in the plots and are built based onl
±r
. For the SVM, the regularization and the hyper-parameter for the RBF kernel were always set toC= 10 andc
= 1/(8f), in which fis the dimension of the feature vector used. It is important to note that all implementation codes in Matlab and datasets used in this work are publicly available.13.2. Experimental results
To evaluate the application of ECG as a biometry to more real-istic scenarios, we performed five types of experiments assessing different aspects of the identification: (1) feature extraction and the sampling frequency; (2) the number of samples used for train-ing and testtrain-ing; (3) the majority vottrain-ing scheme (dependent classifi-cation) compared to the independent classification; (4) the scalability of such biometric as a function of the number of subjects considered; and (5) sampling in lower frequencies.
It is important to remember that we used the overall accuracy as the evaluation metric computed in two ways: (1) traditional one (independent classification): the number of correctly classified samples divided by the number of samples presented to the sys-tem; (2) employing a majority voting scheme among multiple sam-ples of a same subject classified by the system (dependent classification).
Feature extraction and sampling frequency. In this experiment, we evaluate four feature extraction sets and different sampling fre-quencies (20 Hz, 30 Hz, 60 Hz, 120 Hz, 200 Hz, and 360 Hz), aiming at verifying their influence in the overall accuracy using 180 sub-jects/records (randomly chosen from the entire database com-posed of 193 records), 128 heartbeats (samples) from each subject for both training and testing. We have chosen 128 samples for testing/training as the maximum expected time (2 min or 120 s) that a person should be exposed for the subject identifica-tion process. The results are shown inTable 2and indicate that higher sampling frequencies result in higher accuracy to identify a subject, as expected. Note that, in this experiment, we employed the independent/traditional classification approach for computing the overall accuracy.
According toTable 2, experiments performed with the feature extraction method proposed bySong et al. (2005)show that the accuracy becomes stable when the sampling frequency reaches 60 Hz. The results obtained by the feature extraction proposed by
Güler and Übeyli (2005) drops under 360 Hz and dramatically drops under 60 Hz. Finally, the results obtained by the feature extractions proposed by Yu and Chen (2007) and Yu and Chou (2008)are not promised. Moreover is was not possible to extract features for these two feature extraction methods in low frequen-cies (60, 30, and 20 Hz) since more points than available are required. Due to that, the accuracies for such configurations are indicated as ‘‘–’’.
Table 1
Statistics summary of the databases used.
Database Records/subjects Chosen records Duration Freq. (Hz)
MITDB 48/47 43 30 min 360
MITSUP 78/78 64 30 min 128
NSRDB 18/18 18 24 h 128
EDB 90/79 68 02 h 250 1
From the figures inTable 2, we can observe that the accuracies obtained in low frequencies (20 Hz, 30 Hz, and 60 Hz) using the feature sets proposed inSong et al. (2005) and Güler and Übeyli (2005)for subject identification indicate promising results for dis-criminating subjects using the ECG signal. As the focus of this work is on low frequencies and high values of accuracy (>85%) the remaining experiments and evaluations consider only frequency sampling in 30 Hz or higher and only the feature extraction meth-od proposed inSong et al. (2005).
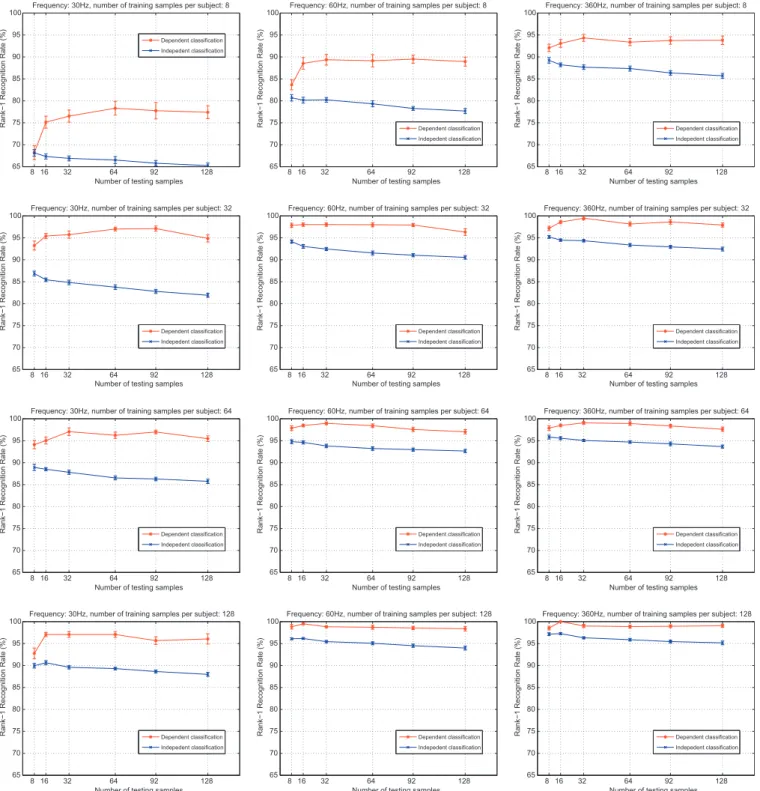
Number of samples for training and testing.This experiment aims at evaluating the influence of the number of samples used for learning and for identification.Fig. 3shows the results achieved
with different number of training (each row) and testing samples (x-axis of the plots). As a result, for a fixed sampling frequency (columns of theFig. 3), we can see that the more training samples are used, the more accurate the results are (for both types of accu-racy measures), which is an intuitive result since more information is been used. On the other hand, when a large number of testing samples are considered, the accuracy tends to reduces slightly. It is important to observe that, in general, the independent classifica-tion approach (accuracy measured in tradiclassifica-tional way) decreases slightly with the increase of testing samples. Nonetheless, the dependent classification approach implemented using the majority voting scheme achieves, in general, its highest scores using 16 or
8 16 32 64 92 128
65 70 75 80 85 90 95
100 Frequency: 30Hz, number of training samples per subject: 8
Number of testing samples
Rank−1 Recognition Rate (%)
Dependent classification Indepedent classification
8 16 32 64 92 128
65 70 75 80 85 90 95
100 Frequency: 60Hz, number of training samples per subject: 8
Number of testing samples Rank−1 Recognition Rate (%) Dependent classification
Indepedent classification
8 16 32 64 92 128
65 70 75 80 85 90 95
100 Frequency: 360Hz, number of training samples per subject: 8
Number of testing samples Rank−1 Recognition Rate (%) Dependent classification
Indepedent classification
8 16 32 64 92 128
65 70 75 80 85 90 95
100 Frequency: 30Hz, number of training samples per subject: 32
Number of testing samples Rank−1 Recognition Rate (%) Dependent classification
Indepedent classification
8 16 32 64 92 128
65 70 75 80 85 90 95
100 Frequency: 60Hz, number of training samples per subject: 32
Number of testing samples Rank−1 Recognition Rate (%) Dependent classification
Indepedent classification
8 16 32 64 92 128
65 70 75 80 85 90 95
100 Frequency: 360Hz, number of training samples per subject: 32
Number of testing samples Rank−1 Recognition Rate (%) Dependent classification
Indepedent classification
8 16 32 64 92 128
65 70 75 80 85 90 95
100 Frequency: 30Hz, number of training samples per subject: 64
Number of testing samples Rank−1 Recognition Rate (%) Dependent classification
Indepedent classification
8 16 32 64 92 128
65 70 75 80 85 90 95
100 Frequency: 60Hz, number of training samples per subject: 64
Number of testing samples Rank−1 Recognition Rate (%) Dependent classification
Indepedent classification
8 16 32 64 92 128
65 70 75 80 85 90 95
100 Frequency: 360Hz, number of training samples per subject: 64
Number of testing samples Rank−1 Recognition Rate (%) Dependent classification
Indepedent classification
8 16 32 64 92 128
65 70 75 80 85 90 95 100
Frequency: 30Hz, number of training samples per subject: 128
Number of testing samples Rank−1 Recognition Rate (%) Dependent classification
Indepedent classification
8 16 32 64 92 128
65 70 75 80 85 90 95 100
Frequency: 60Hz, number of training samples per subject: 128
Number of testing samples Rank−1 Recognition Rate (%) Dependent classification
Indepedent classification
8 16 32 64 92 128
65 70 75 80 85 90 95 100
Frequency: 360Hz, number of training samples per subject: 128
Number of testing samples Rank−1 Recognition Rate (%) Dependent classification
Indepedent classification
32 testing samples and its decrease rate with the increasing of test-ing samples is softer than the independent classification one. In some cases, the dependent classification accuracy is kept slightly as the same.
Majority voting.The usage of a majority voting scheme for com-puting the accuracy (here called dependent classification) is possi-ble in identification using ECG signal since several samples (heartbeats) can be collected from a subject in a small period of time and presented at once to the system because it is known that they belong to the same subject.Fig. 3shows the results achieved when the dependent classification (using majority voting scheme) is employed (red2curves) compared to the independent evaluation
of each sample (blue curves). The dependent classification ap-proach achieves higher recognition rates in the vast majority of the results (except in the top-left plot when the frequency is 30 Hz with 8 training and testing samples). In addition, the results indicate that after a certain number of testing samples, the accu-racy does not improve (32 samples), which means that the subject would need to stay no more than 30 s to be identified with high accuracy.
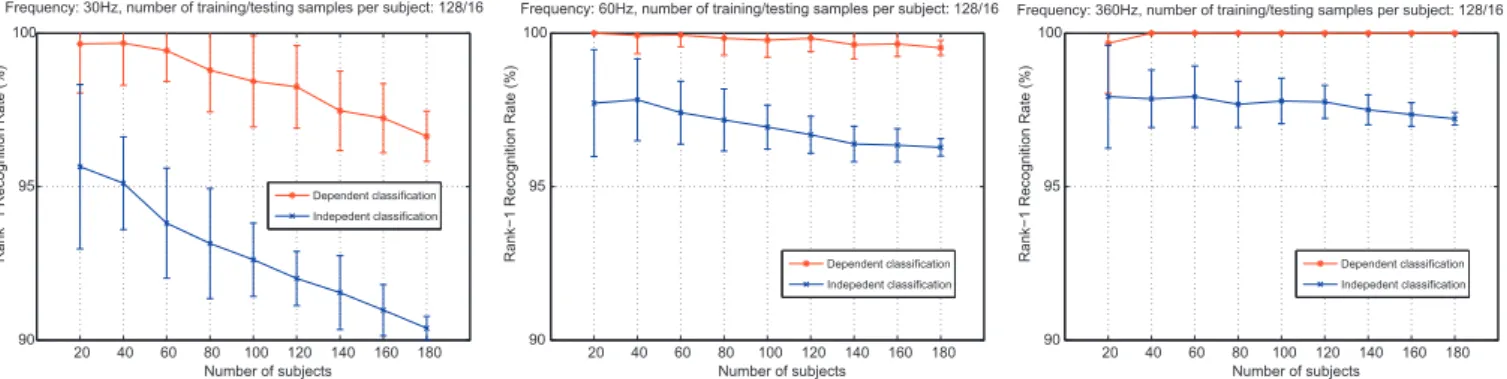
Scalability of the biometric system.The results shown inFig. 4
evaluate the scalability of the system as a function of the number of subjects, comparing the dependent classification (majority vot-ing scheme) to the independent classification. As intuitively ex-pected, in general, the accuracy reduces when more subjects are considered. However, for 60 Hz, when the dependent classification is considered, the reduction with the addition of new subjects is slower and even with 180 subjects, the accuracy is still promising (>99%). In particular, for 360 Hz both measures of accuracy does not have significant changes when the number of subjects is increased.
Frequency sampling comparison.It is also important to evaluate the impact in accuracy when the sampling frequency is reduced. Comparing column-wise the results shown inFig. 3, we can see that, in general, the accuracy increases with the frequency. How-ever, we can also say that the results obtained for ECG signal when sampled in 60 Hz are very close (or equivalent) to the ones in 360 Hz, when 64 or 128 training samples are used. Moreover, the dependent classification accuracy measure shows values higher than 95% when the frequency is sampled in 30 Hz, trained with 64 or 128 samples, and tested with more than 16 samples. These results, therefore, demonstrate the viability and reliability of per-forming subject identification using low frequency sampled ECG (30 Hz and 60 Hz).
4. Conclusions
In this work, we investigated several aspects of the subject identification problem based on ECG signal sampled in multiple frequencies. However, promising results were presented when using low frequencies for discriminating the subjects. In our exper-iments, the identification accuracy obtained for 180 subjects using the ECG signal sampled in 30 Hz and 60 Hz is greater than 95% and near to, respectively. Such results might allow new researches on heart-signal based biometry applications based on techniques such as Eulerian Video Magnification (Wu et al., 2012) using videos cap-tured in 30 Hz. A second important result is the one obtained with the majority voting scheme, referred to asdependent classification, providing high accuracy when several samples for a subject are classified at once.
Acknowledgments
The authors would like to thank FAPEMIG, FAPESP, CAPES, and CNPq for the financial support.
References
Afonso, V. X., Tompkins, W. J., Nguyen, T. Q., & Luo, S. (1999). ECG beat detection using filter banks.IEEE Transactions on Biomedical Engineering, 46, 192–202.
Biel, L., Pettersson, O., Philipson, L., & Wide, P. (2001). ECG analysis: a new approach in human identification.IEEE Transactions on Instrumentation and Measurement, 50, 808–812.
Chazal, P., O’Dwyer, M., & Reilly, R. B. (2004). Automatic classification of heartbeats using ECG morphology and heartbeat interval features. IEEE Transactions on Biomedical Engineering, 51, 1196–1206.
Chiu, C.-C., Chuang, C.-M., & Hsu, C.-Y. (2008). A novel personal identity verification approach using a discrete wavelet transform of the ECG signal. InInternational conference on multimedia and ubiquitous engineering (MUE)(pp. 201–206).
Cortes, C., & Vapnik, V. N. (1995). Support-vector networks.Machine Learning, 20, 273–297.
Fanga, S.-C., & Chanb, H.-L. (2013). QRS detection-free electrocardiogram biometrics in the reconstructed phase space.Pattern Recognition Letters, 34, 595–602.
Güler, I., & Übeyli, E. D. (2005). ECG beat classifier designed by combined neural network model.Pattern Recognition, 38, 199–208.
20 40 60 80 100 120 140 160 180 90
95 100
Frequency: 30Hz, number of training/testing samples per subject: 128/16
Number of subjects
Rank−1 Recognition Rate (%)
Dependent classification Indepedent classification
20 40 60 80 100 120 140 160 180 90
95 100
Frequency: 60Hz, number of training/testing samples per subject: 128/16
Number of subjects
Rank−1 Recognition Rate (%) Dependent classification
Indepedent classification
20 40 60 80 100 120 140 160 180 90
95 100
Frequency: 360Hz, number of training/testing samples per subject: 128/16
Number of subjects
Rank−1 Recognition Rate (%) Dependent classification
Indepedent classification
Fig. 4.Scalability evaluation. The recognition rate as a function of the number of subjects, varying from 20 to 180.
Table 2
Evaluation of the four feature extraction methods using 180 subject (randomly chosen from 193) and 128 samples for both training and testing. Each experiment was performed 30 times reporting its mean and standard deviation accuracy (l±r). 1 – Song et al. (2005), 2 –Güler and Übeyli (2005), 3 –Yu and Chen (2007), 4 –Yu and Chou (2008).
Freq. (Hz) Methods (accuracy in %)
1 2 3 4
20 76.5 ± 0.1 13.1 ± 4.9 – –
30 87.5 ± 0.1 12.4 ± 7.9 – –
60 93.6 ± 0.0 70.5 ± 0.2 – –
120 94.5 ± 0.0 76.4 ± 0.2 17.52 ± 0.1 30.96 ± 0.1
200 94.9 ± 0.1 78.7 ± 0.2 18.01 ± 0.1 39.11 ± 0.1
360 94.7 ± 0.1 86.4 ± 0.1 30.12 ± 0.1 33.19 ± 0.3
Hu, Y. H., Tompkins, W. J., Urrusti, J. L., & Afonso, V. X. (1990). Application of artificial neural networks for ECG signal detection and classification.Journal of Electrocardiology, 26, 66–73.
Hyvärinen, A. (1999). Fast and robust fixed-point algorithms for independent component analysis.IEEE Transactions on Neural Networks, 10, 626–634. Irvine, J. M., Wiederhold, B. K., Gavshon, L. W., et al. (2001). Heart rate variability: a
new biometric for human identification. InInternational conference on artificial intelligence(pp. 1106–1111).
Kwon, S., Lee, J., Chung, G., & Park, K. (2011). Validation of heart rate extraction through an iphone accelerometer. InIEEE international conference on engineering in medicine and biology society (EMBC)(pp. 5260–5263).
Li, M., & Narayanan, S. S. (2010). Robust ECG biometrics by fusing temporal and cepstral information. InProceedings of 20th international conference on pattern recognition (ICPR)(pp. 1326–1329).
Luz, E. J. S., Nunes, T. M., de Albuquerque, V. H. C., Papa, J. P., & Menotti, D. (2013). ECG arrhythmia classification based on optimum-path forest.Expert Systems with Applications, 40, 3561–3573.
Mallat, S. (1999).A Wavelet Tour of Signal Processing(2nd ed.). Elsevier Science.
Moody, G. B., & Mark, R. G. (2001). The impact of the MIT-BIH arrhythmia database. IEEE Engineering in Medicine and Biology Magazine, 20, 45–50.
Odinaka, I., Lai, P.-H., Kaplan, A., O’’Sullivan, J., Sirevaag, E., & Rohrbaugh, J. (2012). ECG biometric recognition: a comparative analysis. IEEE Transactions on Information Forensics and Security, 7, 1812–1824.
Pan, J., & Tompkins, W. J. (1985). A real-time QRS detection algorithm.IEEE Transactions on Biomedical Engineering, 32, 230–236.
Sayadi, O., & Shamsollahi, M. B. (2009). A model-based Bayesian framework for ECG beat segmentation.Physiological Measurement, 30, 335–352.
Schölkopf, B., & Smola, A. J. (2002).Learning with Kernels. MIT Press.
Sidek, K. A., & Khalil, I. (2013). Enhancement of low sampling frequency recordings for ECG biometric matching using interpolation. Computer Methods and Programs in Biomedicine, 109, 13–25.
Singha, Y. N., Singhb, S. K., & Guptac, P. (2012). Fusion of electrocardiogram with unobtrusive biometrics: an efficient individual authentication system.Pattern Recognition Letters, 33, 1932–1941.
Song, M. H., Lee, J., Cho, S. P., Lee, K. J., & Yoo, S. K. (2005). Support vector machine based arrhythmia classification using reduced features.International Journal of Control, Automation, and Systems, 3, 509–654.
Wu, H.-Y., Rubinstein, M., Shih, E., Guttag, J., Durand, F., & Freeman, W. T. (2012). Eulerian video magnification for revealing subtle changes in the world.ACM Transactions on Graphics (Proceedings SIGGRAPH 2012), 31.
Ye, C., Coimbra, M. T., & Kumar, B. V. K. V. (2010). Arrhythmia detection and classification using morphological and dynamic features of ECG signals. InIEEE international conference on engineering in medicine and biology society (EMBC) (pp. 1918–1921).
Yu, S., & Chen, Y. (2007). Electrocardiogram beat classification based on wavelet transformation and probabilistic neural network.Pattern Recognition Letters, 28, 1142–1150.
Yu, S., & Chou, K. (2008). Integration of independent component analysis and neural networks for ECG beat classification. Expert Systems with Applications, 34, 2841–2846.