Mariana M. B. Cardoso
Dissertation presented to obtain the
Ph.D degree in Biology | Neuroscience
Instituto de Tecnologia Química e Biológica António Xavier | Universidade Nova de Lisboa
Oeiras,
Insert here an image
with rounded corners
Endogenous and exogenous
hemodynamic signals in
Mariana Marcelino Belchior Cardoso
Dissertation presented to obtain the
Ph.D degree in Biology | Neuroscience
Instituto de Tecnologia Química e Biológica António Xavier | Universidade Nova de Lisboa
Endogenous and exogenous
hemodynamic signals in
primary visual cortex of alert
non-human primates
Financial Support
Acknowledgements
Thank you to the super-nine PGCN/INDP-2007: Íris, Isabel, José, Margarida, Maria, Patrícia, Patrício, Pedro, Rodrigo: colleagues and friends, over the past several years (better not to name how many) were of impressive support in different forms and moments. Thank you in particular
to Margarida without whom the “chapter thesis” would have been hard to
imagine possible, and cleaning my tears over my poor writing. Thank you to Íris for her unconditional positivism. Thank you, Zé, for letting me learn to appreciate your wonderful imagination.
Thank you to my advisor, Aniruddha Das. Who kept his door open at all times. That hosted me in his laboratory for a very, very long time; and was always patient with my slow progress. Thank you for the opportunity of working in your laboratory and access to such rich setups and data.
Thank you especially to Bruss Lima and Maria (Masha) Bezlepkina. Bruss was the most patient teacher I could have wished for. With you, Bruss, I got to learn about electrophysiology and I wish I could say I had not learnt the sound of dying neurons. Masha kept me sane when that was far from a given, thank you for that and the friendship. Thank you to the other mem-bers in the lab, Yevgeniy, I have learned a lot by overlapping with you in the
lab. Elena as well as Yana were wonderful ‘mothers’ when I arrived, thank
you. Thank you as well to the wonderful veterinary team, in particular thank you to Dr. Girma Asfaw, Dr. Rodolfo Ricart and Dr. Amy Cassano.
In the thesis will not be included early work done with rodents, but there were a few critical inspiring people that should still be acknowledged here: Mark Andermann, Daniel W. Wesson, Tomas Hromadka, Dinu Florin
Albeanu, Ashesh K. Dhawale. Also Marc Bucklin from Aniruddha Das’s lab,
that was always ready for a challenge.
priorities might be. Thank you, Angelie, with whom all is possible. Thank you Franco, if I had an old brother, I wish he would have been like you. Thank you to the early friends with whom I learned about the Big city: Gil, Joe, Yan and Renata: the first host. Thank to the friends that keep checking on me from afar, Mafalda, Fátima, Inês, Mónica, Pedro, Joana, Miguel, Lena. Thank you, Zach, Rui, Marta, for creating this wonderful program and scientific environment and giving me the opportunity to be part of it.
Thank you to my thesis committee, Christian and Michael, who were always supportive, positive and encouraging.
Thank you to the hosting institution, Columbia University, and specifically to a few people that handled my process efficiently and with a smile, Fred Loweff and Alla Kerzhner. Thank you also to the Champalimaud structure and organization: for the great flexibility and ease of working with.
Thank you, Stephan, for support and patience through the least fun times. Thank you to my family, Adelino, Isabel, Marta and Samuel, for the uncondi-tional support (even financial), help, energy and trust!
Resumo
O uso de técnicas de imagiologia cerebral (neuroimagem) em particular aquelas adequadas ao uso em humanos tem experienciado rápida dissemi-nação. E tem havido grande crescimento nas áreas de investigação que estudam a correlação entre actividade neuronal e processos cognitivos. No entanto os fundamentos neuronais dos sinais resultantes de neuroimagem não estão ainda totalmente caracterizados; esta é ainda uma área de intensa investigação. E no contexto de tarefas comportamentais/cognitivas, a interpretação de neuroimagem é ainda mais complexa.
Em sistemas sensoriais primários, há a perspectiva de que as respostas de neuroimagem reflectem sobretudo informação sobre estímulos sensoriais externos. Há vasta investigação que se foca no mapeamento de estímulos e classes de estímulos no córtex. No entanto, mesmo sistemas sensoriais primários podem conter informação sobre comportamento, como por exemplo estádios de comportamento. Por exemplo, embora o córtex visual primário responda principalmente a estímulos visuais, também é modulado por respostas como atenção. A forma como estas respostas estão codifica-das é fundamental para a interpretação de neuroimagem. Igualmente, compreender como diferentes aspectos das respostas de neuroimagem estão relacionados com a actividade neuronal subjacente é crucial para a interpretação de neuroimagem.
No laboratório tinha sido identificada uma resposta hemodinâmica
relacio-nada com execução de tarefas (task-related), no córtex visual primário de
resposta ajusta-se à duração da tarefa. Esta resposta confirma a presença de uma resposta endógena numa área sensorial primária. A ausência de correlação com a activitade neuronal (medida como alterações na frequência de potenciais de acção) reinforça a importância de compreender os mecanismos que estão na base da resposta hemodinâmica.
O trabalho apresentado nesta tese tem como objectivo auxiliar a interpreta-ção de neuroimagem, em particular tenta distinguir contribuições endóge-nas e exógeendóge-nas. Seguimos dois caminhos experimentais: um que tenta caracterizar as respostas hemodinâmicas relacionas com a apresentação de estímulos, e outra cujo objectivo é de compreender contribuições endógenas para o sinal. Em ambas as circunstâncias, para além de neuroimagem, foi medida actividade neuronal (na forma de potenciais de
acção locais, LFP, ou frequência de potenciais de acção neuronais locais).
Gravámos simultaneamente actividade de neuroimagem bem como de eletrofisiologia em primatas a executar tarefas periódicas. A técnica de neuroimagem utilizada, imagiologia óptica de sinais intrínsecos, baseia-se na absorção preferencial de luz visível pela hemoglobina presente em tecidos; trata-se portanto uma medida indirecta de metabolismo. Recolhemos dados no córtex visual primário, uma região cortical bem conhecida, com respostas neuronais a estímulos bem caracterizada e que anatomicamente se localiza na superfície do cérebro, portanto ajustada ao uso de imagem óptica intrínseca.
Dada a montagem experimental disponível no laboratório, há a possibili-dade de comparar dados de neuroimagem e electrofisiologia adquiridos simultaneamante (não típico aquando o uso de outras técnicas de neuroi-magem) o que nos coloca numa posição priveligiada para avaliar a relação entre neuroimagem e actividade neuronal. Utilizámos uma tarefa periódica com a apresentação de estímulos visuais com uma relação bem estabelecida entre propriedades do estímulo e actividade neuronal: usámos contraste do estímulo para testar uma gama de intensidades de actividade
monotó-nica: aumentos no contraste estão associados a aumentos na frequência de potenciais de acção (obedecendo uma função hiperbólica). Ao utilizármos contraste para induzir alterações previsíveis em actividade neuronal, observámos que numa tarefa periódica a resposta de neuroimagem reflecte a soma linear de uma componente exógena (relacionada com o estímulo) e outra endógena (relacionada com a tarefa). A componente relacionada com o estímulo tem uma relação linear com a actividade neuronal local (medida
como alterações na frequência de potenciais de acção).
Finalmente, queriamos também avaliar potenciais contribuições para a factores da resposta endógena (independente do estímulo) que possam contribuir para o sinal de neuroimagem. Usámos a mesma tarefa já antes utilizada do laboratório: fixação na ausência de estimulação visual (para além do ponto de fixação), observámos períodos em que o animal não
estava envolvido na tarefa estavam associados com alterações lentas na
resposta hemodinâmica. Para além da já mencionada resposta
hemodinâ-mica relacionada com execução de tarefas (task-related), propomos que o
envolvimento (engagement) numa tarefa tem uma contribuição significativa
Abstract
The advent of neuroimaging techniques in particular the ones suitable for studies in alert humans has disseminated fast. Research in fields involving neuro-correlates of cognitive processes has flourished. Still the neural underpinnings of the neuroimaging signals remain to be fully characterized; this field is an active topic of research. In the context of behavior/cognition, the interpretation of neuroimaging signals is even more intricate.
In early sensory systems, neuroimaging signals are thought to primarily car-ry information about sensocar-ry inputs; there is significant research focused on mapping evermore specific stimuli and stimulus classes to cortical regions. Nevertheless even early sensory systems can relay information on behavior, like brain states. For example, it is known that visual cortex even though primarily responding to visual stimuli, is also sensitive to such signals as attention. The way these signals are differentially encoded is critical in trying to interpret neuroimaging signals. Also how the different aspects of neu-roimaging signals related to underlying neuronal activity is critical for neuroimaging interpretation.
The work presented in this thesis aims helping our understanding of neuro-imaging, namely by trying to disambiguate endogenous from exogenous contributions to the imaging signal. We followed two lines of experiments: one aiming to characterize stimulus-related hemodynamic responses and other aiming to understand endogenous contributions to the signal. In both instances we also measured local neuronal activity (in the form of spikes and local field potentials).
We recorded simultaneously neuroimaging and electrophysiology signals from alert behaving monkeys trained to perform periodic tasks. We used intrinsic signal optical imaging techniques, which harvest the preferential absorption of visible light by hemoglobin in tissue, and are therefore an indirect measure of metabolism. We recorded activity from primary visual cortex; a cortical region with well characterized neural representations to external stimuli, anatomically on the brain surface allowing the use of intrinsic signal optical imaging.
Our ability to compare simultaneously acquired neuroimaging and electro-physiological signals (not trivial when using other imagining techniques) places us in a privileged position to evaluate the relationship of neuro-imaging to underlying neuronal activity. We used a periodic task with visual stimuli present with known relationship to electrophysiological activity: we used contrast to test a range of different intensities of changes in neuronal activity. Contrast and neuronal activity have a monotonic relationship: increases in contrast are associated with increases in spiking (following a hyperbolic function). Using contrast as a way of inducing controlled changes in electrophysiological activity, we observed that in a periodic task the imaging response reflects a linear sum of exogenous (stimulus-related) and endogenous (task-related) components. Moreover the stimulus-related com-ponent had a linear relationship with local neuronal activity (as evaluated by changes in firing rates).
In the same task previously used in the laboratory: fixation in the absence of visual stimulus (other than the fixation point), we observed that periods where the animal was disengaged from the task were associated with a
slow hemodynamic response change. Other than the aforementioned
task-related hemodynamic response, we propose that engagement in a task has
a significant contribution to slow changes in our imaging signal. We
Publications
Publication included in this thesis (Chapter 2 is a full reprint of the publication below)
Cardoso M*, Sirotin YB *, Lima B, Glushenkova E and Das A (2012). The
Neuroimaging Signal is a Linear Sum of Neurally Distinct Stimulus- and Task- Related Components. Nat. Neurosci. 15(9): 1298-306. (*Equal contribution.)
Publications not included in this thesis
Lima B, Cardoso M, Sirotin YB and Das A (2014). Stimulus-related
neuroimaging in task-engaged subjects is best predicted by concurrent spiking. J. Neurosci., 34(42): 13878-91.
Sirotin YB, Cardoso M, Lima B and Das A (2012). Spatial homogeneity and
task-synchrony of the trial-related signal. Neuroimage. 59: 2783-2797.
Publication in preparation (Chapter 4)
Cardoso M, Lima B and Das A. Slow drifts in brain blood volume are
Author Contributions
Chapter 2
Mariana Cardoso (MC) conducted the bulk of the experiments, data analysis and wrote the manuscript. Yevgeniy B Sirotin (YBS) designed the experiments, conducted the initial experiments, analyzed data and wrote the manuscript. Bruss Lima (BL) conducted the bulk of the experiments, contributed to analysis and wrote the manuscript. Elena Glushenkova (EG) contributed to the experiments. Aniruddha Das (AD) designed the experiments, analyzed the data, wrote the manuscript and supervised the project.
Remaining chapters
Abbreviations
ARI BOLD CCD COX-2 DMN EEG fMRI HbO HbT HbR LC LED LFP MUA NA NMDA OIIS TTX V1
arousal related index
blood-oxygen level dependent charge-coupled device
cyclooxygenase-2 default mode network electroencephalography
functional magnetic resonance imaging oxyhemoglobin
total hemoglobin deoxyhemoglobin locus coeurulus light-emitting diode local field potentials multi-unit activity norepinephrine
N-methyl-D-aspartate receptor optical imaging of intrinsic signals tetrodotoxin
Table of Contents
Financial Support ... ii
Acknowledgements ... iii
Resumo ... v
Abstract... viii
Publications ... xi
Author Contributions ... xii
Abbreviations ... xiii
Table of Contents ... xiv
1. Introduction ... 1
1.1 Hemodynamic responses in the brain ... 1
1.2 Neuroimaging: intrinsic signal optical imaging ... 2
1.3 Neural basis of intrinsic signal optical imaging ... 7
1.4 Thesis’s scope ... 11
2 The neuroimaging signal is a linear sum of neurally distinct stimulus- and task-related components. ... 13
2.1 Abstract ... 13
2.2 Introduction ... 13
2.3 Methods ... 15
2.3.1 Summary ... 15
2.3.2 Behavior and stimuli ... 16
2.3.3 Surgery, recording chambers and artificial dura ... 17
2.3.4 Hardware ... 17
2.3.5 Image pre-processing ... 17
2.3.6 Electrophysiology ... 18
2.3.7 HRF kernel fitting ... 18
2.3.8 Goodness of fit of predicted hemodynamics ... 19
2.3.10 Cross-validation of HRFSTIM kernels across sessions ... 20
2.3.11 Deconvolution ... 20
2.3.12 Checking the stability of our primary findings against variability in electrode recordings ... 21
2.4 Results... 22
2.4.1 Spikes poorly predict hemodynamics in periodic task ... 23
2.4.2 Modified linear model with two signal components... 25
2.4.3 Trial-related signal consistent in stimulus and dark room ... 31
2.4.4 Spikes poorly predict blank-trial and dark-room signals ... 36
2.4.5 Blank subtraction required to estimate spikes from imaging... 40
2.5 Discussion ... 44
2.6 Supplementary information ... 48
2.6.1 Appendix: Homogeneous Linear (‘Null’) and Modified Linear Model (MLM) of Spike-predicted Hemodynamics Appendix: Homogeneous Linear (‘Null’) and Modified Linear Model (MLM) of Spike-predicted Hemodynamics ... 48
2.6.2 Supplementary Figures ... 52
2.7 Acknowledgements ... 59
3 The hemodynamic task-related signal in primary visual cortex of alert non-human primates performing simple tasks ... 61
3.1 Introduction ... 61
3.2 Methods ... 63
3.3 Variable Trial Durations ... 64
3.4 Variable Fixation Durations ... 73
3.5 Variable Reward Amount ... 79
3.6 Task-related Hemodynamic Response in Visual Cortex to an Auditory-Motor Task ... 87
3.7 Discussion ... 94
4.1 Abstract ... 99
4.2 Introduction ... 100
4.3 Methods ... 104
4.3.1 Summary ... 104
4.3.2 Surgery, recording chambers and artificial dura ... 105
4.3.3 Behavior... 105
4.3.4 Imaging ... 106
4.3.5 Electrophysiology ... 107
4.3.6 Arousal Related Index (ARI) ... 108
4.3.7 Alertness metrics: brain movement and eyes open/closed ... 109
4.3.8 Interneuronal correlations: electrode pair-wise correlations . 109 4.3.9 Correlations between performance and different responses 109 4.3.10 Correlations between heart rate and hemodynamics ... 110
4.3.11 Cross-validation (k-fold cross-validation) ... 110
4.4 Results... 111
4.4.1 Hemodynamic mean trial response correlates inversely with engagement ... 111
4.4.2 Complex interplay between hemodynamics and heart rate .. 116
4.4.3 Different neural metrics and their correlation to engagement 119 4.5 Discussion ... 123
4.6 Acknowledgments ... 127
5 General Discussion ... 129
5.1 Exogenous responses in V1 ... 129
5.2 Endogenous responses in V1 ... 130
5.3 Future directions ... 133
5.3.1 Locus coeruleus – noradrenergic system ... 133
5.3.2 Neural basis of neuroimaging ... 134
1. Introduction
1.1 Hemodynamic responses in the brain
Understanding the functioning of the brain has captured our fascination for a long time. In the quest to understand the inner workings of the brain, several techniques have been developed. These range immensely in application and scope. In this thesis we used a combination of neuroimaging and electrophysiology to probe questions pertaining to the behaving brain. The space of questions that can be answered using neuroimaging in alert subjects is extremely vast. The questions addressed here have as seed the results found previously in the lab (Sirotin & Das 2009), where a task-related hemodynamic signal was described in alert non-human primates, when animals were engaged in a periodic fixation task. This hemodynamic task-related signal was observed in the absence of concurrent changes in local neuronal activity. In this thesis we aimed at understanding, firstly if the he-modynamic responses to external stimuli have a comprehensive relationship to underlying changes in spiking activity. Furthermore, we wanted to under-stand the correlations, if any, between the hemodynamic response and the behavior of the subjects; thus exploring also endogenous responses and not only responses to external sensory stimuli.
techniques aiming to record spiking activity tend to be still intrusive techniques not routinely performed in human subjects.
We recorded activity from the primary visual cortex (V1), which is the entry point of visual information into cortex. This is a structure on the cortical surface, which has been very well characterized in terms of its neural responses. Known properties of V1 date back to the seminal work by Hubel and Wiesel (Hubel & Wiesel 1968). V1 has a retinotopic organization, and not only is position relative to the fovea encoded in its responses, there are also several known properties of visual stimuli that can be differentially encoded in V1, as contrast, direction, orientation, spatial or temporal frequency. By combining optical imaging of intrinsic signals (OIIS) with simultaneous multi-unit electrophysiological activity (MUA) in V1, it is possible to address questions pertaining to the neural underpinnings of the neuroimaging response, as well as to improve our understanding of the signals encoded in visual cortex.
Finally, V1 is a cortical region dedicated to vision, but that receives modula-tory input from multiple structures in the brain. It is known to be influenced by endogenous variables such as attention (Bashinski & Bacharach 1980) or the timing of reward delivery (Shuler & Bear 2006, this is work with rodents). V1 is therefore particularly well positioned to study the contribu-tions of endogenous and exogenous signals into the hemodynamic respon-ses and their neural correlates.
1.2 Neuroimaging: intrinsic signal optical imaging
how one can identify vasculature in tissue, i.e., distinguishing arteries and veins below the skin, by visual inspection.
At different wavelengths, hemoglobin absorbs light differently. Depending on
hemoglobin’s redox state light is also absorbed differently (e. g. Zijlstra & Buursma 1997), hence it allows to distinguish changes in oxy-hemoglobin (HbO), deoxy-hemoglobin (HbR) and total blood volume (HbT; the sum of oxy- and deoxy-hemoglobin). OIIS at wavelengths equally absorbed by oxy- and deoxy-hemoglobin (isosbestic points, wavelengths of overlap of the absorption spectra) provides information about HbT. 530 nm is an isosbestic point. Another relevant wavelength is around 605 nm; at this wavelength HbR absorbs light around 5 fold more strongly than HbO. The combined imaging at the two wavelengths allows us to decompose the net response into HbO and HbR components (Sirotin et al. 2009); or, into blood volume and blood oxygenation components. Blood oxygenation is what is typically measured in functional magnetic resonance imaging (fMRI), blood-oxygen level dependent (BOLD) (Ogawa et al. 1990). Parenthetically, simultaneous recording of fMRI and OIIS signals show a good agreement between the two techniques, e.g. Jezzard et al. 1994, Fukuda et al. 2006 (in this latter study they used an isosbestic point, wavelength of 570 nm).
The data presented in this thesis was acquired at 530 nm (isosbestic point; green wavelength). This wavelength provides a larger percent signal change
than say the 605 nm (“deoxy-hemoglobin signal”), and is a signal with a known relationship between hemoglobin species (Sirotin et al. 2009). At this wavelength the hemodynamic signal is a proxy for changes in total blood volume.
aspects that can contribute to the global OIIS, as light scattering. In the intact brain, heart rate or breathing should also be taken into account, as there is evidence of their influence in the BOLD signal (Chang et al. 2009, Birn et al. 2008).
By using two different wavelengths in the same experiment (530, and 605 nm), we can distinguish arteries and veins. Arteries have low contrast when imaged at 605 nm, but veins have high contrast. At 530 nm, both arteries and veins should have similar contrast; hence comparing images acquired at these wavelengths permits distinguishing arteries from veins. Even though the results included on this thesis reflect changes measured with the 530 nm illumination wavelength, some measures were made using both 530 and 605 nm.
The intensity value resulting from the OIIS (light intensity from a CCD camera) is in arbitrary units; its absolute value is not informative, but
differential analysis can inform about changes in the hemodynamic species’
concentration.
Bonhoeffer and Grinvald (Bonhoeffer & Grinvald 1991) presented subtract-ion and divissubtract-ion methods for analysis of this type of data; they found similar results with either approach. In the experiments included in this thesis we used fractional changes of the light intensity reflected off the cortical surface, relative to the mean (light reflected), as a proxy for changes in concentration of total blood volume. In Chapter 2 we used fractional chan-ges in the intensity of light reflected off the cortical surface, here increases in blood volume are reflected as decreases in the fractional changes, but Chapters 3 and 4 use the negative of this change, in this case increases in
blood volume are reflected as increases in the signal’s fractional change
(this difference reflects publication history).
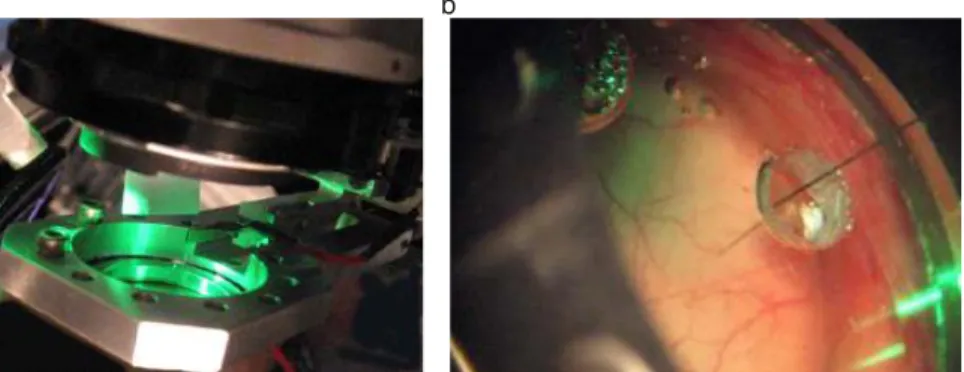
well as the electrode holder (another ring like structure with the capacity to hold one or two electrodes connected to electrode micro drivers). The imaging region is kept under sterile conditions and separated from contact with outside air (a titanium chamber encloses a clear glass, sealing the chamber). To ensure optical clarity the imaging chamber it is filled with a clear solution of agarose. A schematic of the setup can be found in Figure 1.1. In Figure 1.1a, one can see the edge of the imaging lenses, as well as the electrode holder (metal piece attached to recording chamber). The illumination system is composed of optical fibers coupled to LEDs, it produ-ces a uniform illumination profile as in Figure 1.1a. In Figure 1.1b is a close-up picture of the recording chamber, where can be noticed an aperture (through a silicon-coated glass, sealing the chamber) for one recording electrode.
Figure 1.1 – The experimental setup. (a) Picture of the setup illustrating:
imaging arrangement, with LED illumination of 530nm. (b). Picture of the
imaging region with single electrode.
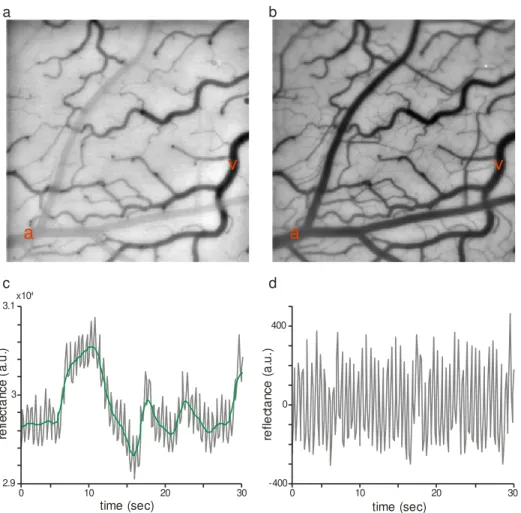
Images were acquired at 15 Hz (or 7.5 Hz, if two wavelengths were used). Below is a typical image (Figure 1.2a, b) from one of our experiments. Here it can be noticed the artery that comes on gray on Figure 1.2a and is dark in Figure 1.2b, has a different profile from veins (visible and dark on both images). When looking at the time series, at this imaging frequency, one
can clearly notice the effect of the brain’s pulsation (heart beat driven
palpitation) (Figure 1.2d). Pulsation can be removed by subtracting a high-pass filtered version of the imaging signal (Figure 1.2c). From this pulsation one can estimate heart rate.
The use of neuroimaging techniques ultimately aims at estimating neural activity, but neither OIIS nor BOLD fMRI, are direct measures of neural activity (review on BOLD interpretation, e.g. Logothetis & Wandell 2004).
Figure 1.2 Intrinsic signal optical imaging in V1. (a) Reflectance of cortical
surface with incident light of 605 nm. (b) Similar to a, but incident light of
530 nm. The letters in red: a – artery, v – vein. (c) Average reflectance for
the first 30 s of imaging (wavelength: 530 nm), in gray is raw signal and in green is the signal without the high frequency pulsation (low-pass filtered
version of the raw signal). (d) Pulsation signal observed at 530 nm on the
first 30 s of imaging.
a b
c d
0 10 20 30
2.9 3 3.1x10
4
time (sec)
re
fle
ct
a
nc
e
(
a.
u
.)
0 10 20 30
-400 0 400
time (sec)
re
fle
ct
a
nc
e
(
a
.u
.)
a
v
v
1.3 Neural basis of intrinsic signal optical imaging
In this section, I aim to bring attention to the complexity of the neuroimaging signals and their respective interpretations.
Spiking activity is an energetically demanding process for the brain, with several components of neural activity weighing in (Laughlin et al. 1998, Attwell & Laughlin 2001). Metabolic demand in the brain is mostly repleni-shed by the blood supply, as neurons do not have significant energy reserves. Therefore, if the relationship between neuronal activity and metabolic demand, and between metabolic demand and blood supply was linear, neuroimaging would have a clear relationship with underlying neuronal activity. However, there is ample evidence of a more complex
relationship. Thus, understanding the neuro-vascular coupling, the coupling
of spiking activity to metabolism and from metabolism to blood supply, will help interpret neuroimaging.
consumption in response to electric pulses (in rabbits’ isolated neurons, Ritchie 1967). Both glucose and oxygen consumption increase in response to neuronal activation, therefore measures of metabolism can be appropriate proxies for monitoring changes in neural activity. Ultimately, if hemodynamic changes reflect metabolism, then the hemodynamic response can be an attractive proxy for changes in neural activity.
Given the advent of techniques, such as fMRI that allows monitoring large portions of brain (virtually non-intrusively) make those increasingly relevant. It should be noted that OIIS requires the imaged surface to be exposed, making it an intrusive technique. The use of neuroimaging techniques should however be combined with research efforts on its interpretation. Intrinsic signal optical imaging also reflects light scattering from neuropil activation. Early work in isolated nerve cells showed that action potentials in unmyelinated isolated fibers cause birefringence changes as well as light scattering, in the visible light spectrum (Cohen et al. 1968). There is also evidence from work done in hippocampal slices, where transmitted and reflected light profiles were observed to be, on average, symmetric and opposite in sign. This suggests a bigger role for light scattering than light absorption with intrinsic signal optical imaging (Aitken et al. 1999). Work with intrinsic signal optical imaging in the olfactory bulb of anesthetized rodents used multiple imaging wavelengths to address whether the response to stimulating odors in olfactory glomeruli results more from light scattering in tissue with neuronal activation or from changes in HbO/HbR concentration in blood. In their case, they concluded that light scattering is in the origin of the imaging response (Meister & Bonhoeffer 2001).
Neuronal activity is responsible for other changes that can be accessed by looking at hemodynamic responses, other than direct light scattering
changes Functional hyperemia – increased blood flow in response to
neuronal activity – also contributes to hemodynamic changes. Astrocytes
Nedergaard 2007 and Attwell et al. 2010). Other than acting as a ‘relay
-system’ of neurons’ metabolic needs to the vasculature, there is also evidence that astrocytes also incur in metabolic cost following neuronal activity (Kasischke et al. 2004). This suggests that neurons are not the sole determinants of functional hyperemia.
There is also recent evidence relating specific cell activation and different neuronal pathways to BOLD fMRI. In Kahn et al. 2011, they used optogene-tic techniques in alert rodents and directly activated layer V neocoroptogene-tical pyramidal cells which resulted in an increase in BOLD response at the stimulated location, similar results were previously observed by other research group (Lee et al. 2010). In Kahn et al. 2013, they were able to relate that stimulation to spiking activity better than changes in local field potentials.
In summary, the hemodynamic responses are complex, reflecting metabolic and non-metabolic changes as well as hyperemia responses due to direct neuronal activity and changes observed in astrocytes. It is hard to interpret these responses; nevertheless its study is critical to the neuroimaging community. There are many questions that have not been fully answered and that will potentially change the current understanding of neuro-vascular coupling. Some of those are: how local is the hemodynamic response relative to the underlying neural activity? Are there specific hemodynamic responses that can help disambiguate the contribution of different cell types (e.g., excitatory neurons, inhibitory neurons, astrocytes)? Is the metabolic rate similar all across the brain? Is the vascular response similar for different brain areas? What are the effects of vasodilatation or constriction to flow in regions away from the focus of neural activity? What is the temporal relationship between neural activity and the ultimate hemodynamic respon-se? Can non-glutamatergic neurotransmitters also influence vasodilation and constriction?
anesthetized non-human primates: Grinvald et al. 1986, Lu & Roe 2007, behaving non-human primates: Shtoyerman et al. 2000, Sirotin & Das 2009). This thesis aims at adding information on this body of research.
1.4 Thesis’s scope
2 The neuroimaging signal is a linear sum of neurally
distinct stimulus- and task-related components.
2.1 Abstract
Neuroimaging (for example, functional magnetic resonance imaging) signals are taken as a uniform proxy for local neural activity. By simultaneously re-cording electrode and neuroimaging (intrinsic signal optical imaging) signals in alert, task-engaged macaque visual cortex, we recently observed a large anticipatory trial-related neuroimaging signal that was poorly related to local spiking or field potentials. We used these same techniques to study the interactions of this trial-related signal with stimulus-evoked responses over the full range of stimulus intensities, including total darkness. We found that the two signals could be separated, and added linearly over this full range. The stimulus-evoked component was related linearly to local spiking and, consequently, could be used to obtain precise and reliable estimates of local neural activity. The trial-related signal likely has a distinct neural mecha-nism, however, and failure to account for it properly could lead to substantial errors when estimating local neural spiking from the neuroimaging signal.
2.2 Introduction
evidence suggests that such a linear relationship reliably models the imaged responses to exogenous stimuli (Boynton et al. 1996; Engel et al. 1997; Buckner et al. 1998; Boynton et al. 1999; Grill-Spector & Malach 2001; Logothetis et al. 2001; Mukamel et al. 2005; Gardner et al. 2005; Boynton 2011). In alert, task-engaged subjects, however, the exogenous stimulus alone poorly predicts the full recorded neuroimaging signal. This mismatch is taken as evidence for additional endogenous non-sensory signals related to anticipation, attention and task structure (Jack et al. 2006; Sylvester et al. 2007; Donner et al. 2008). The neural mechanisms underlying these endo-genous signals have been proposed to be distinct from stimulus-evoked neural activity Jack et al. 2006; Sylvester et al. 2007; Donner et al. 2008. However, the neurovascular origins of these endogenous hemodynamic signals have not been directly investigated or compared with those of exo-genous sensory signals, such as with extracellular electrode recordings, as most neuroimaging studies of alert, task-engaged individuals involve human subjects (but see refs. Mukamel et al. 2005; Maier et al. 2008).
We recently Sirotin & Das 2009 compared the neural correlates of stimulus-evoked and endogenous hemodynamic signals directly in alert macaque primary visual cortex (V1) by combining electrode recordings with simul-taneous intrinsic-signal optical imaging (Bonhoeffer & Grinvald 1996 Shtoyerman et al. 2000) (a high-resolution optical analog (Fukuda et al. 2006; Kennerley et al. 2009) of fMRI that visualizes local changes in blood volume and oxygenation (Bonhoeffer & Grinvald 1996, Sirotin et al. 2009)). When the animals performed a periodic visual fixation task, their V1 hemo-dynamic response revealed a particular anticipatory endogenous signal
(hereafter referred to as the trial-related hemodynamic signal, T) that
In our earlier work (Sirotin & Das 2009), we only compared brain signals at the two extremes of visual drive. To measure stimulus-evoked signals, we used near-maximal stimulus intensities at which the visual input dominated; meanwhile, we characterized the trial-related signal only in essentially complete darkness. A question not explored in the earlier work was how these signals would interact when presented together in different propor-tions in routine visual tasks involving stimuli of varied intensities, and how this admixture of signals would affect the interpretation of brain images. We addressed these questions using our technique of simultaneous optical imaging and electrode recording in alert, task-engaged macaques. Here, however, we presented visual stimuli over the full contrast range (0% to 100%); for some experiments, we also included trials in complete darkness. This allowed us to test whether the net imaging signal could be separated into stimulus-evoked (that is, correlated with stimulus contrast and evoked neural spiking) and trial-related components (dependent on task structure, but not stimulation or local spiking) over a full range of V1 spiking and hemodynamics. Furthermore, as the primary use of neuroimaging is to estimate local neural activity (often done implicitly, but also quantitatively by deconvolving the imaging signal using an HRF (Glover 1999)), we examined the accuracy of this estimate with and without correcting for the trial-related signal.
2.3 Methods
2.3.1 Summary
Simultaneous intrinsic-signal optical imaging and electrophysiology were
acquired from alert macaques engaged in passive fixation tasks (n = 34
in accordance with the US National Institutes of Health Guide for the Care and Use of Laboratory Animals and were approved by the Institutional Animal Care and Use Committees of Columbia University and the New York State Psychiatric Institute.
2.3.2 Behavior and stimuli
Animals held fixation periodically for juice reward, cued by the color of a
fixation spot (fixation window, 1.0–3.5 degrees in diameter; monitor
distan-ce, 133 cm; fixation duration, 3–4 s; trial duration, 10–20 s). For experiments
with visual stimulation, stimuli consisted of sine-wave gratings (contrasts, 0% (blank), 6.25%, 12.5%, 25%, 50% and 100%; mean luminance =
back-ground luminance = 46 cd m−2; spatial frequency, 2 cycles per degree; drift
speed, 4 degrees per s; diameter, 2–4 degrees; orientation optimized for the
2.3.3 Surgery, recording chambers and artificial dura
After the monkeys were trained on visual fixation tasks, craniotomies were
performed over the animals’ V1 and glass-windowed stainless steel recor-ding chambers were implanted, under surgical anesthesia, using standard
sterile procedures (Shtoyerman et al. 2000), to image a ~ 79mm2 area of V1
covering visual eccentricities from ~1 to 5°. The exposed dura was resected and replaced with a soft, clear silicone artificial dura. After the animals had recovered from surgery, their V1 was optically imaged, routinely, while they engaged in the fixation task. Recording chambers and artificial dura were fabricated in our laboratory using published methods (Arieli et al. 2002).
2.3.4 Hardware
Camera, Dalsa 1M30P (binned to 256 × 256 pixels, 7.5 or 15 frames per s); frame grabber, Optical PCI Bus Digital (Coreco Imaging). Software was developed in our laboratory based on a previously described system (Kalatsky & Stryker 2003). Illumination, high-intensity LEDs (Agilent Techno-logies, Purdy Technologies) with emission wavelength centered at 530 nm (green, equally absorbed in oxy- and deoxyhemoglobin). Lens, macroscope of back-to-back camera lenses focused on the cortical surface. Imaging, trial data (trial onset, stimulus onset, identity and duration, etc.) and behavioral data (eye position, pupil size, timing of fixation breaks, fixation acquisitions, trial outcome) were acquired continuously. Data analyses were performed offline using custom software in MATLAB (MathWorks).
2.3.5 Image pre-processing
function runline.m (typical heart rates were ~2–3 Hz, much faster than the typical hemodynamic response frequencies of ~<0.5 Hz).
2.3.6 Electrophysiology
Electrode recordings were made simultaneously with optical imaging.
Recording electrodes (FHC, AlphaOmega; typical impedances were ~600–
1,000 kΩ) were advanced into the recording chamber through a silicone -covered hole in the external glass window, using a custom-made low-profile microdrive. Recording sites were mostly, but not exclusively, confined to upper layers. Signals were recorded and amplified using a Plexon recording system. The electrode signal was split into spiking (100 Hz to 8 kHz
band-pass) and LFP (0.7–170 Hz); LFP data not shown. No attempt was made at
isolating single units and all measured spiking was MUA (defined as each negative-going crossing of a threshold = ~4× the r.m.s. of the baseline obtained while the animal looked at a grey screen (Sirotin & Das 2009)). The MUA signals were then high-pass filtered to remove slow drifts (>30 s), down sampled to the imaging frame rate (7.5 or 15 samples per s) and aligned offline with the images.
2.3.7 HRF kernel fitting
Each HRF was modeled as a gamma-variate function kernel of the form
where = (T/W)2 *8.0*log(2.0), =W2/(T*8.0*log(2.0)), A is the amplitude, T
is the time to peak and W is the full width at half maximum (Cohen 1997;
relevant signals across contrasts, aligned to trial onsets, for correct trials
alone. Thus, HRFSTIM was obtained by fitting a periodic pattern of the mean
SSTIM to the mean HSTIM, the HRFNULL by fitting the mean S to the mean H
(over correct trials alone), the HRFBLANK by fitting the mean SBLANK to the
mean HBLANK, and the HRFDARK by fitting the mean SDARK to the mean HDARK.
2.3.8 Goodness of fit of predicted hemodynamics
Fit was quantified as R2 = 1 − (variance of the residual error)/(variance of
measured hemodynamics) (Supplementary Note, equation (10)), expressed
either separately for each contrast or as mean R2, that is, calculated for the
mean signals averaged across all contrasts. For all fits other than of the blank signal, predictions (and residual errors) were calculated by convolving the full raw measured spike trace with the relevant HRF and then separating later into correct trials by contrast, or averaging across contrasts. This is more reliable than convolving synthetic periodic functions constructed from mean signals because with periodic functions there is a risk of getting a match, not with the true signal, but with a signal phase-shifted by a fraction of a trial period (Das & Sirotin 2011). Such mismatches are highly unlikely in the measured signal with its random sequence of stimulus intensities and corresponding evoked hemodynamics (Das & Sirotin 2011). The blank
signal fit using HRFBLANK was tested using periodic functions, as in this case
we were testing the fit using a kernel that specifically did not fit the full stimulated spike sequence.
2.3.9 Bootstrapping to get confidence limits on R2
For each experiment, 200 bootstrap data sets were constructed, each with the same number of trials as the original, using random resampling with replacement (Supplementary Figure 2.10). The resampled hemodynamic and spike trials were then fitted against each other separately for both
(Supple-mentary Note, equation (10)). The 95% confidence limits were obtained by
taking the 2.5th to the 97.5th percentiles; similarly, 80% confidence limits by
taking the 10th to the 90th percentile. Random reselection was done
separa-tely by contrast to have the same number of trials per contrast. However, each contrast used the same random number set to maintain stimulus blocks and reduce variability resulting from long-term drifts in physiology or recording stability. This was particularly necessary for the MLM, which
involves subtracting the mean blank signals HBLANK and SBLANK from all other
contrasts; if blocks are not maintained, this subtraction leads to a number of noisy outliers in the bootstrap estimate when a set of blanks trials dominated by one epoch of a session (for example, high signal) is subtracted from nonblank trials dominated by a different epoch (for example, low signal).
2.3.10 Cross-validation of HRFSTIMkernels across sessions
For each session, we created a leave-one-out mean HRFSTIM kernel by
averaging the two timing parameters (peak latency and width) across all kernels excluding the given one. Kernel amplitude was obtained by fitting,
using this mean kernel to fit the given session’s data (HRFSTIM amplitude depends on an arbitrary scale factor in electrode recording; Supplementary Figure 2.11). This leave-one-out mean kernel with the best fitted amplitude was then used to obtain the cross-validation prediction and corresponding
R2. Cross-validation was performed either across all animals or restricting
the leave-one-out averaging to other kernels for the given animal.
2.3.11 Deconvolution
The spike trace estimated by deconvolution was defined as
where H is the relevant hemodynamic signal, HRF is the corresponding
transforms, respectively. Given that F(HRF) has low power at high frequencies, reflecting the slow hemodynamic response, we filtered using a Hamming window with a 0.5-Hz cutoff in frequency space. This avoided high-frequency noise in the hemodynamic signal from being amplified during deconvolution. The same filter was used to discount high frequencies in the measured spike rate before correlating with the deconvolved estimate.
2.3.12 Checking the stability of our primary findings against variability in electrode recordings
If measured spiking S is a veridical scaled sample of the true spiking s of
our models despite measurement variability across experiments (different electrodes, different thresholds for spike detection for MUA), then the
amplitude of the fitted HRF should simply scale inversely with measured
spiking for a given experiment (Supplementary Figure 2.11 and Supplementary Note, equation (7))
The scale factor (between the measured S and the true s) will cancel out in
all equations for a given experiment, leaving model features unchanged
(that is, kernel shape, trial-related signal T and R2). We tested for this in two
ways. First, we tested the effect of varying spike detection thresholds. In five experiments, we recorded the electrode signal at a low threshold and then
rethresholded off-line to generate multiple sets of spiking data S for the
same imaging data (for example, peak spike rates from about 300 s−1 to
about 10 s−1 for progressively higher thresholds; Supplementary Figure
2.11a,b). These rethresholded spike data were then fitted separately against
the common imaging signal (Supplementary Figure 2.11c–g). In a second
test, we checked the linearity of the relation linking HRFSTIM amplitude
against the inverse of the SSTIM amplitude over our full data set (integration
window for mean SSTIM coextensive with stimulus duration as in Figure 2.2a;
2.4 Results
For these experiments, we used three rhesus macaques (monkeys Y, T and
S; n = 34 recording sites across five hemispheres; monkey S was also used
previously (Sirotin & Das 2009)). The animals’ task, which was cued by the
color of a fixation spot, involved fixating and relaxing (that is, free viewing) periodically for a juice reward. This task is known to evoke robust trial-related signals in V1 (ref. Sirotin & Das 2009). A trial typically comprised a
single fixation, with fixed trial periodicity of 10–20 s. For one set of
experiments, trials consisted of sequences of two or three fixations, each rewarded for correct fixation. Visual stimuli comprised drifting sine-wave gratings that were presented passively while the animal fixated. The grating contrast was typically varied in five log2 steps plus a blank, presented in randomized order; the contrasts varied in some experiments and grating orientation was optimized for each electrode recording site. In addition, to compare with our earlier results (Sirotin & Das 2009), we performed a set of experiments in darkness (see Online Methods).
al. 2009; Devor et al. 2003; Sheth et al. 2004; Nemoto et al. 2004). The monophasic stimulus-triggered response makes the imaging signal easy to interpret and to model mathematically (see Supplementary Note).
2.4.1 Spikes poorly predict hemodynamics in periodic task
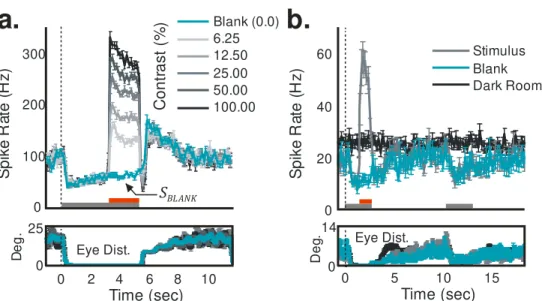
Our recordings showed, as expected, stimulus-driven spiking and hemody-namic responses with amplitudes monotonically reflecting stimulus contrast trial by trial (Figure 2.1). In addition, many recordings revealed a robust spiking signal locked to trial onset that was common to all of the spike traces
and was most evident for blank trials (SBLANK; Figure 2.1b). Additional
evi-dence suggests, however, that this blank-trial spiking, maintained low during fixation and high in between fixations, is also visual (Supplementary Figure 2.8). The time course of this signal matched that of the animal’s eye traces
(Supplementary Figure 2.8a), and it was extinguished in the dark, even
Figure 2.1 – The full hemodynamic signal is poorly predicted by local
multi-unit spiking. (a) Top, a section of the full recorded spiking signal (S) for a
representative experimental session (black trace). Bottom, corresponding measured hemodynamic signal (H, black) and the best prediction obtained
from spiking (orange, S, indicates convolution;
Supplementary Note, equation (3)). Inset, best fitting kernel HRFNULL
(ampli-tude normalized) obtained by fitting H to S. Mean R2 = 0.49, as calculated
using mean signals averaged across contrasts (n = 261 trials total, roughly
43 per contrast). Red line segments indicate stimulus application and vertical dotted lines indicate fixation trial onset. Red and black arrows below traces indicate typical responses to high-contrast (100% contrast) and blank (0% contrast) stimuli, respectively; for hemodynamics, increasing negative amplitudes, that is, increasing absorption of light by cortex, equals increasing blood volume. Note the poor match between the observed and
predicted traces leading to a large residual and, consequently, low mean R2.
(b) Trial-aligned averages of spiking (S) for each contrast. The trial structure
is indicated by the color bars (gray, fixate; red, stimulus; no bar, relax). Note
the prominent blank-trial spiking signal SBLANK. (c) Data presented as in b for
hemodynamics (H). (d) Data are presented as in b for corresponding
predicted hemodynamics (solid lines, top) and residuals (H
,
dotted lines, bottom; separated vertically for visibility). Individual R2,
calculated separately per contrast, are shown alongside each prediction. Data were obtained from monkey S. Error bars represent s.e.m.
b.
Time (sec)
0 2 4 6 8 10 c. dR /R 0.02 -0.04 0 -0.02 Time (sec)
0 2 4 6 8 10
Blank (0.0) 6.25 12.50 25.00 50.00 100.00 S pi ke r at e (H z) 0 100 200 300 C on tr as t ( % )
Spikes , all correct trialsS Hemo , all correct trialsH
trial sequence: grey: 'fixate', red: ‘stim’; rest of trial: ‘relax;
d.
0
Time (sec)
0 2 4 6 8 10
dR
/R
0
-0.02
a.
800 850 900 950 1000 -0.04 0 0.04 0 200 400 S pi ke r at e (H z) dR /R Time (sec) 0 -1 0 15 R2 = 0.49 HRF
N UL L
Predicted Residual -4.21 -0.12 0.26 0.46 0.590.58 S BL ANK
To set a null model baseline for alert, task-engaged monkeys, we first determined how well the full recorded local spiking could predict the full
recorded hemodynamics. We linearly fitted the measured hemodynamics H
to spiking S to generate an optimal linear kernel, HRFNULL, and the
corres-ponding predicted hemodynamic trace (Figure 2.1a and Supplementary Note, equation (1)). Although the prediction appeared to be qualitatively reasonable, quantitatively the match with measured hemodynamics was
mediocre, with mean R2 = 0.49 (the value calculated for the mean signal
averaged over all contrasts; R2 is defined as 1 − (variance of residual
error)/(variance of measured signal); Supplementary Note, equation (10)). The inadequacy of the fit was even clearer when we compared predictions
with measured signals, contrast by contrast. We obtained poor R2 and large
residuals that varied with stimulus contrast (Figure 2.1d). Notably, R2 was
poorest for blank trials (0% contrast, R2 = −4.21, a negative number as the
residual was larger than the measured signal) and improved systematically for stimuli of higher contrast. This suggests that, at low spike rates, the hemodynamic signals may be dominated by non-spike-related components, independent of visual input, such as the previously demonstrated trial-related signals (Sirotin & Das 2009). Note that the blank-trial spiking signal
that adds uniformly to all the spiking responses (SBLANK; Figure 2.1b) is
unlikely to be the cause of this mismatch. Being presumably visual, the blank-trial spiking should have linearly predictable hemodynamic correlates, similar to the hemodynamic correlates of the controlled stimuli.
2.4.2 Modified linear model with two signal components
hemo-dynamic signal (Sirotin & Das 2009), a signal that is only present in correct trials Sirotin et al. 2012. To keep the model as simple as possible, we assumed that the trial-related signal adds linearly (Jack et al. 2006; Donner et al. 2008; Fox et al. 2006) to the visually evoked component; this visually evoked hemodynamic component, we still assumed to be uniformly linearly predicted by visually evoked spiking (Boynton et al. 1996; Heeger et al. 2000; Rees et al. 2000), whether driven by controlled stimulation or uncon-trolled visual input (as in the blank-trial spiking). We further assumed that the trial-related signal is stereotyped, determined by trial timing alone and is uniformly present in all trials types independent of whether the trial has a visual stimulus or a blank or involves dark-room fixation (Supplementary Note, equation (2)).
This posited structure of the MLM led to two important predictions. First, it predicted that, during visually stimulated tasks, the trial-related hemodyna-mic signal could be linearly separated from visually evoked responses by
subtracting the blank-trial hemodynamic response (HBLANK: Supplementary
Figure 2.9 and Supplementary Note, equations (4–6)). Note that this step
also uniformly subtracts the hemodynamic correlate of any uncontrolled
blank-trial spiking (that is, SBLANK), thereby revealing responses to the
con-trolled visual stimulus alone. We defined this blank-subtracted signal as the
stimulus-evoked hemodynamics, HSTIM; it should be linearly related to the
stimulus-evoked spiking, SSTIM, obtained by subtracting blank-trial spiking
from the other spike traces. The HRF kernel for the linear part of the MLM could then be estimated by fitting these stimulus-evoked signals against each other (Supplementary Note, equation (7)). Second, it predicted that the trial-related hemodynamic signal seen in visually stimulated tasks should match that seen in dark-room fixation tasks of the same trial timing
(Supple-mentary Note, equations (2, 4–9)). As a corollary, it predicted that the
The MLM led to a marked improvement over the null model. This can be illustrated using the data set described above (Figure 2.1), where blank
subtraction led to crisp orderly sequences of SSTIM (Figure 2.2a) and HSTIM
(Figure 2.2b). The optimal kernel HRFSTIM (Figure 2.2c and Supplementary
Note, equations (7,8)) obtained by fitting these stimulus-evoked signals to
each other gave a mean R2 of 0.99 (versus R2 = 0.49 for the null model;
Figure 2.1a,d). The same kernel also made reliable predictions for each
individual contrast, closely matching corresponding measured signals HSTIM,
with high R2, and weak and contrast-independent residuals (Figure 2.2c). To
assess the statistical significance of these comparisons, we estimated
confidence intervals for each value of R2 with a bootstrap technique using
random selections of the given day’s trials with replacement (200 runs per
experiment, see Online Methods). The estimated 95% confidence limits
obtained for all R2 calculated using the MLM, mean as well as separately by
contrast, were comfortably non-overlapping with those of corresponding R2
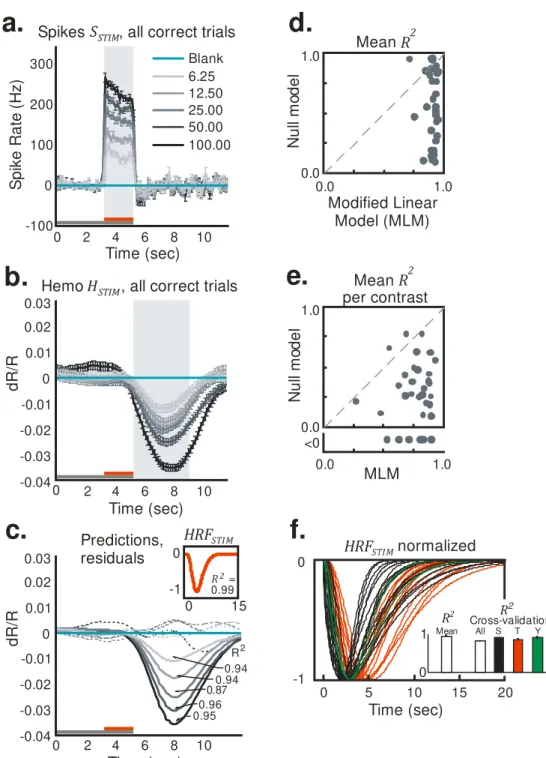
Figure 2.2 – Results using the MLM: stimulus-evoked (blank subtracted)
hemodynamic responses (HSTIM) are reliably and linearly predicted by
stimulus-evoked local spiking (SSTIM). (a,b) SSTIM (a) and HSTIM (b) (shaded
regions indicate integration windows for calculating mean response
f.
Time (sec)
0 5 10 15 20
0
-1
HRF
STI M normalized
0
1 Cross-validationAll S T Y
R2 Mean R2
d.
0.0 1.0 0.01.0 Mean R
2 Modified Linear Model (MLM) N ul l m od el
e.
Mean R2per contrast MLM 0.0 1.0 0.0 1.0 <0 N ul l m od el
a.
Blank 6.25 12.50 25.00 50.00 100.000 2 4 6 8 10
S pi ke R at e (H z) Time (sec) -100 0 100 200 300
Spikes SSTIM, all correct trials
0 2 4 6 8 10
Time (sec)
b.
0.03 -0.04 -0.03 0 0.02 -0.02 -0.01 0.01 dR /RHemo H , all correct trials
STIM
c.
0 2 4 6 8 10
Time (sec) 0.94 0.94 0.87 0.96 0.95 R2 0 0 15
R2 =
0.99
HRFSTI M
strength; see Figure 2.3). Data are presented as in Figure 2.1 with error bars indicating s.e.m. The trial structure is indicated by the color bars (gray,
fixate; red, stimulus; no bar, relax). (c) Predicted stimulus-evoked
hemodynamics ( = HRFSTIM SSTIM; Supplementary Note, equation
(8)) and corresponding R2, contrast by contrast. Dotted traces indicate
residuals (HSTIM - ). Inset, optimal HRFSTIM (mean R2 = 0.99, n = 261
trials). (d) Comparing mean R2 for the null model, that is, without blank
subtraction (y axis) against the MLM (x axis). Population average (s.e.m.) of
mean R2 = 0.93 (0.01) for MLM, 0.57 (0.05) for the null model (n = 34
sessions, 3 monkeys). (e) Data are presented as in d for R2 calculated
separately by contrast and then averaged (one data point per experiment). Fits for the null model were almost all worse than for the MLM (that is, below the diagonal) and included many negative values (shown below scatter plot;
population average R2 (s.e.m.): MLM, 0.77 (0.03); null model, 0.14 (0.10); n
= 34). See Supplementary Figure 2.10 for bootstrap estimates of confidence
intervals. (f) All HRFSTIM kernels (amplitude normalized; color coded by
animal; population average latency (s.e.m), 3.1 (0.2) s; population average
width (s.e.m.), 3.3 (0.2) s; n = 34). Inset, average mean R2 (s.e.m.) from
cross-validation tests using leave-one-out mean kernels, over all animals
(0.80 (0.03), n = 34) and separately by animal (monkey S, 0.89 (0.02), n =
17; monkey T, 0.85 (0.03), n = 15; monkey Y, 0.90 (0.01), n = 2). R2 pop
indicates experimental population average (data from d).
Comparable improvements using the MLM were seen over the population.
The MLM gave values of mean R2clustered close to 1.0, much higher than
the corresponding values obtained with the null model in essentially every
experiment (Figure 2.2d). The R2 values calculated separately by contrast
showed more scatter than the mean R2, but even here the null model gave
values that were distinctly poorer than those obtained with the MLM, including a number of negative values (Figure 2.2e). Again, confidence limits estimated using bootstrapping were used to quantify the significance of these improvements using the MLM (Supplementary Figure 2.10d,e).
The individual optimal HRFSTIM kernels were also highly consistent across
other experiments, with only a slight improvement in the prediction when conducted separately by animal (Figure 2.2f). This consistency of the HRF kernel across experiments and animals suggests that it represents a neuro-vascular coupling mechanism that is intrinsic to this cortical tissue.
The relationship between stimulus-specific hemodynamics and spiking was robustly linear even though the two signals were individually nonlinear func-tions of stimulus contrast. This can be seen by comparing the areas under the response curves (Figure 2.2a,b). Both the spiking (Figure 2.3a) and hemodynamic responses (Figure 2.3b) had similar hyperbolic (Albrecht & Hamilton 1982) relationships to contrast while being homogeneously linear when plotted against each other (Figure 2.3c). Note that, unlike in earlier reports (Logothetis et al. 2001), the linear regression line (Figure 2.3c)
passes through the origin with essentially no y intercept or threshold of
hemodynamic signal at low spike rate.
Figure 2.3 – Stimulus-evoked spiking and hemodynamics are hyperbolic
functions of stimulus contrast and are linearly related to each other. (a)
Normalized stimulus-evoked spike responses across contrasts. Each point shows data for a single contrast on a given session, averaged over the integration window as shown in Figure 2.2a. Gray lines link sets of points in individual sessions. The red line (piecewise continuous) indicates the average across sessions. The blue line represents the optimal fitted
hyperbolic response function R(C) of contrast C, of the form Albrecht &
Hamilton 1982
; fitted parameters are shown above.
(b) Data are presented as in a for stimulus-evoked hemodynamic
a.
Contrast %
0 50 100
N or m . S pi ke R esp . 1 0.8 0.6 0.4 0.2 0
b.
N or m . H em o. R es p.y = 0.88*x - 0.03 (exp)
N or m . H em o. R esp .
Norm. Spike Resp.0.2 0.4 0.6 0.8 1
0
y = 0.94*x + 0.02 (avg)
c.
Contrast %
0 50 100
1 0.8 0.6 0.4 0.2 0 1 0.8 0.6 0.4 0.2 0 R R 2
2 = 0.94
=0.94(avg) C = 16.88; n = 1.08
RMAX50 = 1.09 ( = 0.99)R2
C = 18.25; n = 0.96
responses, averaged over the window as in Figure 2.2b. (c) The spiking and
hemodynamic responses shown in a and b, plotted against each other. The gray lines are regression lines for each session and the red line is the
average of the regression lines. Expressions show regression and R2, both
for the experiments in Figure 2.1 and Figure 2.2a–c (exp) and the population
(avg). Population averages were calculated from session values, weighted
by number of trials within a session (n = 34 sessions, 3 monkeys).
2.4.3 Trial-related signal consistent in stimulus and dark room
With the stimulus-evoked portion of the signal well characterized by our MLM model, we next estimated the posited spike- and stimulus-independent
trial-related signal T (Figure 2.4and Supplementary Note, equation (2,9)).
According to the MLM, this is the signal that remains after subtracting away,
from the full measured hemodynamics H, all components that can be
pre-dicted from spikes. To estimate spike-prepre-dicted components, we used our
simplifying assumption that the HRFSTIM kernel can be applied uniformly to
all spiking, whether stimulus evoked or uncontrolled (blank trial). The
HRFSTIM was obtained, as before (Supplementary Note, equation (7)), by
fitting stimulus-evoked spiking (SSTIM; Figure 2.4a) to hemodynamics (HSTIM;
Figure 2.4b). The hemodynamics predicted from full spiking S using this
kernel (Figure 2.4c) were clearly different from the full measured hemody-namics (Figure 2.4b). Qualitatively, however, the latter appear to be a sum of the prediction riding on top of a large contrast-independent response. Indeed, subtracting the predicted from the measured hemodynamics left
large remaining signals T that matched each other closely across contrasts.
Note, moreover, their substantial strength, which was 1.5-fold greater than
that of the maximal HSTIM (compare Figure 2.4b with Figure 2.4d). It is
important to emphasize that, in our framework, these unpredicted hemody-namic signals are not the results of nonspecific spiking (for example,
SBLANK); they comprise the components that, according to the MLM, remain
hemodynamics, both stimulus evoked and nonspecific (Supplementary Note, equation (9)).
Figure 2.4 – Estimated trial-related signal T is consistent across contrasts,
across experiments, and between stimulated and dark-room trials. (a,b)
Spiking (a) and hemodynamics (b) from another representative session.
Insets, corresponding SSTIM and HSTIM. The trial structure is indicated by the
a.
b.
S pi ke R at e (H z) 0 200 400 600 0.02 -0.03 -0.02 -0.01 0.01 dR /R 0 0.02 -0.03 -0.02 -0.01 0.01 dR /R 0 0.02 -0.02 -0.01 0.01 dR /R 0 0.02 -0.03 -0.02 -0.01 0.01 dR /R 0 Time (sec)0 5 10 15
Blank 3.125 6.25 12.5 25 50 100 -1 0 0 15
R2 =
HRFST IM
f.
c.
d.
e.
S pi ke 0 200T: Stimulus T: Dark
0.02 -0.03 -0.02 -0.01 0.01 dR /R 0 Time (sec)
0 5 10 15
g.
-1 -0.5 0 0.5 1 3
6
0
T: Stimulus T: Dark
h.
600 0 0 15 Corr. r 0 -0.02 0 15 Population: Median Corr. r0 0.25 0.5 0.75 1 0 15 30 0.02 -0.03 -0.02 -0.01 0.01 dR /R 0 0.90 Measured: mean Pred from spikes
Spikes SDARK
Trial-related signals : T
Hemo: H
Spikes: SSTIM
trial sequence: grey: 'fixate'
Stimulated trials
Dark-room and comparison with stimulated trials Spikes: S
Hemo: HS TIM
Hemo HDA RK
Measured: individual
Preds HRF X STIM S
Pairwise correlation
T: Dark vs. Stimulus
Population
T: Dark vs. Stimulus:
T: Dark vs. Stimulus
Corr. r= 0.94