Spatial and temporal population genetic variation and structure
of
Nothotsuga longibracteata
(Pinaceae), a relic conifer species endemic
to subtropical China
Yingjun Qiu
1,3, Yifei Liu
2, Ming Kang
2, Guanmei Yi
3and Hongwen Huang
2 1Wuhan Botanical Garden/Wuhan Institute of Botany, Chinese Academy of Sciences, Wuhan, Hubei, China.
2South China Botanical Garden/South China Institute of Botany, Chinese Academy of Sciences, Guangzhou,
Guangdong, China.
3
Ningbo City College of Vocational Technology, Ningbo, Zhejiang, China.
Abstract
Nothotsuga longibracteata, a relic and endangered conifer species endemic to subtropical China, was studied for ex-amining the spatial-temporal population genetic variation and structure to understand the historical biogeographical processes underlying the present geographical distribution. Ten populations were sampled over the entire natural range of the species for spatial analysis, while three key populations with large population sizes and varied age struc-ture were selected for temporal analyses using both nuclear microsatellites (nSSR) and chloroplast microsatellites (cpSSR). A recent bottleneck was detected in the natural populations ofN. longibracteata. The spatial genetic analy-sis showed significant population genetic differentiation across its total geographical range. Notwithstanding, the temporal genetic analysis revealed that the level of genetic diversity between different age class subpopulations re-mained constant over time. Eleven refugia of the Last Glacial Maximum were identified, which deserve particular at-tention for conservation management.
Keywords: gene flow, glacial refugia,Nothotsuga longibracteata, spatial genetic structure, temporal genetic structure.
Received: March 23, 2013; Accepted: August 20, 2013.
Introduction
Genetic structure of a plant natural populations is mainly influenced by the species breeding system, gene flow, genetic drift and natural selection (Epperson, 1993; Austerlitzet al., 2000). Furthermore, climatic and/or geo-logical changes can also result in shifts in the genetic com-position of a population through creating spatial and/or temporal heterogeneity in the environments (Jump and Pe-nuelas, 2005). Although spatial genetic structure has been investigated in many plant groups at different geographical scales (Erickson and Hamrick, 2003; Genget al., 2009; Soldatiet al., 2013), most previous studies did not distin-guish among age classes in a population, and the temporal dynamics of gene flow and selection are not well under-stood, possibly due to divergence among groups of individ-uals of different ages in their responses to ecological and evolutionary factors (Erickson and Hamrick, 2003; Soldati et al., 2013). Obviously, the patterns of population genetic structure of adult plants reflect the accumulation of the
ef-fects of ecological and evolutionary processes acting in the past and present, while the genetic structure of juvenile plants represents the processes of a few recent years (Kalisz et al., 2001; Chunget al., 2003; Ozbeket al., 2007). Dis-secting both the spatial and temporal genetic structure of a population therefore permits a better understanding of the evolutionary dynamics and biogeographic history in space and time.
Severe climatic oscillations associated with glacial cycles during the late Tertiary and throughout the Quater-nary resulted in profound changes in species distribution and population structure (Hewitt, 2000; Petitet al., 2003; Wang and Ge, 2006). Subtropical mainland China, where no ice sheets were formed during the climatic oscillations, had served as an important refugium for lineages that evol-ved prior to the late Tertiary and Quaternary glaciations (Gaoet al., 2007). In particular, mountain regions such as the Nanling Mountains and the adjacent Wuyi and Daiyun mountains have been proposed as major centers of the great floristic diversity in subtropical China, and an active center for speciation and evolution (Ying, 2001; Wang et al., 2009). The complex physiogeographic and climatic fea-tures in these mountain regions have allowed the survival of many relict species. The current geographical distribu-www.sbg.org.br
Send correspondence to Hongwen Huang. South China Botanical Garden/South China Institute of Botany, Chinese Academy of Sci-ences, 510650 Guangzhou, Guangdong, China. E-mail: [email protected].
tion and population genetic structure of these relict species represent the results of the long-term impacts of climatic and geological events together with the long or short-term effects of demographical processes related to anthropo-genic disturbances. Thus, detailed assessment of the popu-lation genetic structure of these relict species in space and time is crucial to a comprehensive understanding of the ge-netic and biogeographical patterns of species endemic in the mountain regions of subtropical China.
Nothotsuga longibracteata(W. C. Cheng) Hu ex C. N. Page is a relict tree species belonging to the genus Nothotsuga in the family Pinaceae. Although it has first been placed in the genusTsuga, the species is notably dis-tinguished fromTsugaby its radially spreading leaves with stomatal lines on both upper and lower surfaces and the up-right seed cones. Most natural populations of this species are currently centered in several highly fragmented and iso-lated mountain areas of south China, including the Nanling mountains locating in the cross-border region of the Guangdong, Jiangxi, Hunan, Guangxi and Guizhou prov-inces and the Daiyun mountains in the Fujian province. Notwithstanding, fossil records ofN. longibracteatafound in Russia, Germany and Japan suggest a wide geographical distribution of this species during the Pliocene and Mio-cene (Karavaev, 1958; Miki, 1954). The climatic and envi-ronmental changes during the Quaternary glaciations and the increasing anthropogenic disturbance and habitat frag-mentation during the past 100 years may have severely de-creased the natural populations of N. longibracteata. A recent investigation of the demographic composition of several undisturbed populations in the Fujian and Guangdong provinces showed that the age spectrum of this species is large, ranging from one year old seedlings to > 500 years old trees. Thus,N. longibracteataprovides
an opportunity to investigate both the spatial and temporal genetic structure of populations in response to climatic and geological changes in the past together with recent anthro-pogenic disturbance and local habitat fragmentation.
In the present study, we used biparentally inherited nuclear microsatellites (nSSRs) and paternally inherited chloroplast microsatellites (cpSSRs) to screen the genetic variation in natural populations ofN. longibracteata. Ten populations were sampled across their entire natural range for spatial genetic structure analyses, and three key popula-tions with large population sizes and age classes were se-lected for temporal genetic analyses. We were particularly interested in the following questions: (1) the degree of spa-tial genetic differentiation among the populations of N. longibracteatathroughout the entire natural distribution in China; (2) whether there is a significant difference in gene diversity between different age class subpopulations; and (3) the possible location ofN. longibracteataduring the Last Glacial Maximum.
Materials and Methods
Sample collections
We conducted an exhaustive field survey for the en-tire natural range ofN. longibracteata in 2005. The geo-graphic distribution ofN. longibracteata is scattered and fragmental (Qiuet al., 2011), and only 10 natural popula-tions are relatively large (with more than 30 individuals). A total of 631 individuals were sampled from these 10 popu-lations across their entire geographical distribution (Figu-re 1). The geographical distances between populations varied from 1.3 km to 700 km. About 30 individuals per populations were collected depending on the accessibility of samples and the original population size (Table 1).
Moreover, three populations, FJM (149 individuals), FJT (160 individuals) and HNZ (106 individuals), with large population sizes and broad age classes were exhaustively sampled for temporal genetic structure analyses by group-ing individuals of different age class into subpopulations (Table 2). The age of individuals in the three large popula-tions was determined using the methods described by Wuet al. (2000). Needle leaves from each sampled individual were collected and immediately buried in silica gel until DNA extraction.
DNA extraction and microsatellite analysis
Genomic DNA was extracted from needle leaf tissue using the CTAB method (Doyle and Doyle, 1987). DNA quality and quantity were determined by electrophoresis in
1% agarose gels with lDNA markers. Microsatellite genotyping of the nuclear genome of N. longibracteata was performed according to the methods described by Qiuet al. (2007) using the loci NT01, NT02, NT03, NT04, NT06 and NT07. In addition, three cpDNA microsatellite primer pairs (Pt15169, Pt63718, Pt71936) derived from Pinus thunbergii(Vendraminet al., 1996) were used due to their high genetic polymorphism found in a preliminary screen for genetic variation of cpDNA in N. longibracteata. Poly-merase chain reaction (PCR) assays were done in a volume of 10mL, containing 10 mM Tris-HCl (pH 8.4), 50 mM (NH4)2SO4, 1.5 mM MgCl2, 0.2 mM dNTPs, 0.2mM of
each primer, 50 ng of genomic DNA, and 1 unitTaq poly-merase (Fermentas, Lithuania) for both nSSR and cpSSR. The amplification protocol was essentially similar to that Table 1- Genetic diversity within populations inNothotsuga longibracteata.
Region (abbr.) Population N A AR HO HE FIS NP
Daiyun mountain(DY) FJM 32 11.3 10.6 0.748 0.849 0.109 9
Daiyun mountain(DY) FJT 32 10.3 9.8 0.708 0.845 0.153*** 4
Nanling mountain(NL) HNZ 32 9.8 9.1 0.807 0.797 -0.029 10
Nanling mountain(NL) HNG 32 8.5 8.1 0.743 0.770 0.036 4
Nanling mountain(NL) GDL 31 10.7 10.2 0.767 0.851 0.084 9
Jiangxi province(JXS) JXS 32 5.0 5.0 0.846 0.761 -0.119 0
Hunan province(HNQ) HNQ 32 2.0 2.0 0.451 0.413 -0.105 1
Hunan province(HNH) HNH 26 1.7 1.7 0.310 0.291 -0.022 1
Fanjing mountain(GZF) GZF 31 9.2 8.8 0.545 0.760 0.274*** 11
Maoer mountain(GXM) GXM 32 8.3 7.9 0.697 0.710 0.018 8
Average 31 7.6 7.3 0.658 0.704 5.7
N, number of individuals sampled for each population;A, average number of alleles per locus;AR, allele richness;HO, observed heterozygosity;HE,
ex-pected heterozygosity;FIS, within-population coefficient of inbreeding;NP, number of private alleles. Levels of significance forFISof each population
were determined after 1000 permutations: ***, p < 0.001.
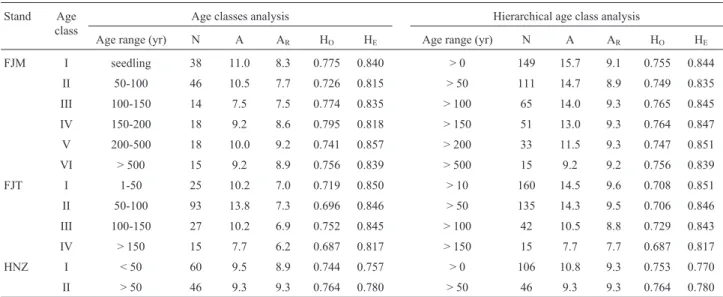
Table 2- Summary of genetic diversity measures for each age classes ofNothotsuga longibracteataat FJM, FJT and HNZ populations.
Stand Age class
Age classes analysis Hierarchical age class analysis
Age range (yr) N A AR HO HE Age range (yr) N A AR HO HE
FJM I seedling 38 11.0 8.3 0.775 0.840 > 0 149 15.7 9.1 0.755 0.844
II 50-100 46 10.5 7.7 0.726 0.815 > 50 111 14.7 8.9 0.749 0.835 III 100-150 14 7.5 7.5 0.774 0.835 > 100 65 14.0 9.3 0.765 0.845 IV 150-200 18 9.2 8.6 0.795 0.818 > 150 51 13.0 9.3 0.764 0.847
V 200-500 18 10.0 9.2 0.741 0.857 > 200 33 11.5 9.3 0.747 0.851 VI > 500 15 9.2 8.9 0.756 0.839 > 500 15 9.2 9.2 0.756 0.839
FJT I 1-50 25 10.2 7.0 0.719 0.850 > 10 160 14.5 9.6 0.708 0.851 II 50-100 93 13.8 7.3 0.696 0.846 > 50 135 14.3 9.5 0.706 0.846 III 100-150 27 10.2 6.9 0.752 0.845 > 100 42 10.5 8.8 0.729 0.843
IV > 150 15 7.7 6.2 0.687 0.817 > 150 15 7.7 7.7 0.687 0.817 HNZ I < 50 60 9.5 8.9 0.744 0.757 > 0 106 10.8 9.3 0.753 0.770
II > 50 46 9.3 9.3 0.764 0.780 > 50 46 9.3 9.3 0.764 0.780
described by Qiuet al.(2007) for SSR and by Vendraminet al.(1996) for cpSSR. The amplified products were sepa-rated in a 6% denaturing polyacrylamide gel and revealed using silver staining. A 25 bp DNA ladder (Promega, Madi-son, WI, USA) was used to estimate allele size.
Data analysis
Population genetic variation
For nuclear genomic SSR markers, a set of standard measures of population genetic diversity were calculated for all sampled populations using the program Microsatellite Analyzer (MSA) 4.05 (Dieringer and Schlotterer, 2003), in-cluding the mean number of alleles per locus (A), allele rich-ness (AR) standardized to the smallest sample size, observed
(HO) and expected heterozygosity (HE) for each locus and
population, and inbreeding coefficient (FIS) for each
popula-tion. The population genetic differentiation for each locus across all populations was estimated by Wright’sF-statistics (FST) according to Weir and Cockerham (1984) using the
program GenALEx6 (Peakall and Smouse, 2006). Departure from Hardy-Weinberg expectations and linkage disequilibria between microsatellites were tested by Fisher’s exact tests implemented in GENEPOP, version 3.4 (Ray-mond and Rousset, 1995). Sequential Bonferroni adjust-ments were used to determine the significance levels of all statistics, with an initial±level of 0.05.
In the three populations (FJM, FJT and HNZ) with large population size, each age class was considered as an individual temporal subpopulation and the genetic diversity measures (AR, HOand HE) were calculated separately for
each subpopulation. Furthermore, the temporal subpopu-lations were redefined based on the cumulative gene pools of the different age classes (Table 2), and a hierarchical analysis was used to test the difference of genetic diversity (AR, HO and HE) between subpopulations under the
as-sumption of random mating. Differences in the genetic di-versity parameters among different age class subpopu-lations and among hierarchical age-class subpopusubpopu-lations were analyzed by ANOVA, respectively. FST values
be-tween each age class subpopulation and among hierarchical age-class subpopulations (as show in Table 2) were also ex-amined to give a picture of how genetic structure changed over time.
cpDNA haplotypes were identified based on cpSSR variation. Length variants at each cpSSR locus were com-bined into one haplotype because of the non-recombinant nature of the chloroplast genome. The program ARLEQUIN (Excoffieret al., 2005) was used to calculate haplotype diversity (H) (Nei, 1987) and the number of pri-vate haplotypes for each population and group (groups de-fined in the analysis of population genetic structure-see below). The global haplotype differentiation valueGSTwas
calculated using the program PERMUT (Pons and Petit, 1996; Burbanet al., 1999).
Migration-drift equilibrium analyses
The relative likelihood of a migration-drift equilib-rium (gene flow modelvs. drift model) between popula-tions in different geographical localities was investigated using the program 2MOD based on nuclear SSR data sets (Ciofiet al., 1999). 2MOD is based on the comparison of likelihoods for the two models, given the observed micro-satellite frequency counts using coalescent theory and Markov Chain Monte Carlo simulation. The gene flow model assumes that gene frequencies within populations are determined by a balance between genetic drift and im-migration, while the drift model assumes that an ancestral panmictic population became separated into several inde-pendent units which then started to diverge purely by ge-netic drift. A simulation with 500 000 iterations was carried out, and the first 10% of the output was discarded in order to avoid a bias resulting from the starting values.
Population genetic structure
The program STRUCTURE version 2.1 (Pritchardet al., 2000) was used to infer the potential number of source population for all individuals sampled based on the nSSR data set. We examined the probabilities for a range ofK val-ues starting from 1 to 17. A burn-in of 106and a Markov chain Monte Carlo run length of 500,000 iterations were used for each run of aKvalue to reach an approximate sta-bilization of the summary statistics based on the admixture ancestry model with correlated allele frequencies. Runs for each K value were independently replicated 20 times (Gilbertet al., 2012). The outputs of LnP(D) were then standardized using the method described by Evannoet al. (2005). An admixture analysis was next carried out for the K-inferred populations regardless of sampling populations in different locality.
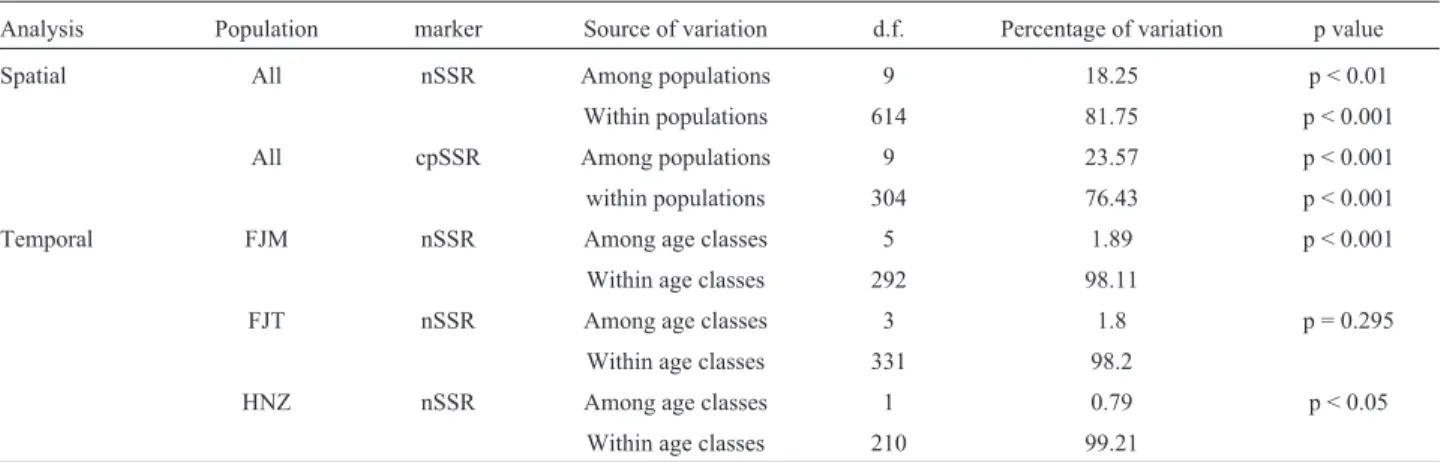
Analysis of molecular variation (AMOVA) was used to determine the partitioning of molecular variance be-tween and within populations for both the nSSR and cpSSR data sets using the program ARLEQUIN 3.11. Further-more, population pairwise comparisons ofFSTwere
con-ducted using a genetic distance approach based on nSSR data under the infinite alleles model (IAM). This model as-sumes that genetic drift is the main driving force underlying population divergence (Weir and Cockerham, 1984; Michalakis and Excoffier, 1996). Significance of the vari-ance components was tested with 10,000 permutations.
Results
Informative genetic markers and population genetic diversity
A total of 143 alleles from six nuclear microsatellite loci were found and the mean number of alleles per locus was 23.8, ranging from 6 (locus NT01) to 38 (loci NT03 and NT06). Moreover, mean gene diversity per locus (HE) varied
av-erage value of 0.605 (data not shown). The general genetic diversity measures of each population are summarized in Ta-ble 1. Intra-population microsatellite variation revealed the mean number of alleles per locusA= 7.6 (range from 1.7 to 11.3), allelic richnessAR=7.3 (range from 1.7 to 10.6),HO=
0.658 (range from 0.310 to 0.846), andHE= 0.704 (range
from 0.291 to 0.851). High genetic diversity together with a high number of private alleles (rare alleles found only in one or two samples) were found in four populations of DY, NL, GZ F and GXM (Table 1). The level of inbreeding for each population also varied from -0.119 to 0.274 (Table 1). Sig-nificant inbreeding coefficients (FIS) were detected in two
populations, FJT and GZF, and they were under Hardy-Weinberg disequilibrium (p < 0.05) across all loci an-alyzed. A significant linkage disequilibrium (p < 0.05) be-tween SSR loci within each population was detected for 20 out of 150 comparisons. Since multiple tests were involved, a sequential Bonferroni correction was conducted by divid-ing the significance level by the number of items tested. As a result, none of these linkage disequilibria were significant af-ter Bonferroni correction.
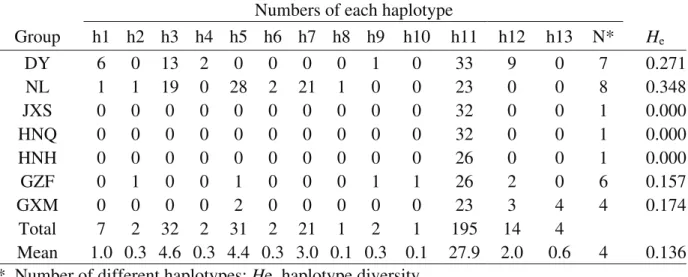
For chloroplast SSR markers, a total of 11 alleles were identified from the three cpDNA microsatellites, and genetic diversity across cpSSR loci varied greatly among groups (Table S1). The highest haplotype diversityHewas
found in the NL group (0.348), followed by the DY (0.271), GXM (0.174) and GZF (0.157) groups, with a meanHeof
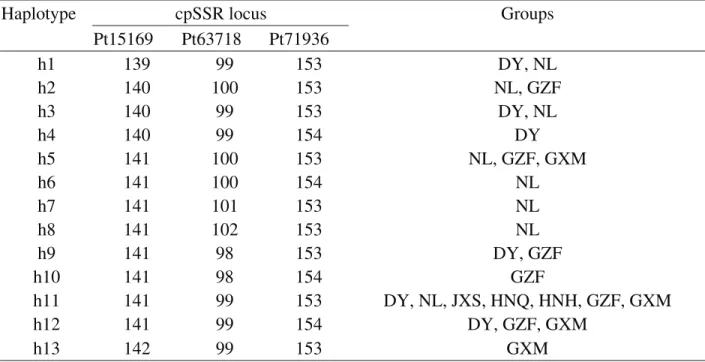
0.136 (Table S1). Thirteen different haplotypes were de-fined based on the combination of the 11 alleles from the three loci (Table S2). Haplotype frequencies varied from 0.3% (one individual for h13) to 62.1% (195 individuals for h11), with an average of 7.7%. The NL group had the high-est number of haplotypes (8), followed by the DY (6), GZF (6) and GXM (4) groups. Interestingly, one haplotype (h11) occurred in every group (Figure 1). Moreover, three haplo-types (h6, h7and h8) uniquely occurred in the NL group, and three (h4, h10 and h13) were in the DY, GZF and GXM regions, respectively (Figure 1, Table S1).
Migration-drift equilibrium
The result of likelihood tests for the gene flowvs.drift models in the 2MOD analysis was strongly in favor of the gene drift mode (p (gene drift) = 1, Bayes factor =¥), sug-gesting that the extant populations ofN.longibracteataare
genetically isolated across a large-scale spatial region and that there is only a small amount of migration between pop-ulations.
Population spatial genetic variation and structure
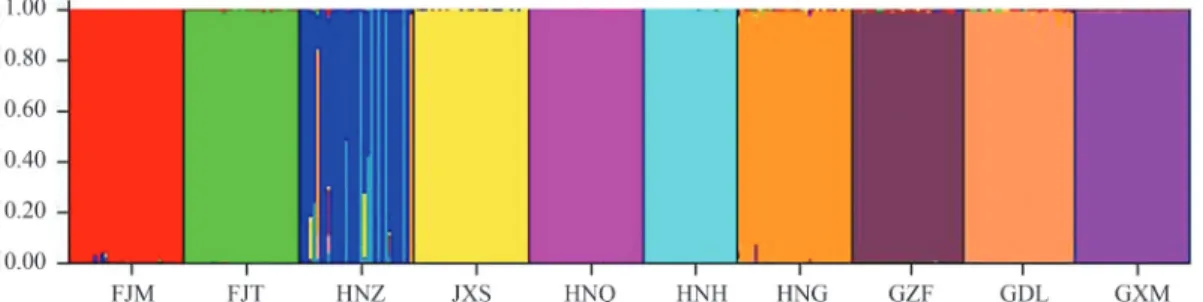
The assignment analysis implemented in the STRUCTURE program indicated that there are 11 frag-mented populations in our sampling scheme (Figure 2), suggesting that there could be as many as 11 locations of populations during the Last Glacial Maximum. All pairwise comparisons of populations genetic differentia-tion (FST) were significant (p < 0.001). Moreover, of the
to-tal genetic variation partitioned in the AMOVA analysis based on the nSSR data set, the largest variance component (81.39%) was found among individuals within populations, while 11.52% and 7.1% variance were found between gions and among populations within the same region, re-spectively (Table 3), suggesting that the populations shared similar gene pools (common ancestry) until very recently. Similar results were also obtained from the cpSSR data, in which the genetic variation within populations, between re-gions, and among populations within region were 71.75%, 17.96% and 10.29%, respectively (Table 3).
In the entire geographical range ofN.longibracteata sampled, no cpSSR genetic variation was found in the three populations JXS, HNQ and HNH (each population was fixed with a single haplotype) (Table S1). The global haplo-type differentiation value ofGSTwas 0.275. In the seven
de-fined different geographical groups, the NL group showed the highest level of cpSSR diversity (with 8 haplotypes). Among the eight haplotypes in the NL group, h1 and h3 were shared with group DY in the east and h5 was shared with groups GXM and GZF in the west, while h2 was shared with group GZF (Figure 1).
Genetic diversity and differentiation of age-class subpopulations over time
Based on the ANOVA analysis result, the levels of nSSR genetic diversity (HE, HO or AR) were not
signifi-cantly different (p = 0.372-0.972, data not shown) between the age-class subpopulations in the three large populations FJM, FJT and HNZ (Table 2). Furthermore, hierarchical age-class analysis also showed no significant differences in genetic diversity (p = 0.724 - 1.000, data not shown) for the
cumulative gene pools of age-class subpopulations (Table 2).
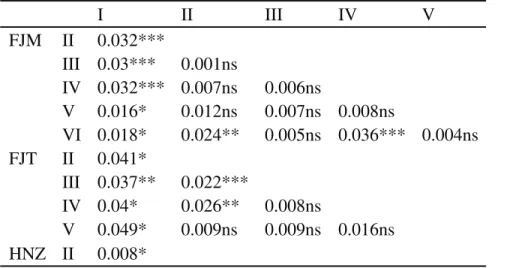
Differentiation of FST between hierarchical
age-classes was not significant among all the three populations (FJM, FJT and HNZ, data not shown). The AMOVA analy-sis showed that > 98% of the total variation occurred within the age class subpopulations (Table 3). This result was fur-ther confirmed when computing pairwiseFSTbetween age
classes. In these subpopulations with juveniles (FJM, FJT and HNZ) and the ones with old trees (FJM and HNZ) were significant different in genetic differentiation (Table S3).
Discussion
Genetic diversity inN. longibracteata
Compared with the genetic diversity previously re-ported in other conifer species investigated by means of nu-clear microsatellites markers, a slightly higher level of expected heterozygosity (HE= 0.291-0.851, mean = 0.704)
was detected in N. longibracteata compared to Pinus strobus(Marquardt and Epperson, 2004),Picea abies (Me-loniet al., 2007),Taxus wallichianavar. mairei(Zhang and Zhou, 2013), Araucaria cunninghamii, Wollemia nobilis andAgathis robusta(Peakallet al., 2003). But it was lower than inP.abies(Achereet al., 2005),Tsuga mertensiana (Ally and Ritland, 2007) andP. pinaster (Marietteet al., 2001). Notwithstanding, the allelic richness of this species (AR= 1.7-11.3, mean = 7.3) was much lower than in the
other conifer species, including P.strobus(Marquardt and Epperson, 2004),P.abiesKarst. (Meloniet al., 2007),P. abies(Achereet al., 2005) andP. pinaster(Marietteet al., 2001), except for A.cunninghamii(Peakall et al., 2003). Both theoretical and empirical evidence indicate thatARis
more sensitive than HEto reflect the effects of short but
se-vere genetic bottlenecks, and that it can more accurately represent current levels of genetic diversity within a frag-mented population (Leberg, 2002). Accordingly, the rela-tively low value of AR but high HE suggest that recent
bottlenecks have once occurred in the natural populations ofN.longibracteata, probably caused by the great decline in the number of populations and population size, as evi-denced by the fossil records (Wang, 2000). Fossil evidence indicates thatN.longibracteatawas widespread in Russia and Japan during the Pliocene (Karavaev, 1958; Miki, 1954) and Germany in the Miocene (Kunzmann and Mai, 2005), although its current geographical distribution is re-stricted to a few highly fragmented forest areas in subtropi-cal China.
Chloroplast markers are good indicators of genetic bottlenecks due to their smaller (half) effective population size that is more sensitive to genetic drift and loss of alleles than the nuclear markers (Provan et al., 2001; Zhao and Gong, 2012; Leighet al., 2013). In our study, the genetic diversity of cpDNA detected inN.longibracteata popula-tions was lower (meanHE= 0.136) than in other conifer
species (H E = 0.37, based on the average estimates of
cpDNA genetic diversity measured from cpDNA micro-satellite markers in eight coniferous species, Petit et al., 2005a), suggesting a possibly historical bottleneck in the species. Loss of chloroplast variation due to historical bot-tlenecks was also reported in other conifers (Provanet al., 1999; Walter and Epperson, 2001; Vendraminet al., 2008) and it is most likely the case for N.longibracteata.
Population genetic structure
Spatial
Conifer species generally display low population ge-netic differentiation due to the widespread occurrence of wind pollination and outcrossing (Hamrick et al., 1992; Hamrick, 2004; Parchman et al., 2011). For example, a meanGSTvalue of 0.165 has been reported for 37 conifer
species based on paternally inherited markers, and one of 0.116 for 33 conifer species based on biparentally inherited markers (Petitet al., 2005b). In the present study, a slightly higher level of the population genetic differentiation (GST
value of 0.275 for cpSSR and 0.193 for nSSR) was found in Table 3- Results from analysis of molecular variance (AMOVA) from nSSR and cpSSR markers forNothotsuga longibracteatapopulations.
Analysis Population marker Source of variation d.f. Percentage of variation p value
Spatial All nSSR Among populations 9 18.25 p < 0.01
Within populations 614 81.75 p < 0.001
All cpSSR Among populations 9 23.57 p < 0.001
within populations 304 76.43 p < 0.001
Temporal FJM nSSR Among age classes 5 1.89 p < 0.001
Within age classes 292 98.11
FJT nSSR Among age classes 3 1.8 p = 0.295
Within age classes 331 98.2
HNZ nSSR Among age classes 1 0.79 p < 0.05
Within age classes 210 99.21
N.longibracteata than those previously reported in other conifer species. Moreover, our AMOVA analysis indicated that a significant amount of genetic diversity was attributed to variation among populations (18.61% and 28.25% of the global genetic diversity between populations for nSSR and cpSSR, respectively, Table 3). Similar patterns of genetic structure have also been documented in Cathaya argyrophylla, an endangerd conifer species in subtropical China (22% of the total diversity at nuclear loci is attributed to variation among populations, Wang and Ge, 2006). This value is significantly higher than the average (GST= 0.116)
summarized by Petit et al. (2005b). The seeds of N. longibracteataare winged, and both pollen and seeds are wind-dispersed, suggesting a possibly high level of pollen and/or seed flow within and between populations. Thus, in-stead of the limitations of recent gene flow, the observed population genetic differentiation is more probably a result of the long-term evolutionary divergence of the popula-tions in response to local environmental condipopula-tions and/or geological and climatic changes in the recent past. Further-more, considering the low evolutionary rate of chloroplast DNA, the relatively high level of cpSSR genetic differenti-ation found between populdifferenti-ations and regions agrees with the scenario of ancient genetic isolation. Fragmentation of populations, together with complex topographic features of mountains in the region, might constitute significant barri-ers to historical gene flow, and in turn might have promoted deep divergence of geographically isolated populations of N. longibracteata.
Temporal
Populations of long-lived organisms, composed of cohorts established at different times and occupying rela-tively large geographical areas, can be genetically differen-tiated both spatially and temporally (Linhartet al., 1981). In our study, however, no significant difference was found among the estimates of genetic diversity between age classes in the three large populations FJM, FJT and HNZ (Table 2). Furthermore, the hierarchical age class analysis showed that the gene pools of the different age-class subpo-pulations did not change over time (Table 2). This was dif-ferent from certain previous studies. For example, Ortego et al.(2010) found that fragmentation contributed to reduce genetic variability and increase genetic differentiation in Quercus ilexsaplings, indicating that the younger cohorts are suffering some negative genetic consequences of long-term population fragmentation. It was also found that vated inbreeding occurs within seedling cohorts and ele-vated divergence occurs initially between seedling cohorts and older individuals, but that these differences decline in older cohorts due to selecting out of inbred individuals (Kitamuraet al., 1997; Chung et al., 2003; Kelly et al., 2004). When spatial genetic structures of species are pro-foundly shaped by global climate oscillations in a long time scale (Hewitt, 2000; Godboutet al., 2005; Espíndolaet al.,
2012), the temporal genetic variation generally occurred in a short time period due to local changes of land-use or natu-ral fluctuations in the abundance and distribution of species (Parmesan and Yohe, 2003). Obviously, conifers combine various life history traits that promote constant genetic di-versity under local changes, including large populations with wide geographical distribution, long-lived perennials, sexual reproduction, high fecundity, outcrossing, and rela-tively long distance pollen and seed movement (Hamricket al., 1992; Ledig, 1998; Parchmanet al., 2011). The lack of a temporal pattern indicates thatN. longibracteata main-tained a constant level of genetic diversity and structure over time, implying no disastrous environmental changes that selectively removed plants of certain genotypes in a short term.
Notwithstanding, we did found weak but signifi-cantly genetic differentiation among the young and most of the old cohorts of temporal groups in two of the three popu-lations (FST of 1.9% for FJM, p = 0.000, and of 0.8% for HNZ, p = 0.028) (Tables 3 and S1). Assuming neutrality of microsatellite markers, the temporal changes in genetic composition ofN. longibracteatacould result from various forms of nonrandom mating, such as differences in repro-ductive success of a plant over time, or a sampling effect, or differences in relative recruitment of immigrantvs.resident individuals (Oddou-Muratorioet al., 2004). In particular, the significant genetic differentiation in the old cohorts could be the result of extinction of their parental plants in the populations (Kitamuraet al., 1997), which led to the loss of alleles in the older hierarchical groups. The differ-ences seen in young cohorts could be a result of a natural thinning process.
It is worthy of note that unlike the old growth popula-tions FJM and FJT, which have not been disturbed, heavy logging occurred in the Nanling Mountain area (NL) where thousands ofN. longibracteatatrees were harvested during the period from 1960 to 1980. Nonetheless, the genetic di-versity of the population HNZ in this area did not change over time (Table 2). This could be due to a high gene flow in this population, as suggested by STRUCTURE analysis (Figure 2). Furthermore, historical bottlenecks may have a long-term effect on genetic variation, to such an extent that even a recent population decline may leave no genetic sig-nature (Taylor and Jamieson, 2008).
Potential refugia and conservation implications
or disappearance of some important species (Lu et al., 2001; Shenet al., 2005). The mountain regions including the Nanling and the adjacent Wuyi and Daiyun mountains in southern China have served as the main refugia regions for plant surviving and evolving during climatic oscilla-tions (Ying, 2001; Wang and Ge, 2006). For example, dur-ing glacial expansion many previously dominant conifers in the northern part of East Asia were forced to migrate southwards into scattered refugia existing in small patches across mountain regions of southern China (Lu et al., 2001). Ying (2001) localized three regions (the Hengduan range, the Central China and the Lingnan region) with high levels of plant diversity and endemism in China. As forN. longibracteata, the eleven possible Quaternary refugia sug-gested by our analysis are located in central China and the Lingnan region. Multiple refugia were also documented in other conifer and tree species in subtropical China resulting from climate changes (Luet al., 2001; Shenet al., 2005; Wang and Ge, 2006; Wanget al., 2011; Zouet al., 2012). Our study thus provides further evidence of complex refugia in mountain regions of subtropical China during cli-matic oscillations.
Genetic variation is the foundation for adaptive evo-lution of a species, especially in forest trees that are under-going fundamental population changes as a result of natural or anthropogenic disturbances (Jumpet al., 2009; Doi et al., 2010; Alsoset al., 2012). Consequently, for long frag-mented populations, Hampe and Petit (2005) recommend preserving a maximum number of independent sites, as they are often important for the survival and evolution of biota. Considering thein situconservation evolutionary po-tential of plant species, all the tenN. longibracteata popula-tions deserve particular attention in genetic conservation programs for this species.
Acknowledgments
We thank Qiuyun Xiang for valuable critical com-ments and language polish on the manuscript. This study was supported by the National Natural Science Foundation of China (30760024), Ningbo Natural Science Foundation (2011A610004), KIP Pilot Project of Chinese Academy of Sciences (KSCX2-YW-N-061) and CAS/SAFEA Interna-tional Partnership Program for Creative Research Teams. We likewise acknowledge PRCSU no. B091230 of Key Laboratory of Plant Resource Conservation and Sustain-able Utilization, CAS.
References
Achere V, Favre JM, Besnard G and Jeandroz S (2005) Genomic organization of molecular differentiation in Norway spruce (Picea abies). Mol Ecol 14:3191-3201.
Ally D and Ritland K (2007) A case study: looking at the effects of fragmentation on genetic structure in different life history
stages of old-growth mountain hemlock (Tsuga
mertensiana). J Hered 98:73-78.
Alsos IG, Ehrich D, Thuiller W, Eidesen PB, Tribsch A, Schöns-wetter P, Lagaye C, Taberlet P and Brochmann C (2012) Ge-netic consequences of climate change for northern plants. Proc R Soc Lond Ser B 279:2042-2051.
Austerlitz F, Mariette S, Machon N, Gouyon pH and Godelle B (2000) Effects of colonization processes on genetic diver-sity: differences between annual plants and tree species. Ge-netics 154:1309-1321.
Burban C, Petit RJ, Carcerff E and Jactel H (1999) Rangewide variation of the maritime pine bast scale Matsucoccus feytandiduc. (Homoptera: Matsucoccidae) in relation to the genetic structure of its host. Mol Ecol 8:1593-1602. Chung MY, Epperson BK and Chung MG (2003) Genetic
struc-ture of age classes inCamellia japonica(Theaceae). Evolu-tion 57:62-73.
Ciofi C, Beaumont MA, Swingland IR and Bruford MW (1999) Genetic divergence and units for conservation in the Komo-do dragonVaranus komodoensis. Proc R Soc London Ser B 266:2269-2274.
Dieringer D and Schlotterer C (2003) MICROSATELLITE ANALYSER (MSA): a platform independent analysis tool for large microsatellite data sets. Mol Ecol Notes 3:167-169. Doi H, Takahashi M and Katano I (2010) Genetic diversity
in-creases regional variation in phenological dates in response to climate change. Global Change Biol 16:373-379. Doyle JJ and Doyle JL (1987) A rapid DNA isolation procedure
for small quantities of fresh leaf tissue. Phytochem Bull 19:11-15.
Epperson BK (1993) Recent advances in correlation analysis of spatial patterns of genetic variation. Evol Biol 27:95-155. Erickson DL and Hamrick JL (2003) Genetic and clonal diversity
forMyrica ceriferaalong a spatiotemporal island chrono-sequence. Heredity 90:25-32.
Espíndola A, Pellissier L, Maiorano L, Hordijk W, Guisan A and Alvarez N (2012) Predicting present and future intra-specific genetic structure through niche hindcasting across 24 millennia. Ecol Lett 15:649-657.
Evanno G, Regnaut S and Goudet J (2005) Detecting the number of clusters of individuals using the software STRUCTURE: a simulation study. Mol Ecol 14:2611-2620.
Excoffier L, Laval G and Schneider S (2005) ARLEQUIN ver. 3.0: an integrated software package for population genetics data analysis. Evol Bioinform Online 1:47-50.
Gao LM, Mller M, Zhang XM, Hollingsworth ML, Liu J, Mill RR, Gibby M and Li DZ (2007) High variation and strong
phylo-geographic pattern among cpDNA haplotypes in Taxus
wallichiana(Taxaceae) in China and North Vietnam. Mol Ecol 16:4684-4698.
Geng YP, Tang SQ, Tashi T, Song ZP, Zhang GR, Zeng LY, Zhao JY, Wang L, Shi J, Chen JK,et al.(2009) Fine- and land-scape-scale spatial genetic structure of cushion rockjasmine,
Androsace tapete(Primulaceae), across southern Qinghai-Tibetan Plateau. Genetica 135:419-427.
Gilbert KJ, Andrew RL, Bock DG, Franklin MT, Kane NC, Moore J-S, Moyers BT, Renaut S, Rennison, DJ, Veen T,et al. (2012) Recommendations for utilizing and reporting population genetic analyses: the reproducibility of genetic clustering using the program structure. Mol Ecol 21:4925-4930.
history of jack pine (Pinus banksiana), a broad-range North American conifer. Mol Ecol 14:3497-3512.
Hampe A and Petit RJ (2005) Conserving biodiversity under cli-mate change: the rear edge matters. Ecol Lett 8:461-467. Hamrick JL (2004) Response of forest trees to global
environmen-tal changes. Forest Ecol Manag 197:323-335.
Hamrick JL, Godt MJW and Shermann-Broyles SL (1992) Fac-tors influencing levels of genetic diversity in woody plant species. New Forest 6:95-124.
Hewitt G (2000) The genetic legacy of the Quaternary ice ages. Nature 405:907-913.
Jump AS and Penuelas J (2005) Running to stand still: adaptation and the response of plants to rapid climate change. Ecol Lett 8:1010-1020.
Jump AS, Marchant R and Penuelas J (2009) Environmental change and the option value of genetic diversity. Trends Plant Sci 14:51-58.
Kalisz S, Nason JD, Hanzawa FM and Tonsor SJ (2001) Spatial population genetic structure in Trillium grandiflorum: the roles of dispersal, mating, history and selection. Evolution 55:1560-1568.
Karavaev MN (1958)Tsuga longibracteataCheng, first found in a fossil condition on the territory of U.S.S.R. Bull Soc Nat 63:73-76.
Kelly BA, Hardy OJ and Bouvet JM (2004) Temporal and spatial genetic structure in Vitellaria paradoxa(shea tree) in an agroforestry system in southern Mali. Mol Ecol 13:1231-1240.
Kitamura K, Shimada K, Nakashima K and Kawano S (1997) De-mographic genetics of the Japanese beech,Fagus crenata, at Ogawa forest preserve, Ibaraki, central Honshu, Japan. II. Genetic substructuring smong size-classes in local popula-tions. Plant Spec Biol 12:137-155.
Kunzmann L and Mai DH (2005) Conifers of the Mastixioideae-flora from Wiesa near Kamenz (Saxony, Miocene) with spe-cial consideration of leaves. Palaeontogr Abt B 272:67-135. Leberg PL (2002) Estimating allelic richness: effects of sample
size and bottlenecks. Mol Ecol 11:2445-2449.
Ledig FT (1998) Genetic variation inpinus. In: Richardson DM (ed), Ecology and biogeography ofPinus. Cambridge Uni-versity Press, Cambridge, pp 251-280.
Leigh FJ, Mackay I, Oliveira HR, Gosman NE, Horsnell RA, Jones H, White J, Powell W and Brown TA (2013) Using di-versity of the chloroplast genome to examine evolutionary history of wheat species. Genet Resour Crop Evol 60:1831-1842.
Linhart YB, Mitton JB, Sturgeon KB and Davis ML (1981) Ge-netic variation in space and time in a population of ponder-osa pine. Heredity 46:407-426.
Lu SY, Peng CI, Cheng YP, Hong KH and Chiang TY (2001)
Chloroplast DNA phylogeography of Cunninghamia
konishii(Cupressaceae), an endemic conifer of Taiwan. Ge-nome 44:797-807.
Marquardt PE and Epperson BK (2004) Spatial and population genetic structure of microsatellites in white pine. Mol Ecol 13:3305-3315.
Mariette S, Chagne D, Lezier C, Pastuszka P, Raffin A, Plomion C and Dremer A (2001) Genetic diversity within and among
Pinus pinasterpopulations: comparison between AFLP and microsatellite markers. Heredity 86:469-479.
Meloni M, Perini D and Binelli G (2007) The distribution of ge-netic variation in Norway spruce (Picea abies Karst.) popu-lations in the western Alps. J Biogeogr 34:929-938. Michalakis Y and Excoffier L (1996) A genetic estimation of
pop-ulation subdivision using distance between alleles with spe-cial reference for microsatellite loci. Genetics 142:1061-1064.
Miki S (1954) The occurrence of the remains ofTaiwaniaand
Palaeotsuga (n. subg.) from Pliocene beds in Japan. Proc Jpn Acad A 30:976-981.
Nei M (1987) Molecular evolution genetics. Columbia University Press, New York, 512 pp.
Oddou-Muratorio S, Demesure-Musch B, Pelissier R and Gouyon pH (2004) Impacts of gene flow and logging history on the local genetic structure of a scattered tree species,
Sorbus torminalisL. Mol Ecol 13:3689-3702.
Ortego J, Bonal R and Muñoz A (2010) Genetic consequences of habitat fragmentation in long-lived tree species: the case of the Mediterranean holm oak (Quercus ilex, L.). J Hered 101:717-726.
Ozbek O, Millet E, Anikster Y, Arslan O and Feldman M (2007) Spatio-temporal genetic variation in populations of wild emmer wheat,Tritucum turgidumssp.dicoccoides, as re-vealed by AFLP analysis. Theor Appl Genet 115:19-26. Parchman TL, Benkman CW, Jenkins B and Buerkle CA (2011)
Low levels of population genetic structure inPinus contorta
(Pinaceae) across a geographic mosaic of co-evolution. Am J Bot 98:669-679.
Parmesan C and Yohe G (2003) A globally coherent fingerprint of climate change impacts across natural systems. Nature 421:37-42.
Peakall R and Smouse PE (2006) GENALEX 6: genetic analysis in Excell. Population genetic software for teaching and re-search. Mol Ecol Notes 6:288-295.
Peakall R, Ebert D, Scott LJ, Meagher PF and Offord CA (2003) Comparative genetic study confirms exceptionally low ge-netic variation in the ancient and endangered relictual coni-fer, Wollemia nobilis (Araucariaceae). Mol Ecol 12:2331-2343.
Petit RJ, Aguinagalde I, De Beaulieu JL, Bittkau C, Brewer S, Cheddadi R and Ennos R (2003) Glacial refugia: hotspots but not melting pots of genetic diversity. Science 300:1563-1565.
Petit RJ, Deguilloux MF, Chat J, Grivet D, Garnier-Gere P and Vendramin GG (2005a) Standardzing for microsatellite length in comparisons of genetic diversity. Mol Ecol 14:885-890.
Petit RJ, Duminil J, Fineschi S, Hampt A, Salvini D and Vendra-min GG (2005b) Comparative organization of chloroplast, mitochondrial and nuclear diversity in plant populations. Mol Ecol 14:689-701.
Pons Q and Petit RJ (1996) Measuring and testing genetic differ-entiation with ordered vs. unordered alleles. Genetics 144:1237-1245.
Pritchard JK, Stephens M and Donnelly P (2000) Inference of population structure using multilocus genotype data. Genet-ics 155:945-959.
Provan J, Soranzo N, Wilson NJ, Goldstein DB and Powell W (1999) A low mutation rate for chloroplast microsatellites. Genetics 153:943-947.
Qiu YJ, Kang M, Ning ZL, Zeng SH and Huang HW (2007) Isola-tion and characterizaIsola-tion of polymorphic microsatellite
markers in the endangered Nothotsuga longibracteata
(Pinaceae). Mol Ecol Notes 7:1335-1337.
Qiu YJ, Yi GM, Ning ZL and Huang HW (2011) Geographic dis-tribution, current status of resources and endangered factors of endangered plant Nothotsuga longibracteata. J Plant Resour Environ 20:53-59.
Raymond M and Rousset F (1995) Genepop, version 1.2: popula-tion genetics sofeware for exact tests and ecumenicism. J Hered 86:248-249.
Shen L, Chen XY, Zhang X, Li YY, Fu CX and Qiu YX (2005) Genetic variation ofGinkgo BilobaL. (Ginkgoaceae) based on cpDNA PCR-RFLPs: inference of glacial refugia. Hered-ity 94:396-401.
Soldati MC, Fornes L, Zonneveld MV, Thomas E and Zelener N (2013) An assessment of the genetic diversity ofCedrela balansaeC. DC. (Meliaceae) in northwestern Argentina by means of combined use of SSR and AFLP molecular mark-ers. Biochem Syst Ecol 47:45-55.
Taylor SS and Jamieson IG (2008) No evidence for loss of genetic variation following sequential translocations in extant popu-lations of a genetically depauperate species. Mol Ecol 17:545-556.
Vendramin GG, Fady B, Gonzalez-Martinez SC, Hu FS, Scotti I, Sebastiani F, Soto A and Petit RJ (2008) Genetically depau-perate but widespread: the case of an emblematic mediterra-nean pine. Evolution 62:680-688.
Vendramin GG, Lelli L, Rossi P and Morgante M (1996) A set of primers for the amplification of 20 chloroplast micro-satellites in Pinaceae. Mol Ecol 5:595-598.
Walter R and Epperson BK (2001) Geographic pattern of genetic variation inPinus resinosa: area of greatest diversity is not the origin of postglacial populations. Mol Ecol 10:103-111. Wang HS (2000) The distribution patterns and floristic analysis of
family Pinaceae of China. Bull Bot Res 20:12-19.
Wang HW and Ge S (2006) Phylogeography of the endangered
Cathaya argyrophylla (Pinaceae) inferred from sequence variation of mitochondrial and nuclear DNA. Mol Ecol 15:4109-4122.
Wang J, Abbott RJ, Peng YL, Du FK and Liu JQ (2011) Species delimitation and biogeography of two fir species (Abies) in
central China: cytoplasmic DNA variation. Heredity 107:362-370.
Wang J, Gao PX, Kang M, Andrew JL and Huang HW (2009) Refugial within refugia: the case study of a canopy tree (Eurycorymbus cavaleriei) in subtropical China. J Biogeogr 36:2156-2164.
Weir BS and Cockerham CC (1984) EstimatingF-statistics for the analysis of population structure. Evolution 6:1358-1370. Wu CZ, Hong W and Xie JS (2000) Life table analysis ofTsuga
longibracteatapopulation. Chin J Appl Ecol 11:333-336. Ying TS (2001) Species diversity and distribution pattern of seed
plants in China. Biodivers Sci 9:393-398.
Zhang DQ and Zhou N (2013) Genetic diversity and population structure of the endangered coniferTaxus wallichianavar.
mairei (Taxaceae) revealed by Simple Sequence Repeat (SSR) markers. Biochem Syst Ecol 49:107-114.
Zhao YJ and Gong X (2012) Genetic structure of the endangered
Leucomeris decora (Asteraceae) in China inferred from chloroplast and nuclear DNA markers. Conserv Genet 13:271-281.
Zou JB, Peng XL, Li L, Liu JQ, Miehe G and Opgenoorth L (2012) Molecular phylogeography and evolutionary history of Picea likiangensis in the Qinghai-Tibetan Plateau in-ferred from mitochondrial and chloroplast DNA sequence variation. J Syst Evol 50:341-350.
Supplementary Material
The following online material is available for this ar-ticle:
Table S1 - Frequency and diversities of cpSSR haplotypes withinNothotsuga longibracteatagroups.
Table S2 - Haplotypes and their distribution in popu-lations of cpSSRs.
Table S3 - Genetic differentiation (FST) between age
classes of three populations estimated using the infinite al-leles model.
This material is available as part of the online article from http://www.scielo.br/gmb.
Associate Editor: Marcelo Guerra