Population structures of Brazilian tall coconut (
Cocos nucifera
L.)
by microsatellite markers
Francisco E. Ribeiro
1, Luc Baudouin
2, Patricia Lebrun
2, Lázaro J. Chaves
3, Claudio Brondani
4,
Maria I. Zucchi
5and Roland Vencovsky
61
Embrapa Tabuleiros Costeiros, Aracaju, SE, Brazil.
2
CIRAD, Amélioration Cocotier, Montpellier, France.
3
Universidade Federal de Goiás, Escola de Agronomia, Goiânia, GO, Brazil.
4
Embrapa Arroz e Feijão, Santo Antônio de Goiás, GO, Brazil.
5
Instituto Agronômico de Campinas, Campinas, SP, Brazil.
6
Departamento de Genética, Escola Superior de Agricultura “Luiz de Queiróz”,
Universidade de São Paulo, Piracicaba, SP, Brazil.
Abstract
Coconut palms of the Tall group were introduced to Brazil from the Cape Verde Islands in 1553. The present study sought to evaluate the genetic diversity among and within Brazilian Tall coconut populations. Samples were col-lected of 195 trees from 10 populations. Genetic diversity was accessed by investigating 13 simple sequence re-peats (SSR) loci. This provided a total of 68 alleles, ranging from 2 to 13 alleles per locus, with an average of 5.23. The mean values of gene diversity (He) and observed heterozygosity (Ho) were 0.459 and 0.443, respectively. The
genetic differentiation among populations was estimated atq$p =0 1600 and the estimated apparent outcrossing rate.
was ta= 0.92. Estimates of genetic distances between the populations varied from 0.034 to 0.390. Genetic distance
and the corresponding clustering analysis indicate the formation of two groups. The first consists of the Baía Formosa, Georgino Avelino, and São José do Mipibu populations and the second consists of the Japoatã, Pacatuba, and Praia do Forte populations. The correlation matrix between genetic and geographic distances was positive and significant at a 1% probability. Taken together, our results suggest a spatial structuring of the genetic variability among the populations. Geographically closer populations exhibited greater similarities.
Key words:coconut, genetic diversity, genetic variability, molecular markers, SSR. Received: October 5, 2009; Accepted: April 20, 2010.
Introduction
Two main groups of coconut palm trees (Cocos nuciferaL.), the Tall (Typica) and the Dwarf (Nana) types,
are known. Coconut is the most widely naturally distributed palm tree. It is extensively cultivated around the world and is considered to be one of the most important tropical spe-cies used by man (Persley, 1992). Southeastern Asia is be-lieved to be the center of origin of the species due to the great morphological variability, the large number of popu-lar/local names and plant uses, and the number of associ-ated insects in that region (Persley, 1992). It has been suggested that the spreading of the species throughout di-verse regions of the world occurred naturally, carried by oceanic currents from Southeast Asia to the Pacific and In-dian oceans and by human migration during the
coloniza-tion of Asia and America (Harries, 1978). The introduccoloniza-tion of the species from the Atlantic coast of Africa to America occurred after the discovery of the Cape of Good Hope (Purseglove, 1975), during the period of extensive mercan-tile navigation in the 16thcentury.
The Tall group was introduced to Brazil from the Cape Verde Islands in 1553. Plants of this group exhibit a later reproductive stage than those of the Dwarf group. The reproductive cycle begins after approximately five to seven years, producing a substantial number of large fruits, pri-marily from cross-fertilization (Siqueiraet al., 1998).
In Brazil, the vast majority of coconut palms are lo-cated in the Northeast, where populations of Tall coconut that are more than 80 years old are found. These popula-tions may represent an excellent source of adapted germ-plasm for breeding programs. However, little is known about their genetic variability.
Tall coconut palm trees have been growing in Brazil for more than 450 years. Nowadays, the species is distrib-www.sbg.org.br
Send correspondence to Francisco E. Ribeiro. Embrapa Tabuleiros Costeiros, Av. Beira Mar 3250, Caixa Postal 44, 49.025-040 Ara-caju, SE, Brazil. E-mail: elias@cpatc.embrapa.br.
uted along the coast, from the equator to the Tropic of Capricorn (approximately 23°26’17” south of the equator), with the majority of the plants located on the Northeastern coast. These populations are considered to have adapted to distinct environmental conditions and have undergone ge-netic divergence (Ribeiroet al., 1999), forming ecotypes of
the Tall group.
In contrast to isoenzyme (Benoit H and Ghesquière M, Rapport interne IRHO-CIRAD, FAR), and leaf poly-phenol investigations (Jayet al., 1989), which have led to
inconclusive results, genetic markers based on DNA are considered to be the most acceptable tool for the study of genetic diversity in the coconut (Lebrunet al., 1995).
Fur-ther studies have provided a better understanding of the genetic diversity in several Tall and Dwarf coconut popula-tions by employing Random Amplification of Polymorphic DNA (RAPD) markers (Wadtet al., 1999). More recently,
the quantitative trait loci (QTL) involved in wax compo-nent production were mapped in a controlled-cross popula-tion of Tall genotypes, using amplified fragment polymor-phism (AFLP) and simple sequence repeats (SSR) markers (Riedel et al., 2009). Similarly, SSR markers have also
been shown to be a powerful tool in studies of population structure, due mainly to their multiallelic and highly poly-morphic sequences and their ability to be amplified by polymerase chain reaction (PCR) (Chaseet al., 1996;
Mor-ganteet al., 1996).
In this study we investigated the genetic diversity of 10 populations of Brazilian Tall coconut trees, employing 13 SSR loci to characterize their genetic variability, popu-lation structure, and reproductive system.
Material and Methods
Plant material
For the current study, typical populations of the Tall group of coconut palm trees were chosen based on legiti-macy, homogeneity, and isolation criteria. Legitimacy was based on the population age. Because the Dwarf group was
introduced in Brazil in 1925, only individuals older than 80 years were selected as representatives of the Tall group, thus preventing the inclusion of natural hybrids between the groups. According to the homogeneity criterion, popu-lations exclusively composed of trees from the Tall group were selected. Finally, according to the isolation criterion, we sampled only populations that are 1,000 m distant from Dwarf palm groups or that are 500 m distant plus an inter-vening stretch of vegetation.
The populations described in Table 1 were identified in Brazil as genuine and homogeneous representatives of the Tall group and in adequate conditions of isolation.
DNA extraction
Leaflet segments of approximately 50 cm in length were taken from the youngest leaf of each sampled tree. The DNA was extracted according to the modified CTAB protocol adapted for coconut (Lebrunet al., 1998; Bau-douin and Lebrun, 2002). The DNA concentration was de-termined by automatic fluorimetric quantification (number of evaluated trees per population, see Table 1).
SSR analysis
For the PCR reaction, a final volume of 25mL was prepared. It contained a mixture of 2.5 mL of 10X PCR
buffer, 2.0mL of dNTP (2 mM of each dNTP), 0.25mL of
MgCl2(50 mM stock), 0.5mL of forward primer (10mM stock), 0.5mL of reverse primer (10mM stock), 0.5mL of
Taq DNA Polymerase (2 U/mL), 5 mL of genomic DNA
(2.5 ng/mL), and 13.75 mL of sterile water. PCR reaction
cycles consisted of an initial denaturation step at 94 °C for 5 min, followed by 36 cycles at 94 °C for 30 s for denatu-ration, one minute at 51 °C for primer annealing, and one minute at 72 °C for extension, plus an additional final ex-tension step of 5 min at 72 °C.
Thirteen fluorescence-labeled primer pairs that were designed and selected by Baudouin and Lebrun (2002) were used for SSR amplification. The amplified fragments
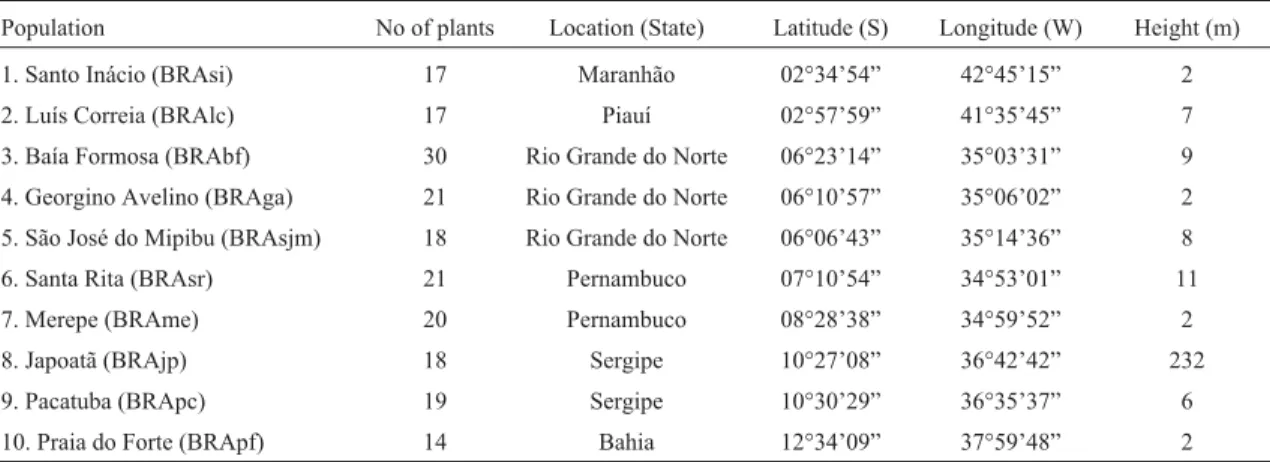
Table 1- Brazilian populations of Tall coconut (Cocos nuciferaL.) investigated in the present study of genetic diversity by microsatellite markers (SSR). Geographic coordinates, plant height and the number of plants are also shown.
Population No of plants Location (State) Latitude (S) Longitude (W) Height (m)
1. Santo Inácio (BRAsi) 17 Maranhão 02°34’54” 42°45’15” 2
2. Luís Correia (BRAlc) 17 Piauí 02°57’59” 41°35’45” 7
3. Baía Formosa (BRAbf) 30 Rio Grande do Norte 06°23’14” 35°03’31” 9
4. Georgino Avelino (BRAga) 21 Rio Grande do Norte 06°10’57” 35°06’02” 2
5. São José do Mipibu (BRAsjm) 18 Rio Grande do Norte 06°06’43” 35°14’36” 8
6. Santa Rita (BRAsr) 21 Pernambuco 07°10’54” 34°53’01” 11
7. Merepe (BRAme) 20 Pernambuco 08°28’38” 34°59’52” 2
8. Japoatã (BRAjp) 18 Sergipe 10°27’08” 36°42’42” 232
9. Pacatuba (BRApc) 19 Sergipe 10°30’29” 36°35’37” 6
were resolved on polyacrylamide gels employing a LICOR IR2 4200 sequencer. The gels were scored and the individu-als were genotyped according to allele size (number of base pairs) in comparison to a standard marker (1 kb).
Statistical analysis
The structuring of the genetic variability was evalu-ated employing F, qp, and f parameters (Weir and Co-ckerham, 1984), which are analogous to the Wright (1951)
FIT,FST, andFISstatistics, respectively. Estimates of the
pa-rameters were obtained using the Genetix 4.03 software (Belkhiret al., 2001). The parameterRST(Slatkin, 1995),
which is an analogue toqpandFST, was also calculated in
order to obtain the interpopulation genetic differentiation rate for comparison purposes. Originally, the parameter was estimated considering a stepwise mutation model, a condition not assumed forqporFST, thus tending to
under-estimate differentiation as the model prevails (Hardyet al.,
2003). TheRSTCalc software (Goodman, 1997) was used to
calculateRSTestimates. Confidence intervals at 95%
proba-bility were obtained for the parameters by bootstrapping 10,000 replicates. The observed heterozigosity (Ho) and gene diversity He(Nei, 1973) were calculated for each indi-vidual population.
To estimateF,q, andf, a random model was assumed
so that the sampled populations are considered to be local representatives of the species and thus are assumed to have a common evolutionary history (Weir, 1996).
For each investigated locus, we did the adherence test to the Hardy-Weinberg proportions, according to Weir (1996), and using the TFPGA software (Miller, 1997) by the conventional Monte Carlo method with 10 batches and 1,000 permutations per batch. The apparent outcrossing rate (ta) was obtained by the fixation indexffor each popu-lation, assuming mating system equilibrium (Vencovsky, 1994), so that ta= (1-f)/(1+f).
Nei (1972) genetic distances were estimated for pop-ulation pairs and used to the neighbor-joining cluster analy-sis (Saitou and Nei, 1987), employing the PHYLIP 3.6 software (Felsenstein, 2004). In order to visually represent the pattern of divergence among the populations, an unrooted dendrogram was constructed. Genetic distances were also correlated to the corresponding geographic dis-tances and the significance of Pearsons correlation coeffi-cient was tested according to the Mantel procedure.
In addition, the software STRUCTURE (Pritchardet al., 2000) was used to investigate the population structure,
using a burn-in of 10,000, a run length of 100,000, and a model that allowed admixture and correlated allele fre-quencies. Ten independent runs yielded consistent results.
Results
The total number of investigated alleles, gene diver-sity (He), and observed heterozygosity (Ho) for each SSR
locus are shown in Table 2. The combination of 13 SSR loci generated a total of 68 alleles, with a mean of 5.23 alleles per locus and ranging from two (CnCir E12) to 13 alleles (CnCir E2). The loci CnCir A3 and CnCir E2 presented the lowest (0.036) value and the highest value (0.671), respec-tively, for observed heterozygosity, with a mean value of 0.443 for the 13 investigated loci in the studied populations. Monomorphic loci were absent from the studied sample. Gene diversity ranged from 0.034 for the locus CnCir A3 to 0.711 for the locus CnCir E2, with an overall mean of 0.459.
Estimates of parameters that were related to the ge-netic structure of the populations were: F$ =0196,.
$ .
qp =01600, and $f =0043 (Table 3). Considering that the. confidence intervals did not include zero, the hypothesis that the respective parameters differ from zero was ac-cepted.
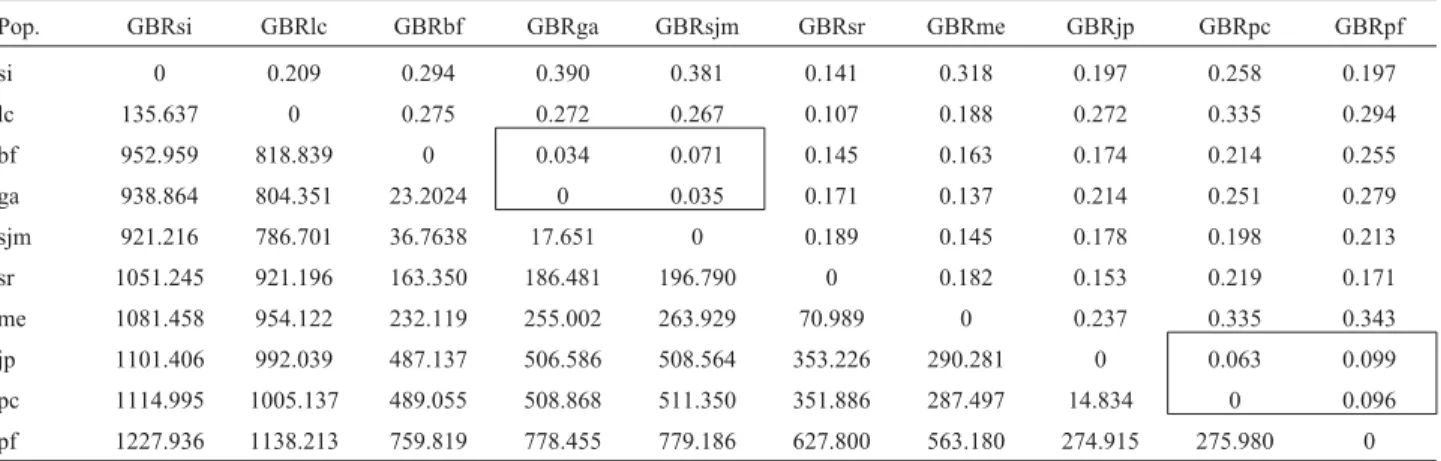
The correlation between the matrix of genetic dis-tances and the geographic disdis-tances among the 10 popula-tions studied was r = 0.598, which is statistically significant (p = 0.0027), according to the Mantel test. The smallest dis-tances were found between the populations of Bahia For-mosa and Georgino Avelino (0.034) and Georgino Avelino and São José do Mipibu (0.035). Relatively small distances were also found for the populations of Japoatã and Pacatu-ba (0.063), Baia Formosa and São José do Mipibu (0.071), Pacatuba and Praia do Forte (0.096), and Japoatã and Praia do Forte (0.099). The greatest genetic distances were ob-served between the populations of Santo Inácio and Geo-rino Avelino (0.390), Santo Inácio and São José do Mipibu (0.381), Merepe and Praia do Forte (0.343), Merepe and Pacatuba (0.335), and Luis Correia and Pacatuba (0.335).
Table 2- Number of alleles per locus, variation in allele length (bp), gene diversity (He), and observed heterozygosity (Ho) estimated for 10
popula-tions of Brazilian Tall coconut trees, using 13 SRR loci.
SSR Locus Allele number Allele length (bp) He Ho
CnCir A3 3 228-240 0.034 0.036
CnCir A9 4 089-103 0.513 0.484
CnCir B6 5 196-208 0.613 0.531
CnCir B12 9 157-181 0.515 0.464
CnCir C7 5 157-167 0.495 0.470
CnCir C12 6 163-183 0.378 0.355
CnCir E2 13 115-165 0.711 0.671
CnCir E10 4 232-246 0.418 0.443
CnCir E12 2 164-174 0.300 0.302
CnCir F2 3 193-205 0.510 0.536
CnCir G11 7 188-210 0.638 0.640
CnCir H4’ 3 218-230 0.330 0.311
CnCir H7 4 133-141 0.512 0.518
Mean 5.23 0.459 0.443
The distance comparison results are summarized in Ta-ble 4.
Estimates of the fixation index (f) for each population and the corresponding confidence intervals are given in Ta-ble 5. These values ranged from -0.100, for the population Pacatuba (9), to 0.134 for the population São José do Mipibu (5), with an overall mean of 0.043. The estimates did not significantly differ from zero, except for the popula-tion of Pacatuba ($f = -0100), which displayed a high fre-. quency of heterozygous individuals. The corresponding values of apparent outcrossing rates (ta) are also shown in Table 5. They ranged around the overall mean of 0.918, which was statistically significant at a 5% probability in comparison to 1.0.
Of the 130 tests for Hardy-Weinberg equilibrium (13 loci in 10 populations), only 16 were statistically cant. For most of the studied populations, statistical signifi-cance was found for only one or two loci. The exception was the population of Baia Formosa with four loci that ex-hibited a significant departure from the Hardy-Weinberg proportions among the 13 loci.
The pattern of genetic divergence among the investi-gated populations of Brazilian Tall coconut that were obtained from the Nei genetic distance is shown as a den-drogram in Figure 1. Data analysis showed a divergent pat-tern among 10 populations, revealing that the populations of Baía Formosa, Georgino Avelino, and Sao Jose do Mipi-bu are genetically similar and represent a distinct group in
comparison to the other populations. These populations are located in the proximity of the city of Natal (RN). A similar Table 3- Estimates of genetic parameters for 10 populations of Brazilian
Tall coconut trees. Confidence interval (CI) at 95% probability.
f qP F RST
Estimate 0.043 0.160 0.196 0.086
Lower limit (CI 95%) 0.013 0.122 0.151 0.052 Upper limit (CI 95%) 0.073 0.199 0.234 0.130
Figure 1- Genetic divergence pattern among ten populations of Brazilian Tall coconut, obtained by the neighbor-joining method based on genetic distances (Nei, 1972).
Table 4- Matrix of Nei genetic (diagonal top half) and geographic distances in km (diagonal bottom half) of pairwise comparisons of 10 populations of Brazilian Tall coconut.
Pop. GBRsi GBRlc GBRbf GBRga GBRsjm GBRsr GBRme GBRjp GBRpc GBRpf
si 0 0.209 0.294 0.390 0.381 0.141 0.318 0.197 0.258 0.197
lc 135.637 0 0.275 0.272 0.267 0.107 0.188 0.272 0.335 0.294
bf 952.959 818.839 0 0.034 0.071 0.145 0.163 0.174 0.214 0.255
ga 938.864 804.351 23.2024 0 0.035 0.171 0.137 0.214 0.251 0.279
sjm 921.216 786.701 36.7638 17.651 0 0.189 0.145 0.178 0.198 0.213
sr 1051.245 921.196 163.350 186.481 196.790 0 0.182 0.153 0.219 0.171
me 1081.458 954.122 232.119 255.002 263.929 70.989 0 0.237 0.335 0.343
jp 1101.406 992.039 487.137 506.586 508.564 353.226 290.281 0 0.063 0.099
pc 1114.995 1005.137 489.055 508.868 511.350 351.886 287.497 14.834 0 0.096
pf 1227.936 1138.213 759.819 778.455 779.186 627.800 563.180 274.915 275.980 0
Values in boxes represent clustered populations.
Table 5- Estimates of the intrapopulation fixation index (f) with corres-ponding confidence interval (95%) and apparent outcrossing rate (ta) for
the 10 investigated populations of Brazilian Tall coconut.
Population F Lower limit Upper limit ta
GBRsi -0.06577 -0.29560 0.07134
-GBRlc 0.01819 -0.16604 0.12592 0.965
GBRbf 0.09898 -0.02575 0.19301 0.820
GBRga 0.12301 -0.04205 0.21392 0.781
GBRsjm 0.13367 -0.04707 0.25312 0.764
GBRsr -0.05849 -0.21674 0.02021
-GBRme 0.10948 -0.09987 0.25301 0.803
GBRjp 0.05944 -0.11711 0.18039 0.888
GBRpc -0.09966* -0.25122 -0.03124
-GBRpf 0.08470 -0.08320 0.16329 0.843
Mean 0.0426 0.0108 0.0731 0.918
situation is observed for Japoatã, Pacatuba, and Praia do Forte populations that also exhibited genetic similarities among themselves, clustering as a second group, which was denominated the Southern group due to its location. The remaining populations exhibit varying divergence pat-terns.
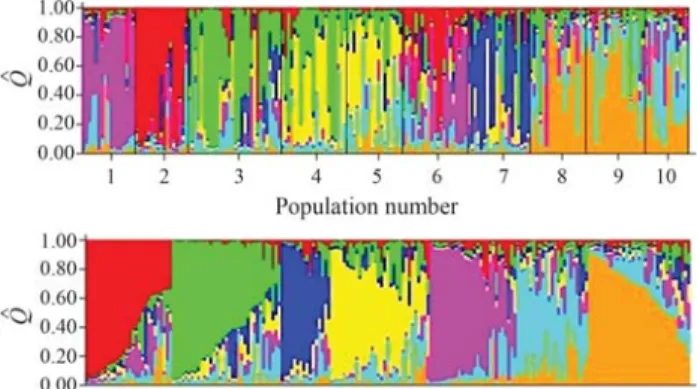
Clustering of individuals was done using the Struc-ture software atK = 7 (Figure 2). Individuals are
repre-sented by vertical colored lines. The same color in distinct individuals indicates that they are from the same cluster. Different colors in the same individual indicate the percent-age of the genome that is inherited from each cluster. Struc-ture analysis (Figure 2) and the dendrogram (Figure 1) were congruent, as clustering gave rise to the same groups, namely: the Natal group, consisting of the populations of Baia Formosa, Georgino Avelino, and São José do Mipibu; and the Southern group, consisting of the populations of Japoatã, Pacatuba, and Praia do Forte (Figure 2).
Discussion
Of the 68 alleles detected, four could be considered to be localized and common, since they were found in a unique population, although with a frequency = 5% (Perera
et al., 2001). To include these alleles in our analysis, the
strategy of collecting relatively small samples in a large number of populations could be employed. Breeding ef-forts are often concentrated on this category of allele, since disperse common alleles are present even in small samples collected from a few populations (Marshall and Brown, 1975).
In the present study, the mean number of alleles per locus (5.2) was similar to that found in other studies of co-conut palm tree populations using SSR markers. Riveraet al.(1999), using 38 SSR loci, found an average of 5.2
al-leles per locus and a range of 2 to 9 alal-leles in a total of 198 SSR markers. Pereraet al.(2000), using 8 SSR loci,
found an average of 6.3 alleles and a range of 3 to 9 in a total of 50 alleles. Konanet al.(2007) evaluated gene diversity
in 21 genotypes of three coconut accessions and detected a total of 68 alleles at 13 microsatellite loci. The number of alleles ranged from 3 to 7, with an average of 4.83 alleles. Gene diversity ranged from 0.475 to 0.832, with an average of 0.686. The extent of genetic diversity in 26 coconut ac-cessions from the Andaman and Nicobar Island was deter-mined using 14 microsatellite markers. A total of 103 alleles were detected with an average of 7.35 alleles per locus, and average observed and expected heterozigosity of 0.29 and 0.66, respectively (Rajeshet al., 2008).
The gene diversity in the present study (He= 0.459) was lower than that found by Pereraet al.(2001) inex situ
collections of Tall coconut trees in Sri Lanka, with values ranging from 0.426 to 0.846 and an average of 0.682. The maximum possible value of gene diversity (Hemax) within a population, for a locus with A alleles, is He(max) = (A-1)/A. With A between 5 and 6, this value is 0.80 and 0.83, respectively, thus indicating that the investigated populations exhibited approximately 56% of the maxi-mum, as a consequence of uneven values of allelic frequen-cies per locus within the populations.
The estimated intrapopulation fixation index (f),
de-spite being significantly different from zero, was small in magnitude (0.043), indicating a predominantly panmixia reproduction system among the populations. The low in-breeding rate detected may have resulted from intermating of related parents or from natural self-fertilization. Further insights on the predominant reproductive system of the investigated populations would require data from the off-spring of maternal families. Considering the overall appar-ent outcrossing rate ta =092. and, in the case of inbreeding
by selfing, the apparent rate of self-fertilization is very small (s$=008 or 8%)..
The value of total fixation was relatively high (F$ =0196). and caused primarily by the considerable degree of genetic divergence among populations (q$p =0160). The estimate. of RST (0.086) was approximately one half of the corre-sponding qP value, although with a slightly overlapping confidence interval. These observations may indicate that the stepwise model is not the most appropriate means to ex-plain the recent evolution of the populations. In fact, the allelic frequencies suggest an independent size distribution for the investigated loci. Therefore, estimateqPwas consid-ered to be more adequate to represent differentiation among populations in the present study. The Nei (1972) inter-population parameter was also estimated for comparison purposes andG$ST =0174 was found to be similar to esti-. matedqP.
The genetic divergence was evaluated from a cluster analysis based on genetic distances, where the populations were grouped on the basis of similarity. The populations of Baia Formosa, Georgino Avelino, and São Jose do Mipibu were clustered as group 1 and labeled Natal; whereas the populations of Japoatã, Pacatuba, and Praia do Forte were Figure 2- Population structure analysis based on multilocus genotyping
data of the ten investigated Tall coconut populations. The first panel refers to a K established for seven groups. The second panel refers to K estab-lished for seven groups separated byQ$(Q$: estimated membership
clustered in group 2 and denominated Southern. The re-maining populations showed erratic patterns of divergence (Figure 1).
The results of the structure analysis (Figure 2) were consistent with the dendrogram (Figure 1). The populations clustered similarly, forming two major groups, namely group 1 (Natal group) and group 2 (Southern group) (Fig-ure 2). Both analyses of the genetic struct(Fig-ure of the studied coconut populations, distance and Bayesian, demonstrated that the interpopulational genetic divergence is spatially structured and probably in a clinal variation pattern. These results are corroborated by the observed correlation be-tween the genetic matrix and geographic distances (r = 0.598), which is considered to be intermediate to high.
Considering the model where a large population is split into subpopulations, the effective sampling size of in-dividual or seed samples is inversely proportional toqP(or FST) (Vencovsky and Crossa, 1999). For high values of this parameter, as observed here, a large number of subpopu-lations must be sampled in order to reach an adequate effec-tive size forex situorin situconservation programs.
These results, along with historical records, suggest that the populations are undergoing a recent process of dif-ferentiation, meaning that a few generations have passed in the process of evolution from the ancestor populations. The first record of the introduction of coconut palms in Brazil dates back to 1553, as mentioned previously. However, in-dividuals from the species can live from 80 to 100 years. This indicates that there have been relatively few genera-tions in Brazil and that the present structuring is probably due to genetic drift, strongly influenced by a founder effect, and possibly due to indirect effect of artificial selection by humans.
The correlation between the genetic and geographic distances matrix (r = 0.598; p = 0.0027) may be considered to be intermediate to high, demonstrating that interpopu-lational genetic divergence is structured spatially and prob-ably in a clinal variation pattern. These analyses indicate that a stochastic process is probably responsible for the dif-ferentiation, with genetic drift only partially counter-balanced by short-distance gene flow.
The data suggest the possibility of clustering of the populations with genetic distances inferior to 0.1. Two ulation groups were formed: group 1 composed by the pop-ulations of Baia Formosa, Georgino Avelino, and São José do Mipibu; and group 2, consisting of the populations of Japoatã, Pacatuba, and Praia do Forte. Our data evidenced that the genetically most similar populations were also geo-graphically closest. The differentiated pattern of the other populations did not allow consistent clustering (Figure 1).
The results of the structure analysis were consistent with the dendrogram. The groups obtained resulted from similar clustering, namely: group 1, consisting of the popu-lation of Baia Formosa, Georgino, Avelino and São José do Mipibu and denominated Natal group; and group 2,
consist-ing of the populations of Japoatã, Pacatuba, and Praia do Forte and called the Southern group (Figure 2).
Estimates of the fixation index (f), with an overall
mean of 0.043 and values of the apparent outcrossing rates (ta) around the overall mean of 0.918, in addition to results of the test of goodness of fit to Hardy-Weinberg equilib-rium, demonstrate that the majority of the populations stud-ied reproduce predominantly by panmixia.
The present study permitted the conclusion that microsatellite markers are effective in estimating genetic variation levels within and between the populations of Bra-zilian Tall coconut trees. BraBra-zilian populations exhibited high genetic divergence detected by the employed markers. Diversity among the investigated populations is spatially structured, with a greater similarity among geographically close populations. The studied populations of Brazilian Tall coconut are preferentially allogamous, with a mean ap-parent outcrossing rate of 92%. Taken together, our results will provide important tools forex situgermplasm
conser-vation, selection, and support of breeding programs in Bra-zil.
References
Baudouin L and Lebrun P (2002) The development of a micro-satellite kit and dedicated software for use with coconuts. Rome: International Plant Genetic Resources Institute (IPGRI). Burotrop Bull 17:16-20.
Belkhir K, Borsa P, Chikhi L, Raufaste N and Bonhomme F (2001) Genetix 4.03. Logiciel sous Windows TM pour la génétique des populations. Laboratoire Génome, Popula-tions, InteracPopula-tions, Université Montpellier II.
Chase M, Kesseli R and Bawa K (1996) Microsatellite markers for population and conservation genetics of tropical trees. Am J Bot 83:51-57.
Felsenstein J (2004) PHYLIP (Phylogeny Inference Package), v. 3.6. Department of Genome Sciences, University of Wash-ington.
Goodman SJ (1997) RSTCalc: A collection of computer program for calculating estimates of genetic differentiation from mi-crosatellite and determining their significance. Mol Ecol 6:881-885.
Hardy OJ, Charbonnel N, Fréville H and Heuertz M (2003) Microsatellite allele sizes: A simple test to assess their sig-nificance on genetic differentiation. Genetics 163:1467-1482.
Harries HC (1978) The evolution, dissemination and classifica-tion ofCocos nuciferaL. Bot Rev 44:165-320.
Jay M, Bourdeix R, Potier F and Sanlaville C (1989) Premiers résultats de l’étude des polyphénols foliaires du cocotier. Oléagineux 44:151-161.
Konan KJN, Koffi KE, Konan JL, Lebrun P, Dery SK and Sangare A (2007) Microsatellite gene diversity in coconut (Cocos nucifera L.) accessions resistants to lethal yellowing dis-ease. Afr J Biotech 6:341-347.
Lebrun P, N’cho YP, Seguin M, Grivet L and Baudouin L (1998) Genetic diversity in coconut (Cocos nuciferaL.) revealed by restriction fragment length polymorphism (RFLP) markers. Euphytica 101:103-108.
Marshall DR and Brown AHD (1975) Optimum sampling strate-gies in genetic conservation. In: Frankel OH and Hawkes JGR (eds) Crop Genetic Resources for Today and Tomor-row. Cambridge University Press, Cambridge, pp 53-80. Morgante M, Pfeiffer A, Costacurta A and Olivieri AM (1996)
Molecular tools for population and ecological genetics in coniferous trees. Phyton 36:133-142.
Nei M (1972) Genetic distance between populations. Am Nat 106:283-292.
Nei M (1973) Analysis of genes diversity in subdivided popula-tions. Proc Natl Acad Sci USA 70:3321-3323.
Perera L, Russel JR, Provan J and Powel W (2000) Use of microsatellite DNA markers to investigate the level of ge-netic diversity and population gege-netic structure of coconut (Cocos nuciferaL.). Genome 43:15-21.
Perera L, Russel JR, Provan J and Powel W (2001) Level and dis-tribution of genetic diversity of coconut (Cocos nuciferaL.
var. Typica form typical) from Sri Lanka assessed by micro-satellite markers. Euphytica 122:381-389.
Persley GJ (1992) Replanting the Tree of Life: Toward an Interna-tional Agenda for Coconut Palm Research. CAB/ACIAR, Wallingford, 156 pp.
Pritchard JK, Stephens M and Donnelly P (2000) Inference of population structure using multilocus genotype data. Genet-ics 155:945-959.
Purseglove JW (1975) Tropical Crops Monocotyledons. 2nd edi-tion. Longman, London, 607 pp.
Rajesh MK, Nagarajan P, Jerard BA, Arunachalam V and Dhana-pal R (2008) Microsatellite variability of coconut accessions (Cocos nucifera L.) from Andaman and Nicobar Islands. Curr Sci 94:1627-1631.
Ribeiro FE, Soares AR and Ramalho MAP (1999) Divergência genética entre populações de coqueiro gigante do Brasil. Pesq Agropec Bras 34:1615-1622.
Riedel M, Riederer M, Becker D, Herran A, Kullaya A, Arana-López G, Peña-Rodriguez L, Billotte N, Sniady V, Rohde W
et al.(2009) Cuticular wax composition inCocos nucifera
L.: Physicochemical analysis of wax components and map-ping of their QTLs onto the coconut molecular linkage map. Tree Genet Genomes 5:53-69.
Rivera R, Edwards KJ, Barker JHA, Arnold GM, Ayad G and Hodgkim T (1999) Isolation and characterization of poly-morphic microsatellites in Cocos nucifera L. Genome 42:668-675.
Saitou N and Nei M (1987) The neighbor-joining method: A new method for reconstructing phylogenetic trees. Mol Biol Evol 4:406-425.
Siqueira ER, Ribeiro FE and Aragão WM (1998) Melhoramento genético do coqueiro. In: Ferreira JMS, Warwick DRN and Siqueira LA (eds) A Cultura do Coqueiro no Brasil. 2nd edi-tion. Embrapa-SPI, Brasília, pp 73-98.
Slatkin M (1995) A measure of population subdivision based on microsatellite allele frequencies. Genetics 139:457-462. Vencovsky R (1994) Variance of an estimative of the outcrossing
rate. Braz J Genet 17:349-351.
Vencovsky R and Crossa J (1999) Variance effective population size under mixed self and random mating with applications to genetic conservation of species. Crop Sci 39:1283-1294. Wadt LHO, Sakiyama NS, Pereira MG, Tupinambá EA, Ribeiro
FE and Aragão WM (1999) RAPD markers in the genetic di-versity study of coconut. In: Oropeza C, Verdeil JL, Ashburner GR, Cardeña R and Santamaría, JM (eds) Cur-rent Advances in Coconut Biotechnology v 35. Kluwer Aca-demic Publishers, Dordrecht, pp 89-97.
Weir BS (1996) Genetics Data Analysis II – Methods for Discrete Population Genetic Data. Sinauer Associates, Sunderland, 455 pp.
Weir BS and Cockerham CC (1984) Estimating F-statistics for the analysis of population structure. Evolution 38:1358-1370. Wright S (1951) The genetical structure of populations. Ann
Eugen15:323-354.
Internet Resources
Miller M (1997) Tools For Population Genetic Analyses (TFPGA) 1.3: A Windows program for analyses of allozyme and molecular population genetic data. Distributed by au-thor at http://www.marksgeneticsoftware.net/.
Associate Editor: Everaldo Gonçalves de Barros