Random Forest-Based Protein Model Quality Assessment
(RFMQA) Using Structural Features and Potential Energy
Terms
Balachandran Manavalan, Juyong Lee, Jooyoung Lee*
Center for In Silico Protein Science, School of Computational Sciences, Korea Institute for Advanced Study, Seoul, Korea
Abstract
Recently, predicting proteins three-dimensional (3D) structure from its sequence information has made a significant progress due to the advances in computational techniques and the growth of experimental structures. However, selecting good models from a structural model pool is an important and challenging task in protein structure prediction. In this study, we present the first application of random forest based model quality assessment (RFMQA) to rank protein models using its structural features and knowledge-based potential energy terms. The method predicts a relative score of a model by using its secondary structure, solvent accessibility and knowledge-based potential energy terms. We trained and tested the RFMQA method on CASP8 and CASP9 targets using 5-fold cross-validation. The correlation coefficient between the TM-score of the model selected by RFMQA (TMRF) and the best server model (TMbest) is 0.945. We benchmarked our method on
recent CASP10 targets by using CASP8 and 9 server models as a training set. The correlation coefficient and average difference between TMRFand TMbestover 95 CASP10 targets are 0.984 and 0.0385, respectively. The test results show that
our method works better in selecting top models when compared with other top performing methods. RFMQA is available for download from http://lee.kias.re.kr/RFMQA/RFMQA_eval.tar.gz.
Citation:Manavalan B, Lee J, Lee J (2014) Random Forest-Based Protein Model Quality Assessment (RFMQA) Using Structural Features and Potential Energy Terms. PLoS ONE 9(9): e106542. doi:10.1371/journal.pone.0106542
Editor:Gajendra P. S. Raghava, CSIR-Institute of Microbial Technology, India
ReceivedApril 30, 2014;AcceptedAugust 6, 2014;PublishedSeptember 15, 2014
Copyright:ß2014 Manavalan et al. This is an open-access article distributed under the terms of the Creative Commons Attribution License, which permits unrestricted use, distribution, and reproduction in any medium, provided the original author and source are credited.
Data Availability:The authors confirm that all data underlying the findings are fully available without restriction. All relevant data are within the paper and its Supporting Information files.
Funding:This work was supported by the National Research Foundation of Korea (NRF) grant funded by the Korea government (MEST) (No. 2008-0061987). The authors thank Korea Institute for Advanced Study for providing computing resources (KIAS Center for Advanced Computation Linux Cluster) for this work. The funders had no role in study design, data collection and analysis, decision to publish, or preparation of the manuscript.
Competing Interests:The authors have declared that no competing interests exist.
* Email: [email protected]
Introduction
The 3D structure of a protein is essential for understanding its function [1]. The success of genome sequencing program resulted in massive amounts of protein sequence data [2]. However, the majority of its 3D structures remain undetermined. Determination of these uncharacterized protein structures by experimental methods such as X-ray crystallography, NMR and electron microscopy is quite difficult and time consuming with high costs. On the other hand, to complement experimental methods, computational methods to predict the 3D (three-dimensional) structure of a protein from its sequence information have been developed. Due to the advances in computing power, it is often possible to generate numerous alternative models for a given protein sequence with little computational burden. However, selecting the best model from the candidate pool remains as a challenging task [3].
Many protein structure prediction methods have been devel-oped and tested in the Critical Assessment of protein Structure Prediction (CASP) experiments [4,5]. Currently, most of the methods, such as I-TASSER [6,7], PMS [8] and Rosetta [9] adopt the sampling-and-selection strategy. The first step is to generate a large number of 3D models with a sampling procedure and the second step is to apply model quality assessment programs to
identify the most native-like conformation. In many cases, the tools fail to select the best model. Therefore, ranking the predicted structural models correctly is an important problem in structural bioinformatics. To overcome such difficulties, in this study, we devised a new global quality evaluation method by using the random forest machine learning method.
learning algorithms, such as support vector machine (SVM), neural network (NN) and random forest (RF) evaluate model quality according to learned ‘‘rules’’ [22–25]. Various attributes extracted from the sequences and structures of proteins are used as input features, and the model quality is obtained from them. The advantage of machine learning methods is that it considers a large number of attributes simultaneously, and can capture a hidden relationship between them, which is hard to be revealed by statistical potentials.
In this study, we have developed an RF-based Model Quality Assessment (RFMQA) method to estimate the ‘‘relative’’ quality of a set of model protein structures. RFMQA combines statistical potentials as well as the consistency measure between structural features extracted from the 3D coordinates of a protein and predicted values from the protein’s primary sequence. Combining several statistical potential terms is a popular strategy that covers various aspects of protein structures and this procedure has been shown to outperform single potential approaches [18,20,21,26]. In RFMQA, we consider three statistical potentials: dDFIRE, Rwplus and GOAP [13–16]. In addition, the consistency of secondary structure and solvent accessibility are also used as input features. A relative TM-score [27] is given as the output of the machine and used to rank given models. We show that RFMQA outperforms single-model methods as well as consensus methods in discriminating the best model, and a good correlation exists between the TM-score of the model selected by RFMQA and that of the best model.
Materials and Methods
Dataset
In this work, we used the single domain targets of CASP8 (85) and CASP9 (72) as well as individual domains from the multi-domain targets, according to the multi-domain definition of CASP8 (79)
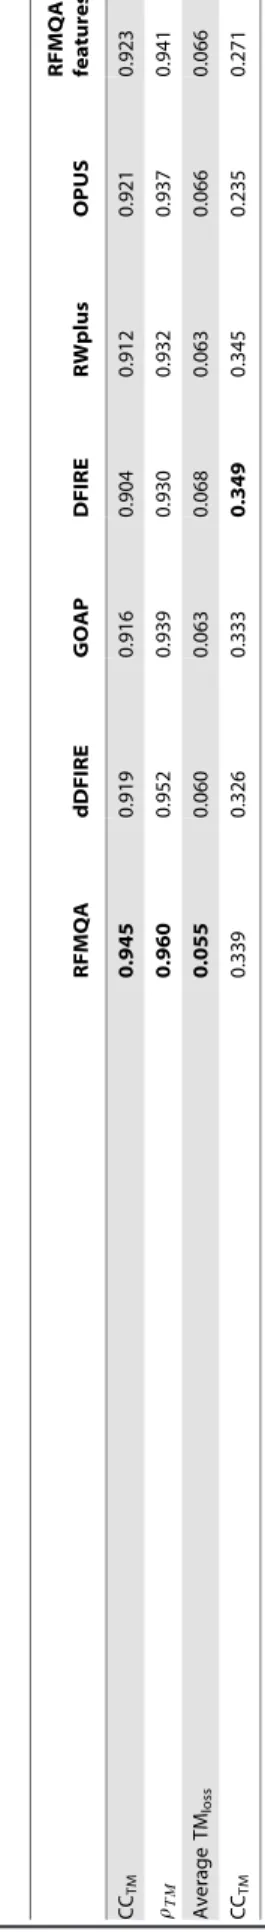
Table 1. Performance of various scoring functions in predicting the quality of the model for five fold validataion. RFMQA dDFIRE GOAP DFIRE RWplus OPUS RFMQA (3 features) CC TM 0.945 0.919 0.916 0.904 0 .912 0.921 0.923 rTM 0.960 0.952 0.939 0.930 0 .932 0.937 0.941 Average T Mloss 0.055 0.060 0.063 0.068 0 .063 0.066 0.066 CC TM 0.339 0.326 0.333 0.349 0.345 0.235 0.271 Note: The first, the second and the third rows respectively represent the correlation coefficient (CC TM ), Spearman’s correlation coefficient ( rTM ) and the average TM-score loss (TM loss ) b etween T Mselect (TM-score of the model selected b y Q A m ethod) and TM best (TM-score of the b est server model). The final row represents the average correlation coefficient between the p redicted ranking and the actual ranki ng (CC Rank ) o ver 229 targets. Bold fonts denote the b est result. doi:10.1371/journal.pone. 0106542.t001
Figure 1. Five-fold cross-validation on CASP8 and CASP9 targets.TM-score of the best server model (TMbest) versus TM-score
of the model selected by RFMQA (TMRF) for five-fold validation is
shown. Pearson’s correlation coefficient and the average TMloss
between TMbestand TMRFare 0.945 and 0.055, respectively.
and CASP9 (75). The final dataset contains 164 and 147 domains from CASP8 and CASP9, respectively. Both template-based and template-free modeling targets were included. All sever models were downloaded from the CASP website (http:// predictioncenter.org/download_area/).
For training of RFMQA, we screened out significantly bad models, for which models are sorted according to their TM-scores [27], and only the top 50% of the models are used. It should be noted that the screening was performed only for the training of our machine. All the benchmarking and testing was done without the screening procedure. In addition, we excluded targets whose average TM-score is less than 0.3. The final dataset contains 229 domains (121 from CASP8 and 108 from CASP9) and 36575 server models.
Feature extraction
In this study, we used 9 features, 3 from potential energy terms, 4 from secondary structures and 2 from solvent accessibility. These features are as follows:
a) Potential energy calculation (3 features). Three statis-tical potentials were used as input features: dDFIRE, GOAP, and RWplus. These potential energies evaluate the structural models from different perspectives. dDFIRE is based on the distance dependent pairwise energy term, DFIRE, and the orientation between atoms (polar-polar, polar-nonpolar) involved in the dipole-dipole interaction [13,14]; GOAP includes DFIRE and additional angle dependent terms [16]; RWplus is a pair-wise distance-dependent atomic statistical potential, which uses an ideal random-walk chain as the reference state [15]. It should be noted that in dDFIRE and GOAP, the identical DFIRE is included.
b) Protein secondary structure (4 features). The consis-tency between predicted and actual secondary structures of a protein is a good indication of the model quality. For each 3D model, we used DSSP to calculate its secondary structure [28,29]. We predicted the secondary structure of the target sequence using PSIPRED [30]. The number of secondary structural element (a -helix,b-strand and coil) matches was calculated between the DSSP and PSIPRED. These numbers were converted into % helix, % sheet and % coil by dividing them by its total chain length Nresto
constitute three features.
For each amino acid residue positioni, its secondary structure typeSi
dcalculated using DSSP is compared withSippredicted by
PSIPRED with the confidence value of Pi. The secondary
structure consistency score of a protein 3D model is defined as:
Secondary structure consistency score =NPres
i~1 Pid(Si
d,Spi)
WhereSi
d,Sip[[1],Pi[[0, 1] andd(Sid,Sip)is the Kronecker
delta function, which gives 1 ifSi
dandSipare identical, otherwise
0. The calculated consistency score was used as the fourth feature. c) Solvent accessibility (2 features). The absolute solvent accessibility (ASA) from the 3D modelAiwas computed by DSSP
[28,29]. We predicted ASA from the amino acid sequenceBiby
SANN [31]. These two values were compared and transformed in to a correlation coefficient and cosine value and used as two features. The cosine value is calculated as:
cos (h)~
PN
i~1 AiBi
ffiffiffiffiffiffiffiffiffiffiffiffiffiffiffiffiffiffi
PN
i~1 A2
iB2i
s
Prior to the training of the Random Forest all feature terms as well as TM-scores were normalized into the range of [0,1] using the following formula:
Xnorm~ x{
min (x) max (x){min (x)
Random forest
Breiman (2001) proposed Random Forest (RF) [32] as an ensemble technique utilizing hundreds or thousands of indepen-dent decision trees to perform classification and regression. RF is a state-of-the-art machine learning technique and has been used for a large number of biological problems [33–39]. One important advantage of RF is that it provides the importance information of each input variable, which is suitable for information retrieving from a dataset of high dimension with noise.
The RF algorithm takes an advantage of two ideas, bagging and the random feature selection. For a given training setDof sizen, bagging generates m new training sets Di each of size n9, by
sampling fromDuniformly and with replacement, which is called as a bootstrap sample. By using this bootstrap sample, an unpruned regression tree is generated. At each successive node, mfeatures are randomly chosen and used to find the best split, which maximizes the information gain measure by Gini impurity [40]. The tree grows until the number of data in the node becomes smaller than the given threshold (cutoff value of 5 is used in this
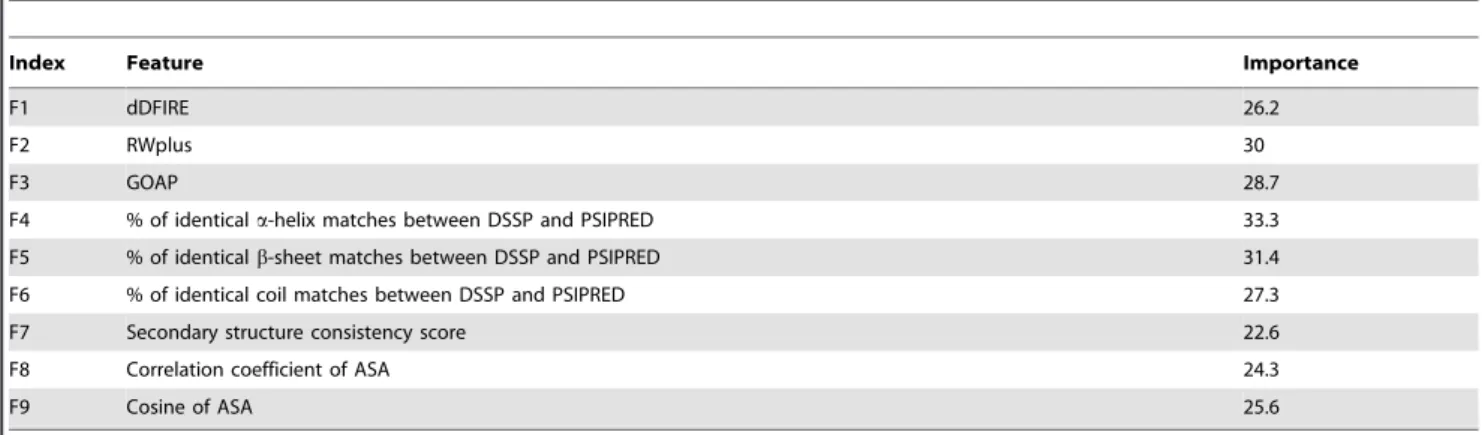
Table 2.The input features used for RFMQA are listed along with their importance estimates.
Index Feature Importance
F1 dDFIRE 26.2
F2 RWplus 30
F3 GOAP 28.7
F4 % of identicala-helix matches between DSSP and PSIPRED 33.3
F5 % of identicalb-sheet matches between DSSP and PSIPRED 31.4
F6 % of identical coil matches between DSSP and PSIPRED 27.3
F7 Secondary structure consistency score 22.6
F8 Correlation coefficient of ASA 24.3
F9 Cosine of ASA 25.6
study). Repeating the aforementioned steps to build a large number of regression trees establish the random forest.
The rest of training data, out of bag (OOB) samples, is used to estimate the error rate of the tree as well as the importance of each variable. When a tree is trained, the error of the tree is estimated using the original OOB data. Next, the test feature is randomly permuted among the OOB data and the error of the tree is re-estimated by using the permuted data. The average difference between the two error estimates over all trees in the forest is the raw importance score for the test feature.
For prediction, input features pass through from the root to the end nodes of all trees based on the predetermined splits. The output of each tree is defined as the average objective value in the end nodes and the ensemble average of outputs from all the trees is considered as the final estimate.
Optimization of the parameters for RF
Several statistical parameters can be tuned to improve the learning in the RF algorithm. In this study, two most influential parameters were the number of trees (ntree) used to compute the
final average predicted value and the number of variables (mtry)
randomly chosen at each node split. We used the RF regression FORTRAN source code downloaded from the Breiman website (http://www.stat.berkeley.edu/,breiman/RandomForests/reg_ home.htm). During each round of cross validation, we optimized the parameters in the following ranges: ntree from 500 to 10000
with the interval of 500 and mtryusing the values of 1, 2, 3, 4, 5, 6
and 7. Finally, random forest consists of 3000 decision trees and mtry= 1 feature was used to obtain the best split at each node
providing the optimal performance.
Table 3.Pairwise comparisons of RFMQA against individual potential energy terms for five fold cross-validation.
dDFIRE GOAP DFIRE Rwplus OPUS
Gain 105 108 127 107 130
Loss 74 88 70 77 66
Equal 50 33 32 45 33
Note: The first row represents the number of models selected by RFMQA that are better than those selected by the potential energy term indicated (Gain). The second row represents the number of models selected by RFMQA worse (Loss) and the third row represents the number of models in tie (Equal).
doi:10.1371/journal.pone.0106542.t003
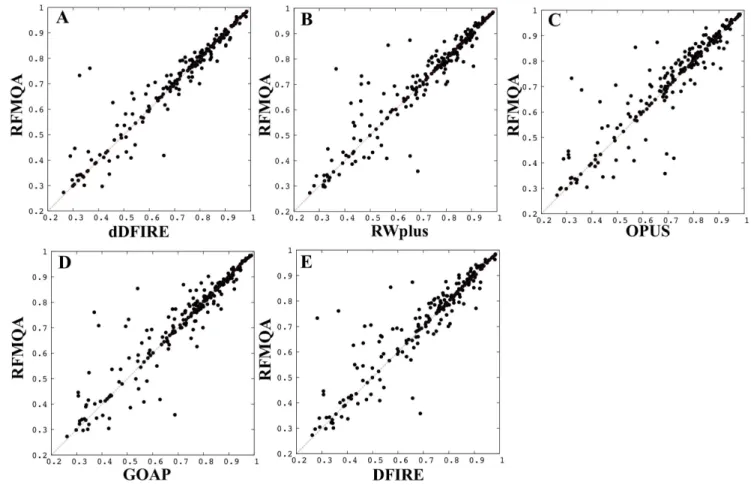
Figure 2. Pairwise comparisons.TMRFagainst TM-score of the model selected by individual statistical potential (TMQA) is shown; (A) dDFIRE
Benchmark datasets
We used two datasets to test the performance of RFMQA method. The first one constitutes CASP10 server models, which were taken from http://www.predictioncenter.org/ download_area/CASP10/server_predictions/. The second one is the full set of I-TASSER decoys [15] downloaded from: http:// zhanglab.ccmb.med.umich.edu.
Evaluation Metrics
We compared the performance of RFMQA with the statistical potential energy terms (dDFIRE, RWplus, GOAP, OPUS and DFIRE). Additionally, we compared our method with top QA
methods in CASP10 (GOAP, ProQ2, PMS, ModFOLDclust2, MULTICOM-CONSTRUCT and Pcons) [41]. Among these methods, GOAP, ProQ2 and PMS are single-model methods [8,16,42]; ModFOLDclust2, MULTICOM-CONSTRUCT and Pcons are consensus methods [19–21,25,43–46]. The performance was evaluated by four complementary measures: Pearson’s correlation coefficient, Spearman’s correlation coefficient and the average loss of TM-score between TMbest (TM-score of the
most native-like structure among decoys) and TMmethod(TM-score
of the model selected by a QA method). The fourth metric is ‘‘Z-score’’; for each target, TM-score of the model (TM) selected by a QA method was converted into Z-score by dividing (TM –
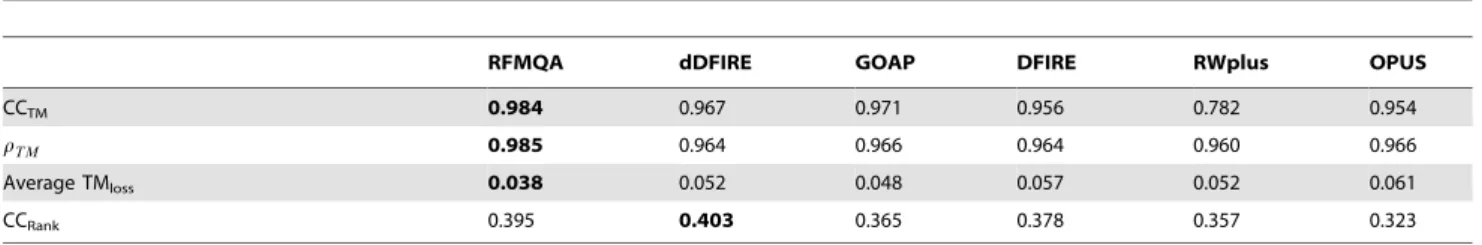
Table 4.Performance of various scoring functions in predicting the quality of the model on CASP10 targets for a blind test.
RFMQA dDFIRE GOAP DFIRE RWplus OPUS
CCTM 0.984 0.967 0.971 0.956 0.782 0.954
rTM 0.985 0.964 0.966 0.964 0.960 0.966
Average TMloss 0.038 0.052 0.048 0.057 0.052 0.061
CCRank 0.395 0.403 0.365 0.378 0.357 0.323
Note: The first, the second and the third rows respectively represents the correlation coefficient (CCTM), Spearman’s correlation coefficient (rTM) and the average
TM-score loss (TMloss) between TMmethod(TM-score of the model selected by a QA method) and TMbest(TM-score of the most native-like structure among decoys). The final row represents the average correlation coefficient between the predicted ranking and the actual ranking (CCRank) of 95 CASP10 targets. Bold fonts denote the best result.
doi:10.1371/journal.pone.0106542.t004
Figure 3. Evaluation of RFMQA on CASP10 targets and its pairwise comparison with other potential energies.(A) TMRFversus TMbest.
Pearson’s correlation coefficient and the average TMlossbetween TMRFand TMbestare 0.984 and 0.039, respectively, (B) dDFIRE versus RFMQA, (C)
TMaverage) by the standard deviation. Additionally, we computed
pairwise comparison between the models selected by TMRF
against the models selected by individual methods. Here, TMRF
refers to the TM-score selected by RFMQA.
Pearson’s correlation coefficient is computed using the following formula:
rp~
Pn
i~1
(xi{xx)(yi{yy)
ffiffiffiffiffiffiffiffiffiffiffiffiffiffiffiffiffiffiffiffiffiffiffiffi
Pn
i~1 (xi{xx)2
s ffiffiffiffiffiffiffiffiffiffiffiffiffiffiffiffiffiffiffiffiffiffiffi
Pn
i~1 (yi{yy)2
s
xandyare the TMmethodand TMbest, respectively.nis the total
number of targets andiis the target index.
Spearman’s correlation is computed using the following equation:
r~1{ 6
P d2
i
n(n2
{1)
For a given number of targets, the raw scores ofXi(TMmethod) and
Yi (TMbest) are converted into ranks of xi and yi. Where
di~xi{yi, is the difference between the ranks.
Results and Discussion
In this study, we carried out two model quality assessment experiments using the single domain targets of recent CASP experiments. In the first experiment, a five-fold cross-validation was performed using CASP8 and CASP9 domain targets. The dataset, which contains 229 targets, was randomly divided into 5 groups, and four groups were used for training and the remaining
group for testing. This procedure was repeated five times. To obtain the performance of RFMQA from the five-fold cross-validation, the prediction result of each target is calculated using the optimal RF machine generated by using four groups excluding the target. In the second experiment, we evaluated the perfor-mance of RFMQA by using the CASP8 and CASP9 as the training dataset and tested the performance against the most recent CASP10 targets.
Performance of RFMQA during five-fold cross-validation using CASP8 and CASP9 targets
To assess the performance of RFMQA and the other individual statistical potentials, we used four measures: 1) the correlation coefficient (CCTM) between the TM-score of the best server
model, TMbest, and the TM-score of the selected model by a QA
method, TMmethod, 2) Spearman’s correlation coefficient (rTM)
between the TM-score of the best server model, TMbest, and the
TM-score of the selected model by a QA method, TMmethod, 3)
the average loss of TM-score, TMloss= TMbest– TMmethod, and 4)
the average correlation coefficient between predicted ranking and the actual ranking of all targets (CCrank) (See Table S1 target
details). From Table 1, it is evident that RFMQA outperforms the other statistical potentials in selecting the best model. The average loss of TM-score by RFMQA is 0.055, while the corresponding values of the other statistical potentials are all over 0.06. The better performance of RFMQA demonstrates that combining information from multiple statistical potentials as well as secondary structure and solvent accessibility prediction can give better results than using a single statistical potential. Among the five statistical potential energy terms, dDFIRE outperforms other potentials in selecting the best server model with the TMlossof 0.06.
A comparison of TMRF and TMbest score is illustrated in
Figure 1. TMRFshows a good correlation with TMbestwith CCTM Table 5.Pairwise comparisons of RFMQA against individual potential energy terms for 95 CASP10 targets.
dDFIRE GOAP DFIRE Rwplus OPUS
Gain 51 42 59 57 59
Loss 28 31 19 23 26
Equal 16 22 17 16 10
Note: The first row represents the number of models selected by RFMQA that are better than those selected by the potential energy terms indicated (Gain). The second row represents the number of models selected by RFMQA worse (Loss) and the third row represents the number of models in tie (Equal).
doi:10.1371/journal.pone.0106542.t005
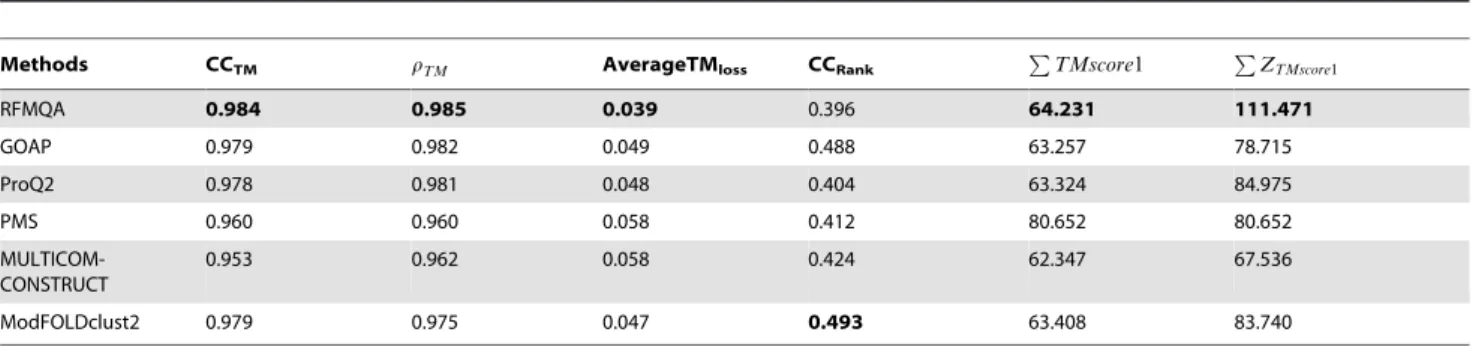
Table 6.Benchmark of the model quality evaluation on the CASP10 dataset.
Methods CCTM rTM AverageTMloss CCRank PTMscore1 PZTMscore1
RFMQA 0.984 0.985 0.039 0.396 64.231 111.471
GOAP 0.979 0.982 0.049 0.488 63.257 78.715
ProQ2 0.978 0.981 0.048 0.404 63.324 84.975
PMS 0.960 0.960 0.058 0.412 80.652 80.652
MULTICOM-CONSTRUCT
0.953 0.962 0.058 0.424 62.347 67.536
ModFOLDclust2 0.979 0.975 0.047 0.493 63.408 83.740
Note: The first column represents the method name. The second, the third and the fourth columns respectively represent the correlation coefficient (CCTM), Spearman’s correlation coefficient (rTM) and the average TM-score loss (TMloss) between TMmethod(TM-score of the model selected by a QA method) and TMbest(TM-score of the most native-like structure among decoys). The fifth column represents the average correlation coefficient between the predicted ranking and the actual ranking
(CCRank).PTMscore1is the sum of the first-ranked models andPZTMscore1is the sum of Z-score for the first-ranked models. Bold fonts denote the best result.
of 0.945 andrTMof 0.965. This strong correlation indicates that RFMQA can successfully rank the relative structural qualities of protein 3D models and identify the best model accurately. Moreover, we trained another new RFMQA by using only the statistical potential energy terms as input features. The resulting CCTMand TMlossvalues are 0.923 and 0.066 respectively. These
metrics are slightly worse than the values obtained by RFMQA with 9 features (Table 1), indicating that the combination of various potential energies and consistency between predicted and calculated values from 3D models improves the performance.
One of the advantages of random forest method over other machine learning technique is that the importance of input features can be readily obtained during the training. The importance estimation results are shown in Table 2. The results show that the contribution of 9 features is more or less equal. To get more detailed view on the performance of RFMQA, we performed the pairwise comparison of TMRFand TM-score of the
model selected by each individual potential energy function (Table 3 and Figure 2). Note that, in Figure 2, the points above the diagonal line correspond to the cases where RFMQA outperforms the other method. The numbers of better and worse predictions by RFMQA compared to each statistical potential, are 105/74 (dDFIRE), 107/77 (RWplus), 130/66 (OPUS), 108/88 (GOAP) and 127/70 (DFIRE). These numbers show that RFMQA model selection is better than the other statistical potential.
Performance on CASP10 targets
To validate the effectiveness of our proposed method, we applied it to the CASP10 targets, where we trained a new RF tree by using the CASP8 and 9 single domain targets as a training set, and the CASP10 targets as a test set (see Table S2). For benchmarking, we utilized 95 targets (QA1; stage2), which were used in the official CASP10 assessment. Prior to the quality assessment, we removed the disordered region in the models predicted by Disopro [47] and subjected those models to quality assessment.
First, we compared the performance of RFMQA with statistical potential energy terms and then with the top QA methods from CASP10. From Table 4, it is clear that RFMQA outperforms the other individual statistical potentials. The average TMloss of
RFMQA is 0.038, while that of the best performing statistical potential, GOAP, is 0.049. This difference is more remarkable than the previous 5-fold cross-validation experiment. The pairwise comparison of TMRF with the TMbestis illustrated in Figure 3.
The CCTM between them is 0.984, while the best performing
statistical potential, GOAP, is 0.978. The pairwise comparison of TMRFand TM-score of the model selected by individual energy
terms are shown in Figure 3 and Table 4 & 5. The results show that the number of better predictions by RFMQA is larger than those from the other individual statistical potentials.
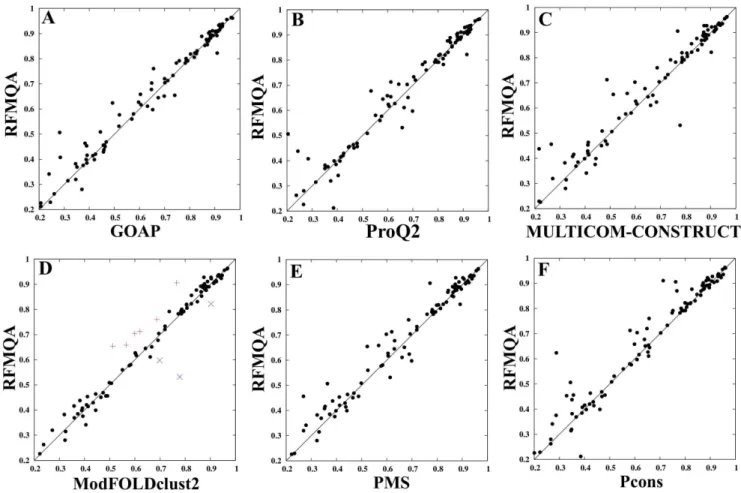
Figure 4. Comparison of RFMQA with top QA methods on CASP10 models.(A) GOAP versus RFMQA, (B) ProQ2 versus RFMQA, (C)
Comparison of RFMQA with other methods on CASP10 models
CASP10 assessed a variety of model quality evaluation methods including meta methods, clustering methods, energy-based meth-ods and machine learning methmeth-ods [41,48,49]. In this case, we did not try to re-evaluate these methods. Instead, we compared the RFMQA results with top QA (GOAP, ProQ2, PMS, ModFOLD-clust2, MULTICOM-CONSTRUCT and Pcons) results from the official CASP10 assessment (http://predictioncenter.org/casp10/ qa_analysis.cgi). Among the top QA methods, the ModFOLD-clust2 consensus method produced the best results in terms of CCTM (0.979),average TMloss(0.047) and the TM-score sum of
the top model (63.40) (see Table 6). However, RFMQA consis-tently outperforms ModFOLDclust2 with CCTMof 0.984, average
TMlossof 0.038, and the TM-score sum of 64.23. This result shows
that our method selects models closer to the native structure than those selected by other methods. In case of CCRank,
ModFOLD-clust2 is better than any other methods compared in this study including RFMQA.
To get a detailed view on the performance of RFMQA, we performed the pairwise comparison of TMRFand the TM-score of
the model selected by other QA methods (Figure 4 and Table 7). The results show that the number of better predictions by RFMQA is larger than those from the other QA methods. Since, ModFOLDclust2 was the top performer, we compared it with our method in detail as below.
The pairwise comparison of RFMQA and ModFOLDclust2 shows that RFMQA gains in 56 cases with an average TM-score gain (TMRF-TMModFOLDclust2) of 0.031 and looses in 37 cases with
an average TM-score loss of (TMModFOLDclust2 - TMRF) 0.025.
The benchmarking dataset contain 22 multiple domain proteins (highlighted in magenta in Table S2), where RFMQA is better than ModFOLDclust2 in 16 cases. These results show that RFMQA works well for single domains as well as multiple domains. More specifically, RFMQA selected models better than those by ModFOLDclust2 for the following targets: T0658, T0685, T0698, T0715, T0719, T0743 and T0744 (shown as+
in Figure 4D). The average difference in TM-score is 0.109. On the other hand, ModFOLDclust2 performed better for T0700, T0714 and T0742 (shown as x in Figure 4D). Furthermore, we examined the targets with TM-score difference [(TMRF –
TMModFOLDclust2), (TMModFOLDclust2– TMRF)]$0.05. Table S3
shows that RFMQA works well in 8/8 cases for the class of alpha+
beta proteins; 1/3 case for the class of all-alpha proteins and 1/2
Table 7.Pairwise comparisons of RFMQA against top CASP10 methods.
GOAP ProQ2 PMS MULTICOM-CONSTRUCT ModFOLDclust2 Pcons
Gain 51 56 59 59 56 57
Loss 31 31 32 34 37 38
Equal 13 8 4 2 2 0
Note: The first row represents the number of models selected by RFMQA that are better than those selected by a top QA method (Gain). The second row represents the number of models selected by RFMQA worse (Loss) and the third row represents the number of models in tie (Equal).
doi:10.1371/journal.pone.0106542.t007
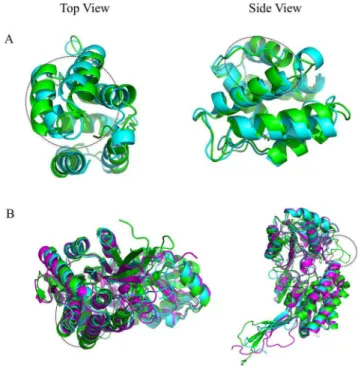
Figure 5. Examples of good predictions by RFMQA are shown for (A) T0698 and (B) T0715.Models selected by RFMQA (magenta) and ModFOLDclust2 (green) are shown as superposed against the TMbestmodel (cyan).
doi:10.1371/journal.pone.0106542.g005
Figure 6. Examples of bad predictions by RFMQA are shown for (A) T0700 and (B) T0742.Models selected by RFMQA (magenta) is shown as superposed against the TMbestmodel (cyan).
case for the class of all-beta proteins. Overall, our results indicate that RFMQA selects, on average, better models than ModFOLD-clust2.
Two examples of better predictions by RFMQA over ModFOLDclust2 are shown in Figure 5. Models selected by RFMQA (magenta) and ModFOLDclust2 (green) are shown as superposed against the TMbestmodel (cyan) for targets T0698 and
T0715. Since the RFMQA-selected model is identical to the TMbest model in the case of T0698, we compared TMbestwith
ModFOLDclust2. Figure 5A shows that the model selected by ModFOLDclust2 is problematic at the N- and C-terminal helix-helix packing with a slight deviation in the loop region between the helices. Another example is ana+b protein shown in Figure 5B (T0715), where the model selected by ModFOLDclust2 is problematic at the N-terminal region helix-helix packing (see top view). Side view shows that in the middle region (shown inside a
circle) it has a long loop instead of extending a helix. On the other hand, the RFMQA model is quite similar to the TMbest model
with only small deviation in the loop between two helices. Examples of worse predictions by RFMQA are shown for T0700 and T0742 in Figure 6. Since the ModFOLDclust2-selected model is identical to the TMbestmodel in both cases, we
compared the TMbestmodel with the RFMQA model. Figure 6A
shows that the RFMQA model is problematic in helix-turn-helix packing (top and side views). The lower panel shows that the RFMQA model for T0743 (Figure 6B) is problematic at the N-terminal region, where it has a long loop instead of helix-turn-helix motif (side view; marked in circle). Top view shows that loop connecting the beta-barrel deviates from the TMbest model
(Figure 6B).
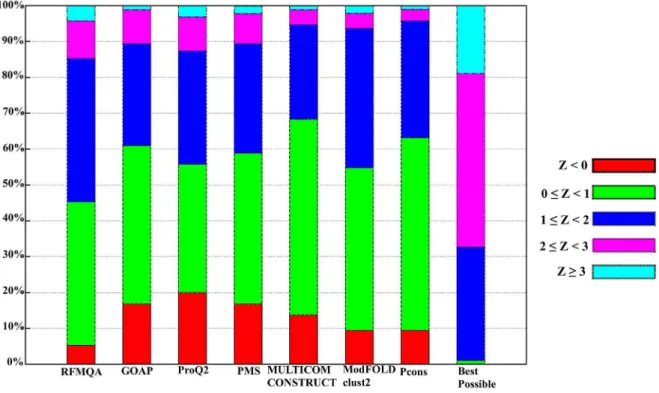
Furthermore, to analyze the target selection in detail, we calculated Z-score by subtracting the mean quality from the model
Figure 7. Distribution of Z-score for the model selection on CASP10 targets.Z,0 is colored in red; 0#Z,1 is colored in green; 1#Z,2 is colored in blue; 2#Z,3 is colored in magenta and Z$3 is colored in cyan.
doi:10.1371/journal.pone.0106542.g007
Table 8.Performance test on the I-TASSER decoy set.
Methods CCTM rTM AverageTMloss PTMscore1 PZTMscore1
RFMQA 0.935 0.913 0.089 32.906 44.454
ModFOLDclust2 0.912 0.908 0.095 32.588 42.826
dDFIRE 0.919 0.921 0.099 32.40 39.08
RWplus 0.902 0.920 0.100 32.314 37.069
OPUS 0.883 0.883 0.130 30.652 16.559
GOAP 0.894 0.897 0.115 31.497 28.229
Note: The first column represents the method name. The second, the third and the fourth columns respectively represent the correlation coefficient (CCTM), Spearman’s correlation coefficient (rTM) and average TM-score loss (TMloss) between TMmethod(TM-score of the model selected by a QA method) and TMbest(TM-score of the most native-like structure among decoys).P
TMscore1is the sum of the first-ranked models andP
ZTMscore1is the sum of Z-score for the first-ranked models. Bold fonts denote the best result.
selected (TM-score) divided by the standard deviation of each target. These Z-scores are not biased by the target difficulty, as the score is normalized by the quality distribution of each target. Hence, it can directly measure the added value of the model quality assessment program relative to a random pick, which would have the value of zero Z-score. Distributions of Z-scores by various methods are shown in Figure 7. The result shows that only 5.3% of RFMQA-selected models are worse than the average (Z,
0), while the next best performing Pcons and ModFOLDclust2 have about 9.5% of targets in that range. Conversely, 14.7% of the RFMQA selected model is of high Z-score (Z$2), while the next best performing ProQ2 has 12.7% in that range. Interestingly, in the figure, all single-model methods select more models with Z$2 than all consensus methods (ModFOLDclust2, MULTICOM-CONSTRUCT and Pcons). Overall, it shows that RFMQA model selection is consistently better than the other single-model and consensus methods.
Benchmarking on I-TASSER decoys
In addition to the CASP10 targets, we evaluated the perfor-mance of RFMQA on I-TASSER dataset (see Table S4 for detail of targets) to identify the best decoys. The results summarized in Table 8 show that ModFOLDclust2 outperforms the other statistical potential methods such as dDFIRE, RWPlus, OPUS, GOAP and DFIRE in terms of average TMloss(0.095), TM-score
sum of the top model (32.588) and Z-score (42.826). However, again, RFMQA is better than ModFOLDclust2 with TMloss of
0.089, TM-score sum of 32.906, and Z-score 44.454. Overall, our result shows that models selected by RFMQA are consistently closer to the native structure than those selected by other QA methods.
Conclusion
In this study, we have developed RFMQA by combining various scoring functions and consistency terms between predicted values and calculated values from 3D models. The current method can predict the relative score of a single model using the potential energy terms and the structural features. The predicted score can be used to rank given 3D protein models and to identify the best model. To evaluate the efficiency of our method, we applied it to recent CASP10 targets. The test results show that RFMQA method is better than other QA methods tested in this study. Its performance generalizes well to different protein targets and structure predictors. Therefore, this new method can be used as a
quality assurance component for any protein structure prediction tool.
Supporting Information
Table S1 List of CASP8 and CASP9 targets used for
5-fold validation.Columns from left to right represent the target
name, the TM-score of the model selected by RFMQA, dDFIRE, RWplus, OPUS, GOAP and DFIRE. The last column corre-sponds to the best out of all decoys.
(XLS)
Table S2 List of CASP10 targets used for
benchmark-ing. Colums represent the target name, the TM-score of the model selected by RFMQA, GOAP, ProQ2, MULTICOM-CONSTRUCT, ModFOLDclust2, Pcons, PMS, dDFIRE, DFIRE, RWplus and GOAP. The last column corresponds to the best out all decoys. FM targets and Multidomain targets are respectively highlighted in yellow and magenta.
(XLSX)
Table S3 Targets with the TM-score difference greater than 0.05 are listed. The first 11 targets correspond to those with (TMRF– TMModFOLDclust2)$0.05 and the last 3 are to those with
(TMModFOLDclust2– TMRF)$0.05.
(DOCX)
Table S4 List of I-TASSER decoys used for
benchmark-ing. Colums represent the target name, the TM-score of the model selected by GOAP, dDFIRE, RWplus, OPUS, DFIRE, RFMQA an ModFOLDclust2. The last column corresponds to the best out all decoys.
(XLSX)
Acknowledgments
The authors thank Korea Institute for Advanced Study for providing computing resources (KIAS Center for Advanced Computation Linux Cluster) for this work.
Author Contributions
Conceived and designed the experiments: BM Juyong Lee Jooyoung Lee. Performed the experiments: BM. Analyzed the data: BM Juyong Lee Jooyoung Lee. Contributed reagents/materials/analysis tools: Jooyoung Lee. Contributed to the writing of the manuscript: BM Juyong Lee Jooyoung Lee.
References
1. Baker D, Sali A (2001) Protein structure prediction and structural genomics. Science 294: 93–96.
2. Lander ES, Linton LM, Birren B, Nusbaum C, Zody MC, et al. (2001) Initial sequencing and analysis of the human genome. Nature 409: 860–921. 3. Kihara D, Chen H, Yang YD (2009) Quality assessment of protein structure
models. Curr Protein Pept Sci 10: 216–228.
4. Kryshtafovych A, Venclovas C, Fidelis K, Moult J (2005) Progress over the first decade of CASP experiments. Proteins 61 Suppl 7: 225–236.
5. Moult J (2005) A decade of CASP: progress, bottlenecks and prognosis in protein structure prediction. Curr Opin Struct Biol 15: 285–289.
6. Roy A, Kucukural A, Zhang Y (2010) I-TASSER: a unified platform for automated protein structure and function prediction. Nat Protoc 5: 725–738. 7. Zhang Y (2009) I-TASSER: fully automated protein structure prediction in
CASP8. Proteins 77 Suppl 9: 100–113.
8. Joo K, Lee J, Sim S, Lee SY, Lee K, et al. (2014) Protein structure modeling for CASP10 by multiple layers of global optimization. Proteins 82 Suppl 2: 188– 195.
9. Simons KT, Bonneau R, Ruczinski I, Baker D (1999) Ab initio protein structure prediction of CASP III targets using ROSETTA. Proteins Suppl 3: 171–176. 10. Lazaridis T, Karplus M (1999) Discrimination of the native from misfolded
protein models with an energy function including implicit solvation. J Mol Biol 288: 477–487.
11. Petrey D, Honig B (2000) Free energy determinants of tertiary structure and the evaluation of protein models. Protein Sci 9: 2181–2191.
12. Lu M, Dousis AD, Ma J (2008) OPUS-PSP: an orientation-dependent statistical all-atom potential derived from side-chain packing. J Mol Biol 376: 288–301. 13. Yang Y, Zhou Y (2008) Specific interactions for ab initio folding of protein
terminal regions with secondary structures. Proteins 72: 793–803.
14. Yang Y, Zhou Y (2008) Ab initio folding of terminal segments with secondary structures reveals the fine difference between two closely related all-atom statistical energy functions. Protein Sci 17: 1212–1219.
15. Zhang J, Zhang Y (2010) A novel side-chain orientation dependent potential derived from random-walk reference state for protein fold selection and structure prediction. PLoS One 5: e15386.
16. Zhou H, Skolnick J (2011) GOAP: a generalized orientation-dependent, all-atom statistical potential for protein structure prediction. Biophys J 101: 2043–2052. 17. Zhou H, Zhou Y (2002) Distance-scaled, finite ideal-gas reference state improves structure-derived potentials of mean force for structure selection and stability prediction. Protein Sci 11: 2714–2726.
18. Benkert P, Tosatto SC, Schwede T (2009) Global and local model quality estimation at CASP8 using the scoring functions QMEAN and QMEANclust. Proteins 77 Suppl 9: 173–180.
20. Larsson P, Skwark MJ, Wallner B, Elofsson A (2009) Assessment of global and local model quality in CASP8 using Pcons and ProQ. Proteins 77 Suppl 9: 167– 172.
21. Wallner B, Elofsson A (2007) Prediction of global and local model quality in CASP7 using Pcons and ProQ. Proteins 69 Suppl 8: 184–193.
22. Ginalski K, Elofsson A, Fischer D, Rychlewski L (2003) 3D-Jury: a simple approach to improve protein structure predictions. Bioinformatics 19: 1015– 1018.
23. Qiu J, Sheffler W, Baker D, Noble WS (2008) Ranking predicted protein structures with support vector regression. Proteins 71: 1175–1182.
24. Shi X, Zhang J, He Z, Shang Y, Xu D (2011) A sampling-based method for ranking protein structural models by integrating multiple scores and features. Curr Protein Pept Sci 12: 540–548.
25. Wang Z, Tegge AN, Cheng J (2009) Evaluating the absolute quality of a single protein model using structural features and support vector machines. Proteins 75: 638–647.
26. Wallner B, Fang H, Elofsson A (2003) Automatic consensus-based fold recognition using Pcons, ProQ, and Pmodeller. Proteins 53 Suppl 6: 534–541. 27. Zhang Y, Skolnick J (2004) Scoring function for automated assessment of protein
structure template quality. Proteins 57: 702–710.
28. Joosten RP, te Beek TA, Krieger E, Hekkelman ML, Hooft RW, et al. (2011) A series of PDB related databases for everyday needs. Nucleic Acids Res 39: D411–419.
29. Kabsch W, Sander C (1983) Dictionary of protein secondary structure: pattern recognition of hydrogen-bonded and geometrical features. Biopolymers 22: 2577–2637.
30. McGuffin LJ, Bryson K, Jones DT (2000) The PSIPRED protein structure prediction server. Bioinformatics 16: 404–405.
31. Joo K, Lee SJ, Lee J (2012) Sann: solvent accessibility prediction of proteins by nearest neighbor method. Proteins 80: 1791–1797.
32. Breiman L (2001) Random forests. Machine learning 45: 5–32.
33. Fang J, Dong Y, Williams TD, Lushington GH (2008) Feature selection in validating mass spectrometry database search results. J Bioinform Comput Biol 6: 223–240.
34. Fang J, Koen YM, Hanzlik RP (2009) Bioinformatic analysis of xenobiotic reactive metabolite target proteins and their interacting partners. BMC Chem Biol 9: 5.
35. Lee J, Lee J (2013) Hidden information revealed by optimal community structure from a protein-complex bipartite network improves protein function prediction. PLoS One 8: e60372.
36. Li Y, Fang J (2012) PROTS-RF: a robust model for predicting mutation-induced protein stability changes. PLoS One 7: e47247.
37. Sikic M, Tomic S, Vlahovicek K (2009) Prediction of protein-protein interaction sites in sequences and 3D structures by random forests. PLoS Comput Biol 5: e1000278.
38. Wang L, Yang MQ, Yang JY (2009) Prediction of DNA-binding residues from protein sequence information using random forests. BMC Genomics 10 Suppl 1: S1.
39. Lee J, Gross SP, Lee J (2013) Improved network community structure improves function prediction. Sci Rep 3: 2197.
40. Quinlan J (1986) Induction of decision trees. Machine learning 1: 81–106. 41. Kryshtafovych A, Barbato A, Fidelis K, Monastyrskyy B, Schwede T, et al.
(2014) Assessment of the assessment: evaluation of the model quality estimates in CASP10. Proteins 82 Suppl 2: 112–126.
42. Ray A, Lindahl E, Wallner B (2012) Improved model quality assessment using ProQ2. BMC Bioinformatics 13: 224.
43. McGuffin LJ, Roche DB (2010) Rapid model quality assessment for protein structure predictions using the comparison of multiple models without structural alignments. Bioinformatics 26: 182–188.
44. Wang Z, Eickholt J, Cheng J (2010) MULTICOM: a multi-level combination approach to protein structure prediction and its assessments in CASP8. Bioinformatics 26: 882–888.
45. McGuffin LJ (2008) The ModFOLD server for the quality assessment of protein structural models. Bioinformatics 24: 586–587.
46. McGuffin LJ (2009) Prediction of global and local model quality in CASP8 using the ModFOLD server. Proteins 77 Suppl 9: 185–190.
47. Cheng J, Sweredoski M, Baldi P (2005) Accurate Prediction of Protein Disordered Regions by Mining Protein Structure Data. Data Mining and Knowlege Discovery 11: 213–222.
48. Cozzetto D, Kryshtafovych A, Ceriani M, Tramontano A (2007) Assessment of predictions in the model quality assessment category. Proteins 69 Suppl 8: 175– 183.