* Corresponding author. Tel: +267 355 4306
E-mail addresses: [email protected] (M. Mutingi) © 2013 Growing Science Ltd. All rights reserved.
doi: 10.5267/j.dsl.2013.01.002
Contents lists available at GrowingScience
Decision Science Letters
homepage: www.GrowingScience.com/dsl
Understanding the dynamics of the adoption of renewable energy technologies: A system dynamics approach
Michael Mutingi*
Department of Mechanical Engineering, University of Botswana, P Bag 0061 UB Post, Gaborone, Botswana C H R O N I C L E A B S T R A C T
Article history:
Received October 2, 2012 Received in Revised Format January 23, 2013
Accepted January 24, 2013 Available online January 24 2013
Renewable energy technologies (RET) have faced a number of constraints that have affected their rate of adoption. This can be attributed to the presence of complex dynamic factors associated with the technology adoption process. This paper simulates the dynamic behaviour of the RET adoption process, from a systems dynamics point of view. Complex dynamic interactions between technology adopters, policy makers and policies are captured based on systems thinking concepts. Based on a set of input policy parameters and variables, the behaviour of RET adoption is investigated and analyzed. Sensitivity experiments and further “what-if” experiments are carried out to obtain in-depth understanding of RET adoption process. Useful managerial insights are drawn from the simulation results, relevant to decision makers concerned with renewable energy technology innovations and their adoption.
© 2013 Growing Science Ltd. All rights reserved.
Keywords:
System dynamics Technology adoption Renewable energy technology Technology management
1. Introduction
manage RETs and their adoption. Existing studies have covered a variety of topics on solar energy, biomass (Peter, 2010), and wind. Some of the key areas of interest include technology research and development, economic analysis (Huang, 2009; John et al. 1998), and policy recommendations (Li et al., 2009; Beck & Martinot, 2004). These studies highlighted important factors that affect the adoption of RETs, which include technical characteristics (John et al., 1998), economic considerations (Li et al., 2009) as well as financial subsidies (Ernest & Mathew, 2009; Krushna & Leif, 2008). Furthermore, factors such as government initiatives (Raja & Vasanthi, 2006), RET adopters’ awareness (Vicki & Tomas, 2008), natural resources availability and environmental and other barriers and constraints to RET adoption were highlighted (Chandrasekara & Tara, 2007; Marida et al. 2010).
For effective dissemination and adoption of RETs, the barriers and constraints highlighted above must be dealt with. First, policy makers need to obtain in-depth understanding of the dynamics of technology adoption. Second, system models can then be used to abstract the major factors behind the observed complex behaviour of technology adoption. Third, this initiative calls for drastic measures in regards to the reformation of investment policies or strategies, strengthening of information dissemination and improving technical support for the technology adopters. However, it is important to note that the overall success of the policy or strategy formulation largely depends on the depth of understanding of the dynamics inherent in the RET adoption process.
The dynamics of technology adoption is a result of complex interactions, time delays, and feedbacks within a complex dynamic environment (Chen, 2011). In particular, the RET adoption process is often associated with complex interactions and feedbacks between technology providers, individuals, organizations, policy makers and other stakeholders. In real world technology adoption process, a potential adopter passes through a series of identifiable phases: initial knowledge dissemination, adopter perception or attitude, technology take up or refusal, technology practice, and finally confirmation of technology adoption confirming the adoption or usage (Chen, 2011). RET adoption follows through these phases. As such, the process comprises a series of dynamic decisions and actions.
In view of the above issues, the purpose of this study is to investigate the dynamics of the RET adoption based on system dynamics approach. System dynamics is a potential tool for investigating the dynamics of RET adoption. In this regard, we develop a system dynamics-based RET adoption model, drawing from the Bass model (Bass, 1969) and the three phase model developed by Chen (2011), consisting of technology take-up, practice, and confirmation phases. In this development, the objectives of this study are as follows:
(i) To identify the stages and the dynamic interactive factors of a typical RET adoption process; (ii) To develop a system dynamics model that incorporates the identified dynamic factors; and,
(iii)To carry out a simulation study, so as to derive useful managerial insights, relevant to policy makers.
The remainder of this paper is structured as follows. The next section provides a brief background to system dynamics as a systems simulation tool. Section 3 presents the system dynamics simulation model for the RET adoption process. This is followed by illustrative simulation experiments and results in Section 4. Section 5 presents the simulation results, together with relevant discussions. Finally, Section 6 concludes the paper highlighting the contributions, managerial implications and further research prospects.
2. System Dynamics: a background
M. Mutingi / Decision Science Letters 2 (2013)
111
focus on policy analysis and design. The approach basically consists of causal loop and stock flow model diagrams. While a causal loop diagram depicts the causal hypotheses of a system in an aggregate form, a stock flow diagram represents the system flow structure. In a more mathematical form, stocks are accumulations of net inflows and can be represented mathematically as follows;
0 0
( ) t ( ) ( ) ( )
t
S t
inflow s outflow s dsS t , (1)where, S(t) defines the stock at time t; inflow(s) and outflow (s) denote the values of the inflow and outflow at any time s.
On the other hand, flow variables describe the rates of change of the stocks. Thus, stocks are adjusted according to their net flows. In turn, the net flows are equivalent to the rate of change of the stocks according to the following expression:
d
( ) ( ) ( )
dt S inflow t outflow t
(2)
SD methodology has been applied to a number of practical problems, including corporate planning, policy design, policy evaluation, supply chain management, public management, economic behaviour, healthcare modelling, and new product development (Steman, 2004; Morecroft, 2007; Rodrigues & Dharmaraj, 2006; Reddi & Moon, 2011; Mutingi, 2012). In light of its widespread applications, SD is a viable tool for modelling the dynamics of RET adoption.
3. System dynamics model development
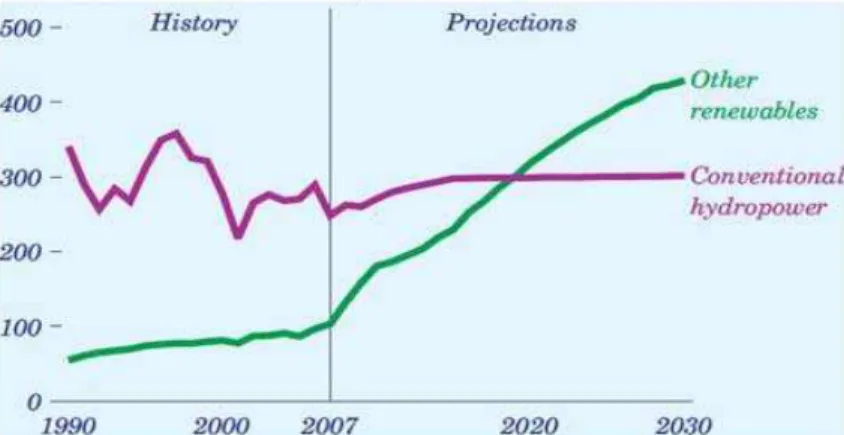
In general, technology adoption normally follows an s-shaped or sigmoid pattern (Rogers, 1995; Sterman, 2004; Morecroft, 2007). In the same vein, our hypothesis in this study is that the adoption of RET technologies follows an s-shaped growth pattern. Figure 1 shows an example of an s-shaped projection of the adoption of renewable electricity energy up to the year 2030 (GPO, 2009). In this connection, we make the following assumptions for the development of our SD model:
The total number of potential RET adopters is limited, which essentially assumes the phenomenon of market saturation (Bass, 1969);
The influence of word of mouth, promotional effort and training on adoption is significant and is therefore considered;
Adopters may, due to constraints and barriers and other inhibiting factors, discontinue the use of RET after the effective adoption of the technology.
Former adopters do not re-adopt the technology
phase where the adopter may decide to discontinue using the technology due to various possible constraints and barriers to RET usage. In the first place, a potential user normally requires substantial awareness and skills on the RET of interest, e.g., solar and wind energy. In accordance with the Bass model, two types of loops are involved, that is, the reinforcing positive loop and negative balancing loop. The reinforcing loop is mainly influenced by the word of mouth where adopters pressure potential adopters through word of mouth to adopt the current technology innovation. Early RET adopters come into contact with potential adopters, thereby exposing them to the current RETs. As some of the potential adopters get persuaded to take up the technology, the number of RET adopters increase, which leads to greater exponential take-up through word of mouth. The negative balancing loop arises mainly due to market saturation since the total number of potential RET adopters is limited to the existing total market. In this regard, the more the adopters, the less the potential adopters in the market place.
The takeup rate arises from both word of mouth and promotional efforts done by RET providers,
governments and interested stakeholders. In the real world, it takes a great deal of time and effort for an adopter to be well acquainted with the use of RETs. In this respect, teaching, training, and other support services are critical, if the termination rate is to be reduced substantially.
Fig. 2 illustrates the process of RET adoption, from a system dynamics view point. The model comprises four stock variables, namely: Potential_Adopters, Semi_Adopters, Adopters, and
Former_Adpopters. The four stocks are briefly described as follows;
Potential_Adopters: individuals who may adopt the RETs;
Semi_Adopters: individuals who initially take up RETs;
Adopters: individuals decisively taking up RET;
Former_Adopter: individuals who discontinue using the RETs after some period of usage and
will not adopt the technology in the foreseeable future.
Fig. 2. System dynamics model for RET adoption (modified from Chen, 2011) Semi
Adopters Adopters
Potential Adopters
Former Adopters termination f raction
promotion takeup
takeup rate adoption rate
learning time
termination rate
teaching productiv ity usage period
takeup delay contact f requency
promotion ef f ect
total market
adoption delay adoption f raction
WOM takeup
+
+
+ + +
-+ +
+ +
+
+
-+
-M. Mutingi / Decision Science Letters 2 (2013)
113
The above four stocks are influenced by their inflow and outflow rates along the ageing chain, from RET take-up down to the final termination of RET usage. The net flow variables are described as follows;
takeup: the rate at which potential adopters primarily take up the RET.
adoption: the rate at which the semi adopters finally adopt the RET.
termination: the rate at which adopters decisively quit using RET due to various constraints and
barriers to continued use of RETs.
In the next section, we present the illustrative simulation experiments, results and the relevant discussions.
4. Simulation experiments
Three sets of simulation experiments were conducted in this study. First, the base simulation experiments were carried out based on assumed initial simulation parameters. The initial potential adopters were set to 100 (which is assumed to be 100%). The initial stocks of semi adopters, adopters and former adopters were set at 0. Second, sensitivity analyses were conducted to test the behaviour of the model under parameter variations. Third, further “what-if” experiments were carried out under various scenarios. The simulation run was set to 20 years. The results of the simulation study are presented.
5. Results and discussions
5.1. Base simulation results
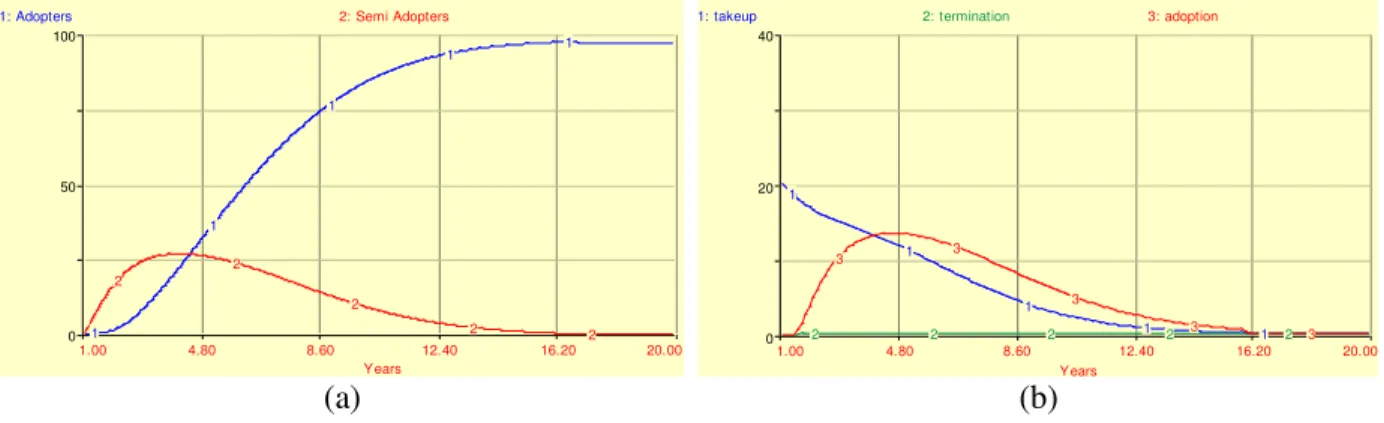
Fig. 3 shows the basic simulated behaviour of the RET adoption process. As can be seen from the figure, the number of RET adopters grows exponentially at the beginning of the planning horizon. This is attributed to the influence of the dominant positive loop, especially for periods less than 7 years. However, the dominance of the positive loop diminishes over time. As the negative loop gains dominance over the positive loop over the simulation time, the exponential growth reduces to an asymptotic growth. This phenomenon corresponds to the change of dominance from positive feedback to the balancing negative feedback. Finally, the growth of the RET adoption plateaus at the saturation point, at 100%
(a) (b)
Fig. 3. Basic simulated behaviour of RET adoption
5.2. Sensitivity analysis
The aim of sensitivity analyses tests is to examine the impact of input parameter variations on the output behaviour. This assists the decision maker to examine the robustness of the model while
1.00 4.80 8.60 12.40 16.20 20.00
Y ears
0 50 100
1: Adopters 2: Semi Adopters
1
1
1
1 1
2
2
2
2 2
1.00 4.80 8.60 12.40 16.20 20.00
Y ears
0 20 40
1: takeup 2: termination 3: adoption
1
1
1
1 1
2 2 2 2 2
3 3
3
effects of policy parameter changes can be investigated.
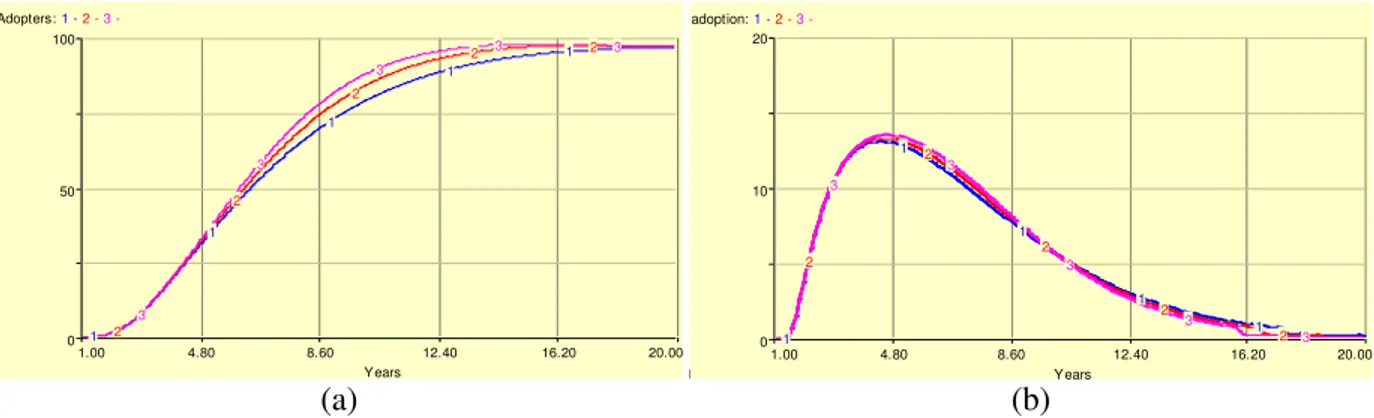
In the first set of sensitivity experiments, the adoption fraction is increased from 0.3 to 0.5 in steps of 0.1. Figure 4 (a) and (b) illustrate the sensitivity analysis behaviour based on the variation of the adoption fraction. Curves 1, 2 and 3 correspond to adoption fraction 0.3, 0.4, and 0.5, respectively. In general, the adoption process increases with increasing values of adoption fraction.
(a) (b)
Fig. 4. Sensitivity analysis behaviour based on adoption fraction
In the second set of sensitivity analysis experiments, promotion was varied from 0.2 to 0.6 in steps of 0.2. Figure 5 (a) and (b) provide the results of the simulation. Curves 1, 2, and 3 reflect the output behaviour for promotion values 0.2, 0.4, and 0.6, respectively. As shown by the comparative analysis from curves 1, 2 and 3, promotion in form of rigorous awareness campaigns and regulations has a significant positive effect on the adoption rate of renewable energy technologies, however, with a limiting behaviour. This is phenomena agrees with the law of diminishing returns. Further sensitivity analysis experiments can be carried in a similar manner, based on other variables of interest.
(a) (b)
Fig. 5. Sensitivity analysis behaviour based on promotional effort
5.3. Further “what-if” analyses
For further “what-if” experiments, scenarios where generated by making varying the values of termination fraction and adoption delay. Table 1 provides the combinations of low and high values termination and adoption that were used for the scenario-based experiments.
2
1.00 4.80 8.60 12.40 16.20 20.00
Y ears 0
50 100 Adopters: 1 - 2 - 3 -
1 1 1 1 1 2 2 2 2 2 3 3 3 3 3 1
1.00 4.80 8.60 12.40 16.20 20.00
Y ears 0
10 20 adoption: 1 - 2 - 3 -
1 1 1 1 1 2 2 2 2 2 3 3 3 3 3 2
1.00 4.80 8.60 12.40 16.20 20.00
Y ears 0
50 100 Adopters: 1 - 2 - 3 -
1 1 1 1 1 2 2
2 2 2
3
3
3 3 3
1.00 4.80 8.60 12.40 16.20 20.00
Y ears 0
15 30 adoption: 1 - 2 - 3 -
1 1 1 1 1 2 2 2 2 2 3 3
M. Mutingi / Decision Science Letters 2 (2013)
115
Table 1
Scenarios for “what-if” experiments
No. Parameters
Termination fraction Adoption delay
1 0.01 (low) 0.5 (low)
2 0.01 1.0 (high)
3 0.10 (high) 1.0
4 0.10 0.5
Fig. 6 (a) and (b) show the comparative behaviour of the system under scenarios 1 to 4. The comparative results are further explained as follows:
5.3.1. Low termination fraction and low adoption delay
Curve 1 depicts the graphical results for scenario 1. When both termination fraction and adoption delay values are set to low, the adoption process is as good as the base simulation results. Only about 98% adoption is eventually achieved. However, the rate of adoption is slightly lower when compared to scenario 2. With low termination fraction, Curve 1 experience minimal decline till the end of the planning period.
(a) (b)
Fig. 6. Output behaviour for the scenario-based experiments
5.3.2. Low termination fraction and high adoption delay
Curve 2 illustrates the behaviour of the system under scenario 2. With a higher value of adoption delay, the number of adopters is slightly higher than in scenario 1, specifically within the time interval 7.5 to 16.5 years. It can be seen that the number of adopters are much higher than for scenarios 3 and 4, regardless of the significant change of adoption delay.
5.3.3. High termination fraction and high adoption delay
Curve 3 depicts the behaviour of the system under scenario 3 conditions. By changing the termination fraction to high, the number of adopters reduced significantly, with continued depletion of adopters even after the peak period. The adoption rate is slower at the beginning of the period, and the peak period is shifted slightly to the right.
5.3.4. High termination fraction and low adoption delay
Curve 4 shows the output behaviour based on scenario 4, where the adoption delay is reduced to low value. Apparently, there is no significant change due to change of the adoption delay parameter. Decline is apparently high at later stages due to high termination rate.
1.00 4.80 8.60 12.40 16.20 20.00
Y ears 0
50 100
Adopters: 1 - 2 - 3 - 4 -
1
1
1
1 1
2
2
2
2 2
3
3
3 3 3
4
4
4 4
4
1.00 4.80 8.60 12.40 16.20 20.00
Y ears 0
15 30 adoption: 1 - 2 - 3 - 4 -
1
1
1
1
1
2
2
2
2
2
3
3
3
3
3
4
4
4
4
possible impact on the behaviour of the technology adoption process. It is observed that, in the long run, the most significant parameter is the termination fraction, which is a function of constraints, obstacles and barriers to the RET adoption process. This demonstrates the fact that the factors related to the barriers and constraints to RET adoption should be dealt with, most importantly at the later stages of the adoption process.
6. Conclusions
The adoption of renewable energy technologies is essential all over the globe. However, the adoption process has been slow due to complex interactive dynamics, delays, constraints and barriers.
6.1. Contributions to theory
This study suggested the use of systems thinking and system dynamics methodologies for modelling the dynamics of the adoption of renewable energy technologies. By defining the model in terms of input policy parameters such as promotional effort, training, and other structural parameters such as adoption fraction and contact frequency, the model is able to investigate the behaviour of the adoption system in terms adoption rate, number of actual adopters and semi-adopters. The model is a useful tool for carrying sensitivity analyses and for answering “what-if” questions in an interactive manner. Thus, the model is a useful tool for policy makers when formulating medium- to long-term strategies in regards to renewable energy technologies.
6. 2. Managerial implications
A number of useful practical insights can be drawn from this simulation study. Overall, it can be seen that the adoption process is negatively influence by termination fraction and the adoption delay, together with other delays in the system. Conversely, the adoption process is positively influenced by the adoption fraction, contact frequency, promotion intensity, training or teaching productivity. Drawing from these facts the following managerial insights are essential for policy makers in renewable energy:
Considerable promotional effort is highly essential as it is the major driver of renewable energy technology throughout its adoption process;
Extensive campaigns, advertisements and other promotional initiatives are necessary;
Training and teaching initiatives are also crucial to add to the promotional intensity in order to further enhance adoption;
Though word of mouth is not a major adoption driver, it complements promotion and teaching and training efforts;
To improve the renewable energy adoption process, barriers and constraints to the adoption process should be reduced, e.g., by reducing RET-related costs.
Financial aid and related support services are crucial for speeding up the RET adoption process.
Based on these insights, decision makers can pave the way forward in renewable energy policy formulation and evaluation.
6.3. Further research
M. Mutingi / Decision Science Letters 2 (2013)
117
Another further research direction is the application of simulation optimization techniques in order to further determine the optimal policy parameters, such as teaching or training intensity as well as promotional intensity. Coupled with model calibration, the overall model can be used as a flight simulator for informed decision making in the design of renewable energy policies. Therefore, the system dynamics approach is a viable option for in-depth understanding and designing of policies for renewable energy adoption.
References
Bass, F. (1969). A new product growth model for consumer durables. Management Science, 15 (5), 215-227.
Beck, F. & Martinot, E. (2004). Renewable energy policies and barriers. Encyclopaedia of Energy, Cutler J. Cleveland, ed., Academic Press/Elsevier Science.
Chandrasekara, B., & Tara, C.K. (2007). An opinion survey based assessment of renewable energy technology development in India. Renew Sustain Energy Reviews, 11, 688–701.
Chen, Y. (2011). Understanding Technology Adoption through System Dynamics Approach: A Case Study of IT Technology. Ninth IEEE/IFIP International Conference on Embedded and
Ubiquitous Computing, 366-371.
E. Rogers. (1995). Diffusion of innovation. New York: Free Press.
Ernest, F.B., & Matthew, A.B. (2009). Feasibility of solar technology (photovoltaic) adoption- a case study on Tennessee’s poultry industry. Renewable Energy, 34, 748–54.
Forrester, J. (1961). Industrial dynamics. Waltham, MA: Pegasus Communications.
GPO. (2009). Annual Energy Outlook, with Projects to 2030. USA Government Printing Office, 2009.
Huang. L.M. (2009). Financing rural renewable energy: a comparison between China and India.
Renewable and Sustainable Energy Reviews, 13 (5), 1096-1103.
John, B., Bo, S, & William. W. (1998). The economics of sustainable energy for rural development: a study of renewable energy in rural China. Energy Policy, 26, 45–54.
Krushna, M, & Leif G. (2008). An adopter-centric approach to analyze the diffusion patterns of innovative residential heating systems in Sweden. Energy Policy, 36, 577–579.
Li, J.F., Zhu, L., & Hu, R.Q. (2009). Policy analysis of the barriers to renewable energy development in the People’s Republic of China. Energy for Sustainable Development, 6, 11–20.
Maria, F.S.R.A., Sammy, Z., & Gabriela, B. (2010). On the adoption of electricity as a domestic source by Mozambican households. Energy Policy, 38, 7235–49.
Morecroft, J.D.W. (2007). Strategic Modelling and Business Dynamics: A Feedback Systems
Approach. John Wiley & Sons, Chichester.
Mutingi, M. (2012). Dynamic simulation for effective workforce management in new product development. Management Science Letters, 2, 2571-2580.
Peter, W. (2010). Biogas production: current state and perspectives. Applied Microbiology and
Biotechnology, 85, 849–60.
Painuly, J.P. (2001). Barriers to renewable energy penetration: A framework for analysis. Renewable
Energy, 24 (10), 73–89
Raja, P., Laurence, D., & Vasanthi M.P. (2006). Adoption of photovoltaic power supply systems: a study of key determinants in India. Renewable Energy, 31, 2272–83.
Reddi, K.R. & Moon, Y.B. (2011). System dynamics modelling of engineering change management in a collaborative environment. International Journal of Advanced Manufacturing Technology, 55, 1255-1239.
Rodrigues, L.L.R. & Dharmaraj, N. (2006). System dynamics approach for change management in new product development. Management Research News, 29 (8), 512-523
non-adoption of passive solar housing in the US. Energy Policy, 36, 551–66.
Zhu, B., Zhang, W., Du, J., Zhou, W., Qiu, T., & Li, Q. (2011). Adoption of renewable energy technologies (RETs): A survey on rural construction in China. Technology in Society, 33, 223–230
Appendix A
Parameter definitions:
total_market: the total individuals who could become RET adopters.
adoption_fraction: the probability that an individual is willing to adopt RET as a result of word of
mouth.
contact_frequency: the number of individuals contacted each year for each individual.
promotion_effect: the probability that an individual will take up the RET each year as a result of
promotion effort.
takeup_delay: the average time taken by a potential adopter to take-up the current technology.
teaching_productivity: the rate of adopters generated from semi-adopters per teaching effort
learning_time: the average time taken by a semi-adopter to finally adopt and use the RET.
termination_fraction: the probability that an adopter will discontinue to use the RET after the usage
period.
usage_period: the average time an adopter will use the technology.
adoption_delay: the average time it takes for a semi-adopter to adopt the technology.