J. Evid. Based Med. Healthc., pISSN- 2349-2562, eISSN- 2349-2570/ Vol. 3/Issue 83/Oct. 17, 2016 Page 4491
UMBILICAL COILING INDEX AS A MARKER OF PERINATAL OUTCOME
Beenakumari R1, Ramya M2, Kunjamma M. A3
1Associate Professor, Department of Obstetrics and Gynaecology, Government Medical College, Kottayam, Kerala. 2Junior Resident, Department of Obstetrics and Gynaecology, Government Medical College, Kottayam, Kerala. 3Professor and HOD, Department of Obstetrics and Gynaecology, Government Medical College, Kottayam, Kerala.
ABSTRACT
BACKGROUND
Umbilical cord is the lifeline of the foetus, which contains three vessels in a coiled fashion. Total number of coils divided by umbilical cord length centimetres is called Umbilical Coiling Index (UCI). Abnormal umbilical coiling index has been related to adverse perinatal outcome.
MATERIALS AND METHODS Sample Size 600.
Singleton live cephalic deliveries after 37 weeks both vaginal and caesarean section were included. Immediately after delivery, umbilical cord is clamped at 5 cm from the foetal end and cut. Length of cord is measured. No. of coils measured as one complete 360° spiral course of vessels.
At the end, mean umbilical coiling index is calculated. Normocoiled group was having UCI values between 10th and 90th percentile, hypocoiled group was having <10th percentile and hypercoiled group was having UCI >90th percentile. Outcomes measured were maternal age, meconium-stained amniotic fluid, foetal growth restriction, 5 mins. APGAR scores, neonatal intensive care unit admissions and hypoglycaemia. Statistical analysis was performed using SPSS software and chi-square test. P value of <0.05 was regarded as statistically significant.
SETTINGS AND DESIGN- Descriptive study conducted from January 2014 to June 2014 in Dept. of Obstetrics and Gynaecology, Govt. Medical College, Kottayam.
RESULTS
The mean UCI is 0.23±0.11/cm. With a minimum of 0.02/cm and maximum of 0.6/cm. UCI of hypocoiled group was <0.08 and that of hypercoiled group was >0.3. Out of 600 subject, 485 (80.8%) had normocoiling, 58 (9.7%) had hypocoiling and 57 (9.5%) had hypercoiling. 23 (40%) subjects with hypocoiling had foetal growth restriction (P value <0.05 significant) 2 large for gestational age (4%) babies had hypercoiling (P value <0.05). In the hypocoiled group, 22 (38%) had meconium-stained amniotic fluid, which was significant. There was significant association between hypocoiling and low normal amniotic fluid index, oligohydramnios, low 5’ APGAR scores and neonatal intensive care unit admission. 15 (26%) babies had hypoglycaemia in the hypocoiled group while only 7 (12%) in hypercoiled group had hypoglycaemia (P value <0.005).
KEYWORDS
(MeSH): Umbilical Cord, Foetal Growth Restriction, Oligohydramnios, Hypoglycaemia.
HOW TO CITE THIS ARTICLE: Beenakumari R, Ramya M, Kunjamma MA.Umbilical coiling index as a marker of perinatal
outcome. J. Evid. Based Med. Healthc. 2016; 3(83), 4491-4495. DOI: 10.18410/jebmh/2016/953
BACKGROUND
The umbilical cord is a physiological conduit between developing foetus and placenta providing nutrients and oxygen necessary for life in utero. It has two arteries and one vein, an outer amnion and Wharton’s jelly.1
The umbilical cord develops from yolk sac and allantois. It forms by 5th week of development.2 The umbilical cord in a full-term neonate is about 50 cm long and 2 cms. in diameter.3 The integrity of umbilical cord vessels is maintained by two principal factors - spiral coiling and
Wharton’s jelly. It is the spiraling of vessels, which is thought
to provide stability against buckling or compression.4,5 The mechanism by which physiological coiling occurs still remain uncertain. It may be related to early foetal activity and haemodynamic factors.6 In recent years, there has been increasing interest in cord coiling. The difference in coiling was described as an antenatal marker identifying foetus at risk.
Financial or Other, Competing Interest: None. Submission 31-08-2016, Peer Review 10-09-2016, Acceptance 01-10-2016, Published 15-10-2016. Corresponding Author:
Dr. Beenakumari R,
J. Evid. Based Med. Healthc., pISSN- 2349-2562, eISSN- 2349-2570/ Vol. 3/Issue 83/Oct. 17, 2016 Page 4492 However, majority of pregnancies with overcoiled or
undercoiled umbilical cords have a normal outcome. The question arises as to whether there are simply associations with no clinical significance or whether the cord coiling pattern can lead directly to adverse pregnancy outcomes.6
Aim of Study
To determine association of umbilical coiling index measured postnatally with adverse perinatal outcome.
MATERIALS AND METHODS
The study included 600 patients attending labour room in Dept. of OBG, Govt. Medical College, Kottayam, from January 2014 to June 2014. Singleton live, cephalic deliveries after 37 weeks both vaginal or caesarean section were included. Immediately after delivery, the umbilical cord is clamped at the foetal end cut with scissors taking care not to milk the cord. Cord is cut 5 cm from foetal insertion. The rest of cord up to placental insertion is measured in centimetres and 5 cm is added to it. A coil is taken as one complete 360° spiral coarse of umbilical vessels. The number of coils of the entire core is counted and Umbilical Coiling Index (UCI) is calculated as follows.
At the end of sample collection, mean UCI is calculated. On the basis of the latter, they are grouped as normocoiled group (UCI values between 10th and 90th percentile of mean), hypocoiled group (UCI values <10th percentile), hypercoiled group (>90th percentile). All foetuses included in the study was observed and followed up to measure outcome variables. Outcomes measured were maternal age and parity, meconium-stained amniotic fluid, foetal growth
restriction, low 5’ mins. APGAR scores, low normal amniotic
fluid index and oligohydramnios, neonatal intensive care unit admissions and hypoglycaemia. Ethical committee clearance from Govt. Medical College, Kottayam, was obtained. Statistical analyses was performed using SPSS Software (version 10.0, SPSS, Inc. Chicago, IL). Statistical significance of values were analysed using chi-square test. P value of <0.05 was regarded as statistically significant.
RESULTS
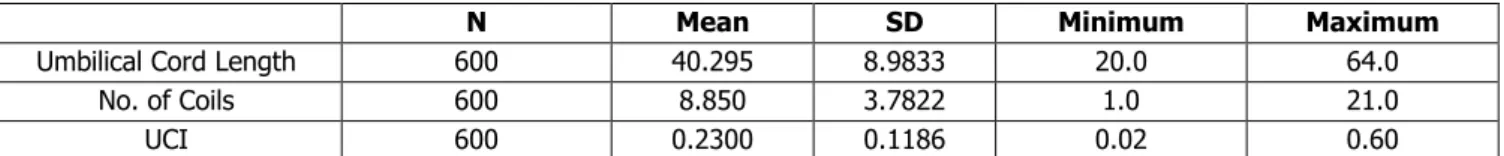
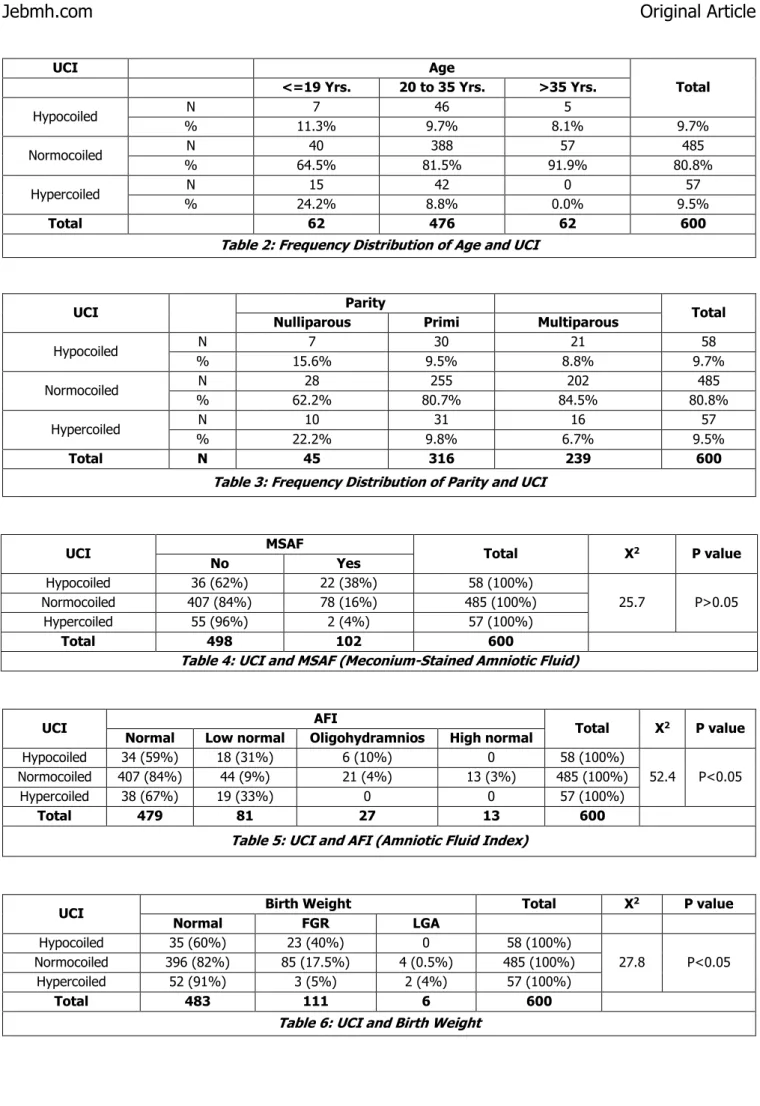
The mean umbilical cord length in the present study including 600 subjects was 40.29±8.9 cm, minimum length being 20 cm and maximum 64 cm. Mean no. of coils were 8.85±3.78 with minimum number of coils being 1 and maximum being 21. The mean UCI in the present study is 0.23±0.11/cm with minimum of 0.02/cm and maximum of 0.6/cm (Table 1). The UCI of hypocoiled group that is lower than 10th percentile was <0.08. UCI of hypercoiled group that in more than 90th percentile was >0.3. Out of 600 subjects, 485 (80.8%) were having normocoiling, 58 (9.7%) were having hypocoiling and 57 (9.5%) were having hypercoiling (Table 2). In all age groups, majority were having normocoiling.
A decreasing trend of hypocoiling and hypercoiling was observed with advancing age (Table 2). Similarly, it was observed that both hypo and hypercoiling decreases as parity advances (Table 3). Meconium-Stained Amniotic Fluid (MSAF) was observed in 22 patients (38%) of hypocoiled group, which was found to be statistically significant. Meconium-stained amniotic fluid was observed to be decreasing with increasing UCI (Tables 4). 31% of hypocoiled group and 33% of hypercoiled group had low normal Amniotic Fluid Index (AFI). In both hypocoiled and hypercoiled group, there was significant association between low normal AFI and oligohydramnios (Table 5). None of the patients in this group had high normal AFI. Hence, a decreasing trend of oligohydramnios was observed with increasing UCI. 40% of subjects in the hypocoiling group had Foetal Growth Restriction (FGR), while only 5% of hypercoiling group had FGR. This association was found to be statistically significant (P value<0.05) Hypercoiling and LGA (Large for gestational age) also had significant association (Table 6).
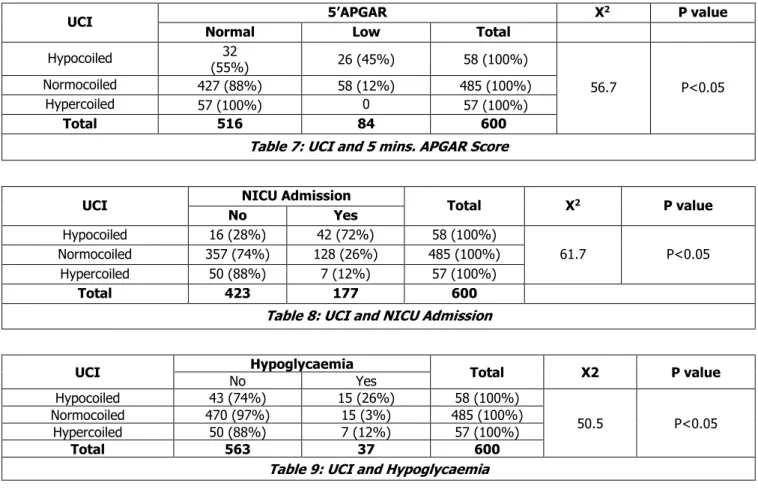
Out of 58 subjects in hypocoiled group 26 (45%) had low APGAR scores, which was found to be statistically significant (P value <0.05). None of the babies in hypercoiled group had low APGAR scores (Table 7). So, also there was significant association between NICU admission and hypocoiling. 72% of babies in the hypocoiled group required NICU admission (Table 8). 15 out of 58 babies (26%) in the hypocoiled group had hypoglycaemia in the immediate neonatal period, which was found to be significant only 3% of babies in normocoiled group had hypoglycaemia (Table 9).
N Mean SD Minimum Maximum
Umbilical Cord Length 600 40.295 8.9833 20.0 64.0
No. of Coils 600 8.850 3.7822 1.0 21.0
UCI 600 0.2300 0.1186 0.02 0.60
J. Evid. Based Med. Healthc., pISSN- 2349-2562, eISSN- 2349-2570/ Vol. 3/Issue 83/Oct. 17, 2016 Page 4493
UCI Age
Total
<=19 Yrs. 20 to 35 Yrs. >35 Yrs.
Hypocoiled N 7 46 5
% 11.3% 9.7% 8.1% 9.7%
Normocoiled N 40 388 57 485
% 64.5% 81.5% 91.9% 80.8%
Hypercoiled N 15 42 0 57
% 24.2% 8.8% 0.0% 9.5%
Total 62 476 62 600
Table 2: Frequency Distribution of Age and UCI
UCI Parity Total
Nulliparous Primi Multiparous
Hypocoiled N 7 30 21 58
% 15.6% 9.5% 8.8% 9.7%
Normocoiled N 28 255 202 485
% 62.2% 80.7% 84.5% 80.8%
Hypercoiled N 10 31 16 57
% 22.2% 9.8% 6.7% 9.5%
Total N 45 316 239 600
Table 3: Frequency Distribution of Parity and UCI
UCI MSAF Total X2 P value
No Yes
Hypocoiled 36 (62%) 22 (38%) 58 (100%)
25.7 P>0.05
Normocoiled 407 (84%) 78 (16%) 485 (100%)
Hypercoiled 55 (96%) 2 (4%) 57 (100%)
Total 498 102 600
Table 4: UCI and MSAF (Meconium-Stained Amniotic Fluid)
UCI AFI Total X2 P value
Normal Low normal Oligohydramnios High normal
Hypocoiled 34 (59%) 18 (31%) 6 (10%) 0 58 (100%)
52.4 P<0.05
Normocoiled 407 (84%) 44 (9%) 21 (4%) 13 (3%) 485 (100%)
Hypercoiled 38 (67%) 19 (33%) 0 0 57 (100%)
Total 479 81 27 13 600
Table 5: UCI and AFI (Amniotic Fluid Index)
UCI Birth Weight Total X
2 P value
Normal FGR LGA
Hypocoiled 35 (60%) 23 (40%) 0 58 (100%)
27.8 P<0.05
Normocoiled 396 (82%) 85 (17.5%) 4 (0.5%) 485 (100%)
Hypercoiled 52 (91%) 3 (5%) 2 (4%) 57 (100%)
Total 483 111 6 600
J. Evid. Based Med. Healthc., pISSN- 2349-2562, eISSN- 2349-2570/ Vol. 3/Issue 83/Oct. 17, 2016 Page 4494
UCI 5’APGAR X
2 P value
Normal Low Total
Hypocoiled 32
(55%) 26 (45%) 58 (100%)
56.7 P<0.05
Normocoiled 427 (88%) 58 (12%) 485 (100%)
Hypercoiled 57 (100%) 0 57 (100%)
Total 516 84 600
Table 7: UCI and 5 mins. APGAR Score
UCI NICU Admission Total X2 P value
No Yes
Hypocoiled 16 (28%) 42 (72%) 58 (100%)
61.7 P<0.05
Normocoiled 357 (74%) 128 (26%) 485 (100%)
Hypercoiled 50 (88%) 7 (12%) 57 (100%)
Total 423 177 600
Table 8: UCI and NICU Admission
UCI Hypoglycaemia Total X2 P value
No Yes
Hypocoiled 43 (74%) 15 (26%) 58 (100%)
50.5 P<0.05
Normocoiled 470 (97%) 15 (3%) 485 (100%)
Hypercoiled 50 (88%) 7 (12%) 57 (100%)
Total 563 37 600
Table 9: UCI and Hypoglycaemia
DISCUSSION
The current study was conducted to find out the relationship between Umbilical Coiling Index (UCI) and various perinatal factors in normal and complicated pregnancies. We observed that 10th and 90th percentiles for UCI (<0.08 and >0.3) was in agreement with previous studies done by Chitra et al7 (10th and 90th percentile <0.09 and >0.36) Gupta et al8 (10th and 90th percentile <0.1 and >0.3) and Kashanian et al9 (10th and 90th percentile <0.08 and >0.4). The mean UCI in our study was 0.23±0.11, which was similar in study by Chitra et al7 in 2012. In present study, low normal AFI and oligohydramnios had significant association with both hypo and hypercoiling of umbilical cord. This can be explained by Edmond’s hypothesis10 that twists of umbilical cord is a result of rotary movement imparted by embryo, hence less liquor, less amount of coiling. Meconium staining has significant association with hypocoiling.
Mechanism could be undercoiled cords are more susceptible to acute kinking and therefore marked cessation of blood flow. The flow dynamic studies suggest that flow though coiled tube is associated with greater resistance to flow than straight tube.Foetal growth restriction and low Apgar scores were found to be significantly associated with hypocoiled group in our study, which was shown in earlier studies too (Strong et al11 and Machin et al4). This disagreed with other studies who found a consistent association with FGR and hypercoiling (Rana et al).12 Significant association of hypocoiling and neonatal intensive care unit admission
could be due to low 5’ Apgar Scores, meconium-stained
amniotic fluid and foetal growth restriction.
The helical course of umbilical vessels is established by 9 weeks. Reynolds et al13 postulated that the umbilical cord is a pistonless pulsometer pumping system acting as a cardiac assist pump to sustain venous return from placenta. The foetal blood is pumped through the umbilical vein by slight, but definite variations in venous pressure, which is generated from the force of arterial pressure pulse. Hence, the presence of vascular coils plays a central role in determining the blood flow from the placenta to the foetus. This mechanism is of utmost importance when placental resistance is particularly elevated. Therefore, a reduced number of coils could be responsible for reduced umbilical flow, which in turn leads to foetal growth impairment.
J. Evid. Based Med. Healthc., pISSN- 2349-2562, eISSN- 2349-2570/ Vol. 3/Issue 83/Oct. 17, 2016 Page 4495 Mladen et al16 assessed umbilical coiling index
antenatally in second trimester with ultrasonography. On follow up, they found that abnormal umbilical coiling index was associated with higher rate of preterm labour, low birth weight babies and neonatal intensive care unit admissions.
CONCLUSION
Abnormal umbilical coiling index is associated with adverse perinatal outcome such as foetal growth restriction, meconium stained amniotic fluid, oligohydramnios, low APGAR scores, hypoglycemia and NICU admissions. Alterations in morphology and ultrastructure of umbilical cord components can hence affect fetoplacental dynamics leading to adverse perinatal outcome.
REFERENCES
1. Ferguson VL, Dodson RB. Bioengineering aspects of the umbilical cord. European Journal of Obstetrics
and Gynecology, Reproductive Biology
2009;144(Suppl 1):SI08-113.
2. Meyer WW, Rumpelt HJ, Yao AC, et al. Structure and closure mechanism of the human umbilical artery. Eur J Pediatr 1978;128(4):247-259.
3. Kiserud T, Acharya G. The fetal circulation. Prenatal Diagnosis 2004;24(13):1049-1059.
4. Machin GA, Ackerman J, Gilbert-Barness E, et al. Abnormal umbilical cord coiling is associated with adverse perinatal outcomes. Pediatr Dev Pathol 2000;3(5):462-471.
5. Strong TH, Jarles DL, Vega JS, et al. The umbilical coiling index. American Journal of Obstetrics and Gynecology 1994;170(1):29-32.
6. De Laat MW, Nikkels PG, Franx A, Visser GH. The Roach muscle bundle and umbilical cord coiling. Early Human Development 2007; 83: 571-574.
7. Chitra T, Sushanth YS, Raghavan S. Umbilical coiling index as a marker of perinatal outcome: an analytical study. International Journal of Obstetrics and Gynaecology 2012;2012:88-94.
8. Gupta S, Faridi MMA, Krishnan J. Umbilical coiling index. Journal of Obstetrics and Gynaecology of India 2006;56(4):315-319.
9. Kashanian M, Akbarian A, Kouhpayehzadeh J. The umbilical coiling index and adverse perinatal outcome. Int J Gynaecol Obstet 2006;95(1):8-13.
10. Edmonds HW. The spiral twist of the normal umbilical cord in twins and in singletons. American Journal of Obstetrics and Gynaecology 1954;67(1):102-120. 11. Strong TH, Elliott JP, Radin TG. Non-coiled umbilical
blood vessels: a new marker for the foetus at risk. Obstetrics and Gynecology 1993;81(3):409-411. 12. Rana J, Ebert GA, Kappy KA. Adverse perinatal
outcome in patients with an abnormal umbilical coiling index. Obstet Gynecol 1995;85(4):573-577. 13. Reynolds SRM. Mechanisms of placentofetal blood
flow. Ostet Gynecology 1978;51(2):245-249.
14. van Diik CC, Franx A, de Laat MW, et al. The umbilical coiling index in normal pregnancy. J Matern Fetal Neonatal Med 2002;11(4):280-283.
15. Di Naro E, Ghezzi F, Raio L, et al. Umbilical vein blood flow in foetuses with normal and lean umbilical cord. Ultrasound Obstet Gynecol 2001;17(3):224-228. 16. Predanic M, Perni SC, Chasen ST, et al. Assessment