Umbilical Cord Blood Gas Analysis, Obstetric
Performance and Perinatal Outcome
Gasometria do cordão umbilical, atuação obstétrica e
desfecho neonatal
Cátia So
fi
a Ferreira
1Ângela Melo
1Ana Helena Fachada
1Helena Solheiro
1Nuno Nogueira Martins
11Department of Obstetrics and Gynecology, Centro Hospitalar Tondela-Viseu, Viseu, Portugal
Rev Bras Ginecol Obstet 2018;40:740–748.
Address for correspondence Cátia Sofia Ferreira, MD, Serviço de Ginecologia e Obstetrícia, Centro Hospitalar Tondela-Viseu, Avenida Rei D. Duarte, 3504-509, Viseu, Portugal
(e-mail: [email protected]).
Keywords
►
Umbilical Cord Blood
Gas Analysis
►
delivery
►
morbidity
►
neonatology
Abstract
Objective
To analyze if umbilical artery pH (pH
ua)
7.00 and umbilical artery
blood de
fi
cit (BD
ua)
12.00 mmol/L are good predictors of adverse neonatal
outcomes.
Methods
This was an observational, longitudinal and retrospective cohort study,
conducted at the department of obstetrics and gynecology of Centro Hospitalar
Tondela Viseu between September 2013 and September 2015. Total cohort and
subgroup analysis were performed: group A
—
women with umbilical cord blood gas
analysis (UCBGA) performed for non-reassuring fetal cardiotocographic patterns,
placental abruption, or shoulder dystocia; and group B
—
all the others. Assays were
made with the software SPSS for Windows, Versions 20.0 and 21.0 (IBM Corp., Armonk,
NY, USA).
Results
A total of 428 UCBGAs met the inclusion criteria. The group analysis revealed
an association between group A and pHua
7.00, as well as between BDua
12.00
mmol/L and 1st minute Apgar score
4 (
p
¼
0.011). After the application of the
logistic regression models in the total cohort analysis, pH
ua7.00 had an impact in the
occurrence of acute neonatal hypoxia (odds ratio [OR]: 6.71; 95% con
fi
dence interval
[CI]: 1.21
–
37.06;
p
¼
0.029); multiparous women had a higher risk of delivering a
newborn with
fi
rst minute Apgar score
4 and acute neonatal hypoxia (OR: 5.38; 95%
CI: 1.35
–
21.43;
p
¼
0.017; and OR: 2.66; 95% CI: 1.03
–
6.89,
p
¼
0.043, respectively);
women who had urologic problems during pregnancy had a higher risk of delivering a
newborn with 5th minute Apgar score
7 (OR: 15.17; 95% CI: 1.29
–
177.99;
p
¼
0.030); and shoulder dystocia represented a 15 times higher risk of acute neonatal
hypoxia (OR: 14.82; 95% CI: 2.20
–
99.60;
p
¼
0.006).
Conclusion
The pH
uaand the BD
uaare predictors of adverse neonatal outcome, and
UCBGA is a useful tool for screening newborns at risk. Universal UCBGA should be
considered for all deliveries, as it is an accurate screening test for neonatal hypoxia.
received
December 13, 2017 accepted
August 9, 2018 published online October 30, 2018
DOI https://doi.org/ 10.1055/s-0038-1675187. ISSN 0100-7203.
Copyright © 2018 by Thieme Revinter Publicações Ltda, Rio de Janeiro, Brazil
Introduction
Fetal and neonatal acidemia are associated with several ad-verse neonatal outcomes.1–7 These outcomes include low Apgar scores, respiratory distress syndrome (RDS), hypoxic-ischemic encephalopathy (HIE), seizures, intraventricular hemorrhage, sepsis, and death.1–7Determining the time of injury is essential to understand the mechanisms underlying these outcomes and can have important medico-legal impli-cations. The umbilical cord blood gas analysis (UCBGA) is an objective and validated tool to evaluate the oxygenation and metabolic status of the newborn at birth.1–6If the umbilical artery pH (pHua) is7.00 and the umbilical artery base deficit (BDua) is12.00 mmol/L, there is an established diagnosis of neonatal metabolic acidemia, and the risk of neurologic sequelae is higher in this setting.1–3,6,8Although the pH
uais a well-established marker of neonatal hypoxia, the BDuais not. The BDuais useful in distinguishing between respiratory and metabolic umbilical artery acidemia.1–6,9This distinction is important because respiratory acidosis is not usually associat-ed with complications for the newborn.10,11 Performing an UCBGA remains a good screening test for newborns at risk of poor neurologic outcome.4,12,13It can be recommended for all high-risk deliveries.4,12The Royal College of Obstetricians and
Gynaecologists recommends that an UCBGA should be per-formed in all cesarean or operative vaginal deliveries executed due to fetal compromise.12The American College of Obstetri-cians and Gynecologists states that an UCBGA should be performed after any delivery in which a fetal metabolic abnormality is suspected.13The main aim of the present study was to analyze whether pHua7.00 and BDua12.00 mmol/L were good predictors of adverse neonatal outcomes. The secondary aim of the present study was to determine if there was any association between these outcomes and other po-tential risk factors that could act as confounders.
Methods
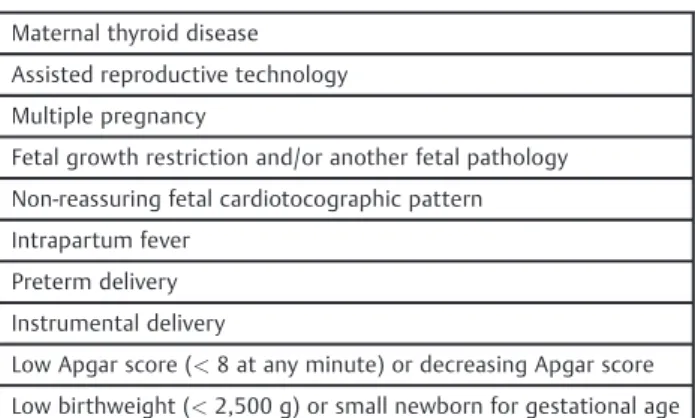
This was an observational, longitudinal and retrospective cohort study conducted between September 2013 and Sep-tember 2015, at the department of obstetrics and gynecology of Centro Hospitalar Tondela Viseu. All women who delivered in the labor ward and had a valid UCBGA according to the local protocol (►Table 1) were included.
All cases of multiple pregnancies, fetal growth restrictions, preeclampsia, intrapartum fever, preterm delivery, pelvic vaginal delivery, antenatal or postnatal diagnosis of cardiac malformations and low birthweight newborn were excluded
Resumo
Objetivo
Avaliar se o pH da artéria umbilical (pH
ua)
7,00 e o dé
fi
cit de bases da
artéria umbilical (BD
ua)
12,00 mmol/L são preditores de desfechos neonatais
adversos.
Métodos
Estudo observacional, longitudinal e retrospectivo, realizado no Serviço de
Ginecolocgia e Obstetrícia do Centro Hospitalar Tondela Viseu durante o período de
setembro de 2013 a setembro de 2015. Foi realizada a análise de toda a coorte e de dois
subgrupos: grupo A
—
mulheres cuja gasometria do cordão umbilical (UCBGA, na sigla
em inglês) foi realizada por traçado cardiotocográ
fi
co não tranquilizador,
descola-mento prematuro de placenta normalmente inserida, ou distócia de ombros; e grupo B
—
todas as outras. A análise estatística foi realizada com o programa SPSS for Windows,
Versões 20.0 e 21.0 (IBM Corp., Armonk, NY, USA)
Resultados
Um total de 428 UCBGAs cumpriram os critérios de inclusão. A análise de
grupo revelou uma associação entre o grupo A e pH
ua7,00 (
p
¼
0,002), e entre BD
ua12,00 mmol/L e índice de Apgar ao 1
ominuto
4 (
p
¼
0,011). Após a aplicação dos
modelos de regressão logística na análise da coorte total, pH
ua7.00 teve impacto na
ocorrência de hipóxia neonatal aguda (razão de probabilidade [RP]: 6,71; 95% índice de
con
fi
ança [IC]: 1,21
–
37,06;
p
¼
0,029); veri
fi
cou-se maior risco de recém-nascido com
índice de Apgar ao 1
ominuto
4 e hipóxia neonatal aguda nas multíparas (RP: 5,38;
95% IC: 1,35
–
21,.43;
p
¼
0,017; e RP: 2,66; 95% IC: 1,03
–
6,89;
p
¼
0,043,
respectiva-mente); e de recém-nascido com índice de Apgar ao quinto minuto
7 nas mulheres
com problemas urológicos na gravidez (RP: 15,17; 95% IC: 1,29
–
177,99;
p
¼
0,030); e
a ocorrência de distócia de ombros aumentou 15 vezes o risco de hipóxia neonatal
aguda (RP: 14,82; 95% IC: 2,20
–
99,60;
p
¼
0,006).
Conclusão
O pH
uae o BD
uasão preditores de desfecho neonatal adverso, e a UCBGA é
uma ferramenta útil no rastreio dos recém-nascidos em risco. A realização universal de
UCBGA deve ser considerada em todos os partos, visto ser um teste de rastreio objetivo
de hipóxia neonatal.
Palavras-chave
►
gasometria do cordão
umbilical
►
parto
►
morbilidade
(►Fig. 1). Valid samples had a difference of0.03 between pHuaand umbilical vein pH.
The total cohort data was analyzed. A subsequent group analysis was also done: group A, which included the UCBGA performed for non-reassuring fetal cardiotocography (CTG) patterns or placental abruption, and group B, which included all the remaining cases. The purpose of the group analysis was to check for a stronger association of pHua7.00 and BDua 12.00 mmol/L in group A and to find out if the predictive value of pHua7.00 and BDua 12.00 mmol/L for adverse neonatal outcomes was stronger in group A than
in group B. Data was collected through the review of elec-tronic and manuscript clinicalfiles.
In the UCBGA technique used, the cord was triple-clamped immediately after delivery with an in-between length of10 to 20 cm. The distal segment was then cut and placed over a table, where the blood samples were taken,first from the artery and then from the vein. Preheparinised syringes (Pro-Vent®, Smiths medical ASD, Inc., Keene, New Hampshire, USA) were used. The samples were analyzed within a maximum of 30 minutes at the hospital central laboratory, and the results were made elec-tronically available to the team immediately after.
Two neonatal outcome predictors were analyzed: pHua 7.00 and BDua12.00 mmol/L.
The adverse neonatal outcomes that were analyzed were:
1. First minute Apgar Score (1′AS)4; 2. Fifth minute Apgar Score (5′AS) 7;
3. Acute neonatal hypoxia (ANH)—condition in which the newborn has been exposed to intrapartum reversible asphyxia, without documented HIE;
4. Hypoxic-ischemic encephalopathy—disturbed neurologic function in the earliest days of life, manifested by a reduced level of consciousness or seizures, often accompanied by difficulty at initiating and maintaining respiration, and by depression of tone and reflexes, in a newborn with one or more of the following: (a) a sentinel hypoxic or ischemic event occurring immediately before or during labor and delivery; (b) pHua7.00 and/or BDua12.00 mmol/L; (c) presence of multisystem organ failure consistent with HIE; 5. Neonatal convulsion;
6. Hyaline membrane disease or respiratory distress syn-drome type I (RDS I);
7. Transient tachypnea of the newborn or respiratory dis-tress syndrome type II (RDS II);
8. Meconium aspiration syndrome—respiratory distress at or shortly after birth in the presence of evidence of meconium-stained amnioticfluid on infant and charac-teristic radiographic features (hyperinflation of the lungs withflattening of the diaphragm, diffuse patchy densities alternating with areas of expansion, pneumothorax, and pneumomediastinum);
9. Neonatal bradycardia;
10. Neonatal sepsis—a clinically ill newborn with isolation of pathogenic bacteria from blood culture or, in its absence, with laboratory test results consistent with infection (leu-kopenia or leukocytosis, immature to total neutrophil ratio>0.16; immature to mature neutrophil ratio>0.2; C-reactive protein>10–15 mg/L and/or procalcitonin>3 ng/mL); and after exclusion of other infectious causes.
The Analysis was performed using the software SPSS for Windows, Versions 20.0 and 21.0 (IBM Corp., Armonk, NY, USA). Maternal and newborn demographic data and the incidence of outcomes were compared between the groups with the chi-squared test and the Fisher exact test. The association between each outcome and the predictors was made through univariate analysis, calculating the odds ratio (OR) with a 95% confidence interval (CI). The Wald test was applied to the outcomes with a statistically Table 1 Indications for performing umbilical cord blood gas
analysis
Maternal thyroid disease Assisted reproductive technology Multiple pregnancy
Fetal growth restriction and/or another fetal pathology Non-reassuring fetal cardiotocographic pattern Intrapartum fever
Preterm delivery Instrumental delivery
Low Apgar score (<8 at any minute) or decreasing Apgar score
Low birthweight (<2,500 g) or small newborn for gestational age
705 UCBGA
56 one vessel sampled or incomplete results
649 both vessels sampled and complete gas results
557 Valid UCBGA
428 = Final cohort
92 difference between pHua and pHua <0.03
129 UCBGA excluded: • Multiple pregnancy • Fetal growth restriction • Preeclampsia
• Intrapartum fever • Preterm delivery • Pelvic vaginal delivery • Cardiac malformations • Low birthweight newborn (< 2500 g)
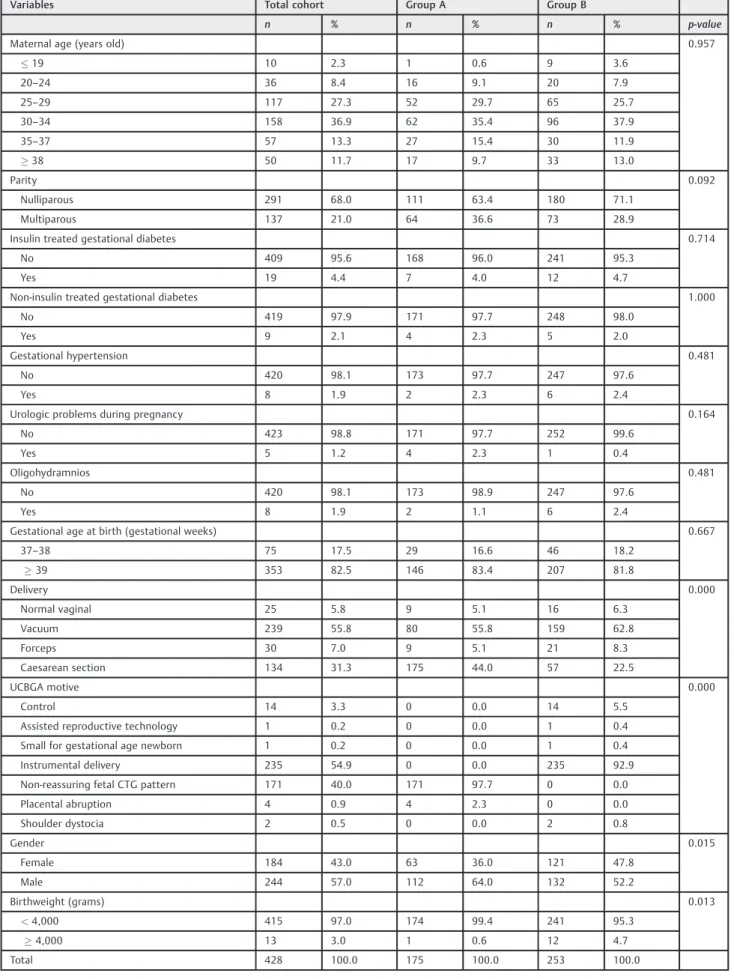
Table 2 Characteristics of the cohort
Variables Total cohort Group A Group B
n % n % n % p-value
Maternal age (years old) 0.957
19 10 2.3 1 0.6 9 3.6
20–24 36 8.4 16 9.1 20 7.9
25–29 117 27.3 52 29.7 65 25.7
30–34 158 36.9 62 35.4 96 37.9
35–37 57 13.3 27 15.4 30 11.9
38 50 11.7 17 9.7 33 13.0
Parity 0.092
Nulliparous 291 68.0 111 63.4 180 71.1
Multiparous 137 21.0 64 36.6 73 28.9
Insulin treated gestational diabetes 0.714
No 409 95.6 168 96.0 241 95.3
Yes 19 4.4 7 4.0 12 4.7
Non-insulin treated gestational diabetes 1.000
No 419 97.9 171 97.7 248 98.0
Yes 9 2.1 4 2.3 5 2.0
Gestational hypertension 0.481
No 420 98.1 173 97.7 247 97.6
Yes 8 1.9 2 2.3 6 2.4
Urologic problems during pregnancy 0.164
No 423 98.8 171 97.7 252 99.6
Yes 5 1.2 4 2.3 1 0.4
Oligohydramnios 0.481
No 420 98.1 173 98.9 247 97.6
Yes 8 1.9 2 1.1 6 2.4
Gestational age at birth (gestational weeks) 0.667
37–38 75 17.5 29 16.6 46 18.2
39 353 82.5 146 83.4 207 81.8
Delivery 0.000
Normal vaginal 25 5.8 9 5.1 16 6.3
Vacuum 239 55.8 80 55.8 159 62.8
Forceps 30 7.0 9 5.1 21 8.3
Caesarean section 134 31.3 175 44.0 57 22.5
UCBGA motive 0.000
Control 14 3.3 0 0.0 14 5.5
Assisted reproductive technology 1 0.2 0 0.0 1 0.4
Small for gestational age newborn 1 0.2 0 0.0 1 0.4
Instrumental delivery 235 54.9 0 0.0 235 92.9
Non-reassuring fetal CTG pattern 171 40.0 171 97.7 0 0.0
Placental abruption 4 0.9 4 2.3 0 0.0
Shoulder dystocia 2 0.5 0 0.0 2 0.8
Gender 0.015
Female 184 43.0 63 36.0 121 47.8
Male 244 57.0 112 64.0 132 52.2
Birthweight (grams) 0.013
<4,000 415 97.0 174 99.4 241 95.3
4,000 13 3.0 1 0.6 12 4.7
Total 428 100.0 175 100.0 253 100.0
significantly association with one or both predictors to check if the ORs were different between the groups and to decide whether to analyze them separately for each group or in the total cohort. Independent predictors of three outcomes were obtained with two multivariate analyses with multiple lo-gistic regressions. The multivariate analysis models were tested with the Hosmer and Lemeshow test and receiver operating characteristic curves. The possible confounders tested were: (a) maternal age (<35 versus35 years old); (b) parity (nulliparity versus multiparity); (c) gestational age (37–38 versus39 weeks); (d) presence of insulin treated and non-insulin treated gestational diabetes; (e) urologic problems during pregnancy (such as recurrent cystitis, py-elonephritis, hydronephrosis, and hydroureter); (e) presence of oligohydramnios; (f) mode of delivery; (g) shoulder dys-tocia at birth; (h) newborn gender; (i) newborn birthweight (<4,000 g versus4,000 g); (j) presence of neonatal sepsis; and (k) presence of neonatal seizures. The significance level was 5% (p<0.05).
The Ethics Committee for Health of the authors’ institu-tion approved the present study under the reference number 21/4/2017/1, on April 21st, 2017.
Results
The main characteristics of the cohort are listed in►Table 2. The mean maternal age did not differ significantly be-tween the groups; it was 31.05.1 and 30.85.3 years old in groups A and B, respectively (p¼0.809). In addition, there were no major differences in the distribution of maternal age between the age groups (p¼0.957). In both groups, the majority of women was nulliparous (63.4% in group A versus 71.1% in group B,p¼0.092). Few women had a diagnosis of gestational diabetes, gestational hyper-tension, or urologic problems during pregnancy. Only two women in group A and six women in group B had oligohy-dramnios (p¼0.481).
The mean gestational age at delivery was similar between the groups (39.451.02 weeks in group A versus 39.361.06 weeks in group B;p¼0.380), and most women delivered at 39 weeks or beyond (83.4% in group A versus 81.8% in group B; p¼0.667). Vacuum assisted delivery was the most common birth type in both groups (45.7% versus 62.8% in groups A and B, respectively) and the caesarean rate was higher in group A
(44.4% versus 22.5%;p¼0.000). The most frequent reason to perform an UCBGA in group A was a non-reassuring fetal CTG pattern (n¼171; 97.7%), while in group B it was instrumental delivery (n¼235; 92.9%). The women in group A were more likely to have male newborns (64.0% versus 52.2%;p¼0.015), although the male gender predominated in both groups. The mean birthweight was higher in group B (3,254.14337.48 versus 3,345.85407.09 g; p¼0.012) and the women in group B were more likely to have macrosomic newborns (0.6% versus 4.7%;p¼0.013).
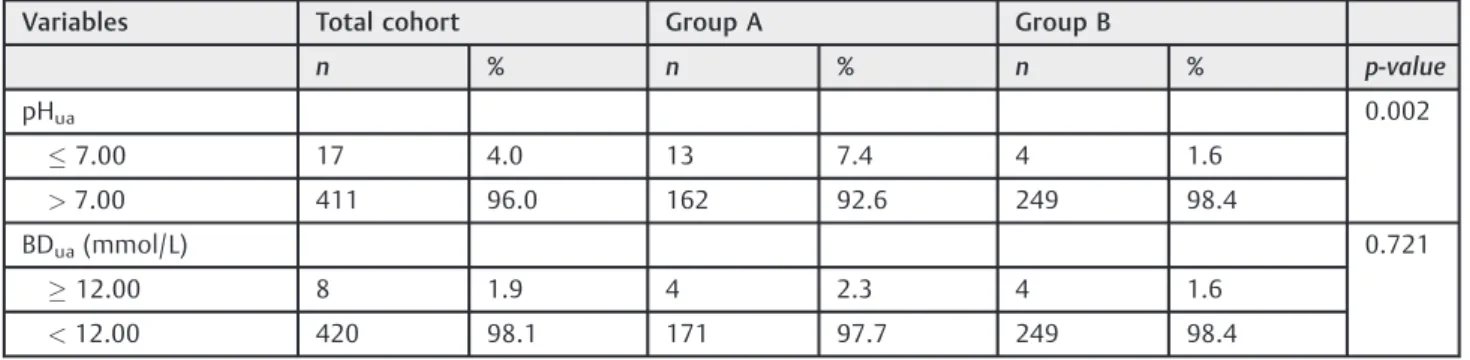
In group A, the mean pHuawas lower (7.160.10 versus 7.200.08; p¼0.000) and the mean BDua was higher (5.103.84 versus 4.123.74 mmol/L; p¼0.009) than in group B. The newborns from group A were more likely to have pHua7.00, but not BDua12.00 mmol/L (p¼0.002 andp¼0.721, respectively) (►Table 3).
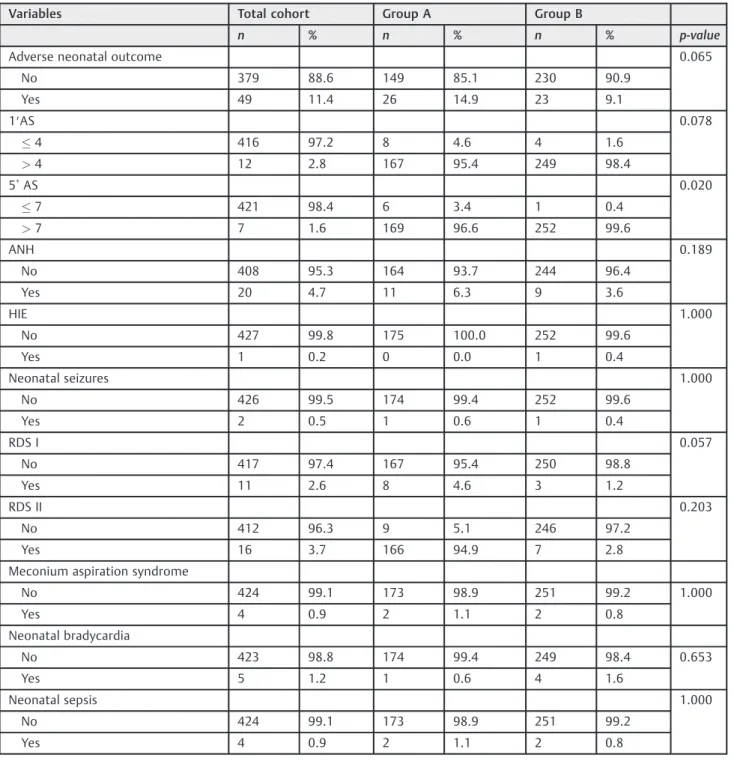
All eight cases of BDua 12.00 mmol/L in group A also had pHua 7.00. Considering the total cohort, new-borns with pHua 7.00 were more likely to have BDua 12.00 mmol/L (p¼0.000) and vice-versa (p¼0.000). There were no statistically significant differences between the groups pHua7.00 and pHua>7.00 and the groups BDua 12.00 mmol/L and BDua<12.00 mmol/L regarding any of the potentially confounders analyzed. Among all newborns, 26 in group A and 23 in group B had at least one adverse neonatal outcome (14.9% versus 9.1%; p¼0.065) (►Table 4).
The only neonatal outcome that had a statistically signifi -cant difference between the groups (3.4% versus 0.4%,
p¼0.020) was 5& AS 7. In the total cohort, there was only one case of HIE, which occurred in group B. It was a 40-week pregnancy, with the diagnosis of gestational hyper-tension and oligohydramnios, ending in a vacuum-assisted delivery due to a second stage arrest of labor. The 3,150 g male newborn had a 1&AS¼3 and a 5&AS¼7. The pHuawas 6.85 and the BDuawas 18.90. The results of the univariate regression analyses of association between neonatal out-comes and pHua7.00 or BDua12.00 mmol/L showedfive significant associations (►Table 5):
1. pHua7.00 and 1&AS4 (total cohort: OR¼9.57; 95% CI: 2.33–39.25;p¼0.009);
2. pHua7.00 and 5&AS7 (total cohort: OR¼10.83; 95% CI: 1.94–60.40;p¼0.028);
Table 3 Descriptive statistics of neonatal outcome predictors
Variables Total cohort Group A Group B
n % n % n % p-value
pHua 0.002
7.00 17 4.0 13 7.4 4 1.6
>7.00 411 96.0 162 92.6 249 98.4
BDua(mmol/L) 0.721
12.00 8 1.9 4 2.3 4 1.6
<12.00 420 98.1 171 97.7 249 98.4
3. pHua7.00 and ANH (total cohort: OR¼7.60; 95% CI: 2.23–25.91; p¼0.006; group B: OR¼34.57; 95% CI: 4.24–282.06;p¼0.007);
4. BDua12.00 mmol/L and 1&AS4 (total cohort: OR¼27.40; 95% CI: 5.66–132.54;p¼0.001; group A: OR¼27.50; 95% CI: 3.29–229.68;p¼0.011);
5. BDua12.00 mmol/L and ANH (total cohort: OR¼7.44; 95% CI: 1.40–39.49;p¼0.049).
In the total cohort, the univariate regression analysis of the association between these three neonatal outcomes
and the possible confounding factors revealed that (►Table 6):
1. There was a statistically significant association between maternal multiparity and 1′AS4, 5′AS7 and ANH (OR: 4.45; 95% CI: 1.32–15.04; p¼0.022; OR: 5.47; 95% CI: 1.05–28.58;p¼0.037; and OR: 2.74; 95% CI: 1.11–6.77; p¼0.024, respectively)
2. There was a statistically significant association between shoulder dystocia at birth and ANH (OR: 15.00; 95% CI: 2.36–95.44;p¼0.019).
Table 4 Descriptive statistics of neonatal outcomes
Variables Total cohort Group A Group B
n % n % n % p-value
Adverse neonatal outcome 0.065 No 379 88.6 149 85.1 230 90.9
Yes 49 11.4 26 14.9 23 9.1
1′AS 0.078
4 416 97.2 8 4.6 4 1.6
>4 12 2.8 167 95.4 249 98.4
5&AS 0.020
7 421 98.4 6 3.4 1 0.4
>7 7 1.6 169 96.6 252 99.6
ANH 0.189
No 408 95.3 164 93.7 244 96.4 Yes 20 4.7 11 6.3 9 3.6
HIE 1.000
No 427 99.8 175 100.0 252 99.6 Yes 1 0.2 0 0.0 1 0.4
Neonatal seizures 1.000 No 426 99.5 174 99.4 252 99.6
Yes 2 0.5 1 0.6 1 0.4
RDS I 0.057
No 417 97.4 167 95.4 250 98.8 Yes 11 2.6 8 4.6 3 1.2
RDS II 0.203
No 412 96.3 9 5.1 246 97.2 Yes 16 3.7 166 94.9 7 2.8 Meconium aspiration syndrome
No 424 99.1 173 98.9 251 99.2 1.000 Yes 4 0.9 2 1.1 2 0.8
Neonatal bradycardia
No 423 98.8 174 99.4 249 98.4 0.653 Yes 5 1.2 1 0.6 4 1.6
Neonatal sepsis 1.000 No 424 99.1 173 98.9 251 99.2
Yes 4 0.9 2 1.1 2 0.8
After the application of the logistic regression models, the conclusions were:
1. Belonging to group A did not affect the occurrence of 1&AS 4, 5& AS 7, or ANH when compared with group B (p¼0.185;p¼0.098; andp¼0.600, respectively); 2. There was a statistically significant impact of pHua7.00
in the occurrence of ANH (OR: 6.71; 95% CI: 1.21–37.06; p¼0.029), but not in the occurrence of 1&AS4 or of 5& AS7 (p¼0.871; andp¼0.130, respectively);
3. Multiparous women had a statistically significant higher risk of delivering a newborn with 1&AS4 and ANH (OR: 5.38; 95% CI: 1.35–21.43;p¼0.017; and OR: 2.66; 95% CI: 1.03–6.89;p¼0.043, respectively);
4. Women who had urologic problems during pregnancy had a statistically significantly higher risk of delivering a newborn with 5&AS7 (OR: 15.17; 95% CI: 1.29–177.99; p¼0.030);
5. Shoulder dystocia represents a 15 times higher risk of ANH (OR: 14.82; 95% CI: 2.20–99.60;p¼0.006).
Discussion
The pHua seems to be a reliable marker for acute peri-partum problems and a good predictor of adverse neo-natal outcomes, as has been widely documented in the literature.1,2,4–6The results of the present study support these concepts. In fact, the newborns with pHua 7.00 had a 9.57 times higher risk of 1& AS 4, a 10.83 times higher risk of 5& AS 7, and a 7.6 times higher risk of ANH; and after the multivariate analysis, pHua 7.00 remained as an independent predictor of ANH, granting a 6.71 higher risk.
There is no consensus about the importance of BDuaas an adverse outcome predictor.3,5,6,9In the present study, the risk of 1′AS4 and of ANH was 27.4 and 7.44 higher for the newborns with BDua12.00 mmol/L, respectively; and after excluding the confounding factors, BDua 12.00 mmol/L remained an independent predictor of 1′AS4, increasing its risk almost 52 times.
Shoulder dystocia is a well-known risk factor of neonatal hypoxia. Therefore, it is not surprising that it significantly Table 5 Results of the univariate regression analyses for neonatal outcomes in newborns with pHua7.00 and
BDua12.00 mmol/L
Variables Total cohort Group A Group B
OR 95% CI p-value OR 95% CI p-value OR 95% CI p-value
pHua7.00
1′AS4 9.57 2.33–39.25 0.009 4.73 0.85–26.22 0.111 27.33 2.17–344.29 0.062 5&AS7 10.83 1.94–60.40 0.028 2.62 0.28–24.23 0.375 n.a. n.a. 0.016 ANH 7.60 2.23–25.91 0.006 3.09 0.59–16.09 0.191 34.57 4.24–282.06 0.007
Neonatal seizures n.a. n.a. 0.439 n.a. n.a. 1.000 n.a. n.a. 0.242 RDS I 2.51 0.30–20.79 0.363 1.85 0.21–16.26 0.468 n.a. n.a. 1.000
RDS II 3.78 0.79–18.15 0.128 4.03 0.75–21.74 0.136 n.a. n.a. 1.000
Meconium aspiration syndrome
n.a. n.a. 1.000 n.a. n.a. 1.000 n.a. n.a. 1.000
Neonatal
bradycardia 4.17 0.46–37.65 0.210 n.a. n.a. 1.000 3.92 0.40–38.18 0.322 Neonatal sepsis 3.12 0.32–30.19 3.120 n.a. n.a. 0.507 1.28 0.08–20.72 1.000 BDua12.00 mmol/L
1′AS4 27.40 5.66–132.54 0.001 27.50 3.29–229.68 0.011 27.33 2.17–344.29 0.062 5&AS7 9.86 1.04–93.05 0.125 n.a. n.a. 0.016 n.a. n.a. 1.000 ANH 7.44 1.40–39.49 0.049 5.37 0.51–56.36 0.230 10.04 0.94–107.45 0.136
Neonatal seizures n.a. n.a. 1.000 n.a. n.a. 1.000 n.a. n.a. 1.000 RDS I n.a. n.a. 1.000 n.a. n.a. 1.000 n.a. n.a. 1.000 RDS II 3.86 0.45–33–37 0.265 6.79 0.63–71.79 0.192 n.a. n.a. 1.000
Meconium aspiration syndrome
n.a. n.a. 1.000 n.a. n.a. 1.000 n.a. n.a. 1.000
Neonatal
bradycardia n.a. n.a. 1.000 n.a. n.a. 1.000 n.a. n.a. 1.000 Neonatal sepsis n.a. n.a. 1.000 n.a. n.a. 1.000 n.a. n.a. 1.000
increases the risk of ANH. Performing an UCBGA seems warranted in these situations.
Although there was an association between pHua7.00 and 1&AS4, as well as between pHua7.00 and 5&AS7, belonging to group A did not affect the occurrence of 1&AS4 or of 5&AS7. This fact can be explained by thefindings of Sabol et al,1which concluded that newborns with a reassur-ing Apgar score have a residual risk of neonatal acidemia. They also concluded that, in this rare setting, the acidemic newborns have worse outcomes when compared with their non-acidemic counterparts.1 These findings support the introduction of universal UCBGA as a valuable neonatal screening test for neonatal hypoxia and its consequences.
Finally, the present study has found two other things that neither were expected nor clear in the previous literature. The newborns from multiparous women had a 5.38 and a 2.66 times higher risk of having 1&AS4 and ANH, respectively, when compared with newborns from nulliparous women. One study of Mgaya et al14also found an increased incidence of low Apgar scores in newborns from grand multiparas. Thesefindings can indicate an increased risk of disturbances in the fetal oxygen-ation that would predispose fetuses to a lower oxygen reserve during labor, but more studies are necessary to understand and validate this association.
The only independent predictor for 5&AS7 in the present study was urologic problems during pregnancy, which granted a 15.17 times higher risk of this adverse outcome. Thisfinding is difficult to understand in the light of the current knowledge.
The present study has the limitations of a retrospective cohort: not all of the confounding variables can be controlled, and the data collected relies on accurate patientfiles, except for the UCBGA. In the 56 cases excluded due to limited data, there were 2 cases of shoulder dystocia and 23 cases of non-reassuring fetal CTG patterns, which may have caused a bias. Another limitation of the present study is that the UCBGA was not performed in all deliveries, but this seems to be shared in the majority of UBCGA studies. Collecting umbilical cord blood samples in emergency situations, like placental abruption or non-reassuring CTG patterns is difficult. In this study 66 out of the 148 UCBGA that were excluded because of incomplete, non-valid or only one-vessel results ocurred in such emergen-cy settings, which lead to an inevitable bias. The small cohort size can justify why the only significant associations found were between pHua7.00 and 1′AS 4; between 5′AS 7 and ANH; and between BDua12.00 mmol/L and 1′AS4 and ANH. Because only one newborn had HIE and there were no deaths, it became impossible to assess the rela-tionship between these outcomes and neonatal pHua7.00 or BDua12.00mmol/L.
In the light of new evidence, the umbilical artery lactate level seems as a reliable outcome predictor of low Apgar score and of neurologic morbidity6,13that is directly mea-sured from blood3. It is association with medium and long-term neonatal outcomes can be adressed in future.
Some recent studies argue that the threshold for adverse neonatal outcomes is pHua7.10.7,8In the cohort of the present Table 6 Results of the univariate regression analyses for confounding factors in newborns with 1’AS4, 5&AS7 and ANH, in total cohort
Variables 1’AS4 5′AS7 ANH
OR 95% CI p-value OR 95% CI p-value OR 95% CI p-value
Study group 2.98 0.88–10.06 0.078 8.95 1.97–74.98 0.020 1.82 0.74–4.49 0.244 Maternal age 1.24 0.37–4.18 1.000 0.82 0.18–3.70 1.000 1.15 0.45–2.94 0.771
Parity 4.45 1.32–15.04 0.022 5.47 1.05–28.58 0.037 2.74 1.11–6.77 0.024
Insulin treated
gestational diabetes 2.010 0.246 0.424 n.a. n.a. n.a. n.a. n.a. n.a. Non-insulin treated
gestational diabetes n.a. n.a. n.a. n.a. n.a. n.a. n.a. n.a. n.a. Gestational hypertension n.a. n.a. n.a. n.a. n.a. n.a. n.a. n.a. n.a. Urologic problems
during pregnancy 9.36 0.97–90.78 0.133 17.36 1.68–179.44 0.080 5.32 057–49.89 0.214 Oligohydramnios n.a. n.a. n.a. n.a. n.a. n.a. n.a. n.a. n.a. Gestational age at birth 1.06 0.23–4.96 1.000 n.a. n.a. n.a. 0.62 0.22–1.77 0.368
Vacuum delivery 0.39 0.11–1.30 0.111 1.06 0.23–4.77 1.000 0.63 0.26–1.56 0.317 Forceps delivery 2.77 0.58–13.27 0.202 2.25 0.26–19.35 0.401 2.49 0.69–9.03 0.157
Cesarean section 2.25 0.71–7.11 0.205 0.88 0.17–4.57 1.000 1.19 0.46–3.06 0.715
Newborn’s gender 0.43 0.12–1.62 0.202 0.53 0.10–2.74 0.704 0.70 0.28–1.80 0.460
Birthweight n.a. n.a. n.a. n.a. n.a. n.a. n.a. n.a. n.a. Shoulder dystocia 9.36 0.97–90.78 0.133 n.a. n.a. n.a. 15.00 2.36–95.43 0.019 Neonatal sepsis n.a. n.a. n.a. n.a. n.a. n.a. n.a. n.a. n.a.
study, if the pHuathreshold is changed from pHua7.00 to pHua 7.10, the number of acidemic neonates increases from 17 to 79, so further studies can be designed to verify whether there is an association between pHua7.10 and other neonatal out-comes besides 1′AS4; 5′AS7, and ANH.
Additional studies are necessary to understand if multi-parity and urologic problems during pregnancy are true predictors of adverse neonatal outcome; and, if so, what are the responsible physiopathological mechanisms.
Conclusion
The pHuaand the BDuaare predictors of adverse neonatal outcomes, and the UCBGA is a useful tool for screening newborns at risk. The meaning of low pHuaand high BDua present in clinically healthy newborns with good Apgar scores remains to be determined, but the healthy acidemic newborns seem to have worse outcomes when compared with their non-acidemic counterparts. Therefore, universal UCBGA should be considered for all deliveries because it is an accurate screening test for neonatal hypoxia.
Contributions
Ferreira C. S.– elaboration of the database, data search, statistical analysis, and article writing, revision and approval. Melo A.–elaboration of the database, data search, and article revision and approval. Fachada A. H. - data search and article revision; Solheiro H.–data supply and search and article revision and approval; Martins N. N.–study design, elaboration of the database, and article revision and approval.
Conflict of Interests
The authors have no conflicts of interests to disclose.
Acknowledgements
The authors would like to thank the Clinical Pathology Department of the Centro Hospitalar Tondela-Viseu for its help in the UCBGA data collection and to Adriana Belo for her collaboration in the statistical analysis.
References
1 Sabol BA, Caughey AB. Acidemia in neonates with a 5-minute Apgar score of 7 or greater - What are the outcomes? Am J Obstet Gynecol 2016;215(04):486.e1–486.e6 Doi: 10.1016/j.ajog.2016.05.035
2 Malin GL, Morris RK, Khan KS. Strength of association between umbilical cord pH and perinatal and long term outcomes: systema-tic review and meta-analysis. BMJ 2010;340:c1471 Doi: 10.1136/ bmj.c1471
3 Knutzen L, Svirko E, Impey L. The significance of base deficit in acidemic term neonates. Am J Obstet Gynecol 2015;213(03):373. e1–373.e7 Doi: 10.1016/j.ajog.2015.03.051
4 Ahmadpour-Kacho M, Zahedpasha Y, Hagshenas M, Akbarian Rad Z, Sadat Nasseri B, Bijani A. Short term outcome of neonates born with abnormal umbilical cord arterial blood gases. Iran J Pediatr 2015;25(03):e174 Doi: 10.5812/ijp.25(3)2015.174
5 Georgieva A, Moulden M, Redman CW. Umbilical cord gases in relation to the neonatal condition: the EveREst plot. Eur J Obstet Gynecol Reprod Biol 2013;168(02):155–160 Doi: 10.1016/j. ejogrb.2013.01.003
6 Martí Gamboa S, Pascual Mancho J, Rodrigo Rodríguez M, Ruiz Sada J, Castán Mateo S. pH, base deficit or lactate. Which is better for predicting neonatal morbidity? J Matern Fetal Neonatal Med 2017;30(19):2367–2371 Doi: 10.1080/ 14767058.2016.1248936
7 Morgan JL, Casey BM, Bloom SL, McIntire DD, Leveno KJ. Metabolic acidemia in live births at 35 weeks of gestation or greater. Obstet Gynecol 2015;126(02):279–283 Doi: 10.1097/AOG.0000000000 000923
8 Yeh P, Emary K, Impey L. The relationship between umbilical cord arterial pH and serious adverse neonatal outcome: analysis of 51,519 consecutive validated samples. BJOG 2012;119(07): 824–831 Doi: 10.1111/j.1471-0528.2012.03335.x
9 Victory R, Penava D, Da Silva O, Natale R, Richardson B. Umbilical cord pH and base excess values in relation to adverse outcome events for infants delivering at term. Am J Obstet Gynecol 2004; 191(06):2021–2028
10 Low JA, Panagiotopoulos C, Derrick EJ. Newborn complications after intrapartum asphyxia with metabolic acidosis in the term fetus. Am J Obstet Gynecol 1994 Apr;170(04):1081–1087
11 Andres RL, Saade G, Gilstrap LC, et al. Association between umbilical blood gas parameters and neonatal morbidity and death in neonates with pathologic fetal acidemia. Am J Obstet Gynecol 1999;181(04):867–871 Doi: 10.1016/S0002-9378(99) 70316-9
12 Royal College of Obstetricians and Gynecologists, Royal College of Midwives, Royal College of Anaesthetists, Royal College of Pae-diatrics and Child Health. Safer Childbirth: Minimum Standards for the Organisation and Delivery of Care in Labour. London: RCOG; 2007
13 American Academy of Pediatrics. Neonatal encephalopathy and neurologic outcome, Second Edition: Report of the American College of Obstetricians and Gynecologists' Task Force on Neonatal Encephalopathy. Pediatrics 2014;133: e1482–e1488