Short-Term Fidelity, Habitat Use and Vertical
Movement Behavior of the Black Rockfish
Sebastes schlegelii
as Determined by
Acoustic Telemetry
Yingqiu Zhang1,2, Qiang Xu1
*, Josep Alós3, Hui Liu1,2, Qinzeng Xu1, Hongsheng Yang1 *
1Key Laboratory of Marine Ecology and Environmental Sciences, Institute of Oceanology, Chinese Academy of Sciences, Qingdao, China,2University of Chinese Academy of Sciences, Beijing, China, 3Department of Biology and Ecology of Fishes, Leibniz-Institute of Freshwater Ecology and Inland Fisheries, Berlin, Germany
*[email protected](HY);[email protected](QX)
Abstract
The recent miniaturization of acoustic tracking devices has allowed fishery managers and scientists to collect spatial and temporal data for sustainable fishery management. The spa-tial and temporal dimensions of fish behavior (movement and/or vertical migrations) are par-ticularly relevant for rockfishes (Sebastesspp.) because most rockfish species are
long-lived and have high site fidelity, increasing their vulnerability to overexploitation. In this study, we describe the short-term (with a tracking period of up to 46 d) spatial behavior, as determined by acoustic tracking, of the black rockfishSebastes schlegelii, a species subject
to overexploitation in the Yellow Sea of China. The average residence index (the ratio of detected days to the total period from release to the last detection) in the study area was 0.92±0.13, and most of the tagged fish were detected by only one region of the acoustic receiver array, suggesting relatively high site fidelity to the study area. Acoustic tracking also suggested that this species is more frequently detected during the day than at night in our study area. However, the diel detection periodicity (24 h) was only evident for certain periods of the tracking time, as revealed by a continuous wavelet transform. The habitat selection index of taggedS.schlegeliisuggested thatS.schlegeliipreferred natural reefs,
mixed sand/artificial reef bottoms and mixed bottoms of boulder, cobble, gravel and artificial reefs. The preference of this species for the artificial reefs that were recently deployed in the study area suggests that artificial seascapes may be effective management tools to attract individuals. The vertical movement of taggedS.schlegeliiwas mostly characterized by
bottom dwelling behavior, and there was high individual variability in the vertical migration pattern. Our results have important implications forS.schlegeliicatchability, the
implemen-tation of marine protected areas, and the identification of key species habitats, and our study provides novel information for future studies on the sustainability of this important marine resource in eastern China.
OPEN ACCESS
Citation:Zhang Y, Xu Q, Alós J, Liu H, Xu Q, Yang H (2015) Short-Term Fidelity, Habitat Use and Vertical Movement Behavior of the Black RockfishSebastes schlegeliias Determined by Acoustic Telemetry. PLoS ONE 10(8): e0134381. doi:10.1371/journal. pone.0134381
Editor:Jeffrey Buckel, North Carolina State University, UNITED STATES
Received:February 23, 2015
Accepted:July 8, 2015
Published:August 31, 2015
Copyright:© 2015 Zhang et al. This is an open access article distributed under the terms of the
Creative Commons Attribution License, which permits unrestricted use, distribution, and reproduction in any medium, provided the original author and source are credited.
Data Availability Statement:All relevant data are within the paper and its Supporting Information files.
Funding:HY was supported through the National Key Technology Research and Development Program (grant no. 2011BAD13B02) provided by Ministry of Sciences and Technology of the People’s Republic of China (URL:http://www.most.gov.cn/eng/
), the Non-Profit Marine Sector (grant no. 201205023, 201305043) provided by State Oceanic
Administration People’s Republic of China (URL:
Introduction
The historical exploitation of naturally reproducing fish populations has led to the overexploi-tation of many stocks and serious effects on natural systems, societies and economies
world-wide [1–6]. A primary factor in the overexploitation of marine resources is poor spatial
knowledge of fish stocks [7–11]. For example, fish movement is rarely considered in stock
assessments, although movement is a key parameter in the population structure of many
spe-cies (e.g., Atlantic bluefin tunaThunnus thynnus[12]) and the potential survival benefits
pro-vided by marine protected areas (MPAs) [13]. An understanding of the spatial dimension of
the fish stock is therefore integral to the sustainability of fisheries. Such understanding enables us to identify the expected distribution of resources or the consequences of selective fishing
[14–16]. Unfortunately, proper fishery management is complex and requires involved spatial
socio-ecological approaches to fully elucidate the role of space in fishery sustainability [17].
Because of its complexity, traditional fishery management is typically based on homogeneous
scenarios, and the spatial component is frequently overlooked [7,18].
With the recent development of fish-tracking technology [19] and fishing vessel monitoring
systems [20], ecologists and fishery scientists have gained new powerful tools to enhance the
understanding of the spatial dimensions of fisheries. For example, an extensive study involving
trackingT.thynnuswith satellite tags provided a more detailed knowledge of the population
structure to enable the management of naturally spawning stocks based on differences in
fish-ing mortality between the Gulf of Mexico and the Mediterranean [12]. At a smaller spatial
scale, acoustic tracking has emerged as a powerful tool for the estimation of spatial distribu-tions and temporal patterns of coastal fish to inform proper spatial management of coastal
fish-eries worldwide [21]. Tagging and tracking coastal fish using an array of omnidirectional
receivers provides detailed information on the movements of coastal fish [22] as well as their
habitat utilization [10,23], site fidelity [24], vertical movement [25] and diel migration [26].
Elucidating these behavioral traits has aided the sustainable development of coastal fisheries, particularly by contributing to the delineation of MPAs and identifying essential habitat [13,21,27–29].
The spatial and temporal distribution of rockfish is especially relevant for the vulnerability of rockfish to overexploitation. Rockfish comprise a number of species within the genus
Sebastesand are highly exploited in the Pacific Ocean [30]. The abundance of Puget Sound
rockfishes has declined approximately 70% between 1970 and 2010 [31], and the bocaccio
rockfishSebastes paucispinisand the yelloweye rockfishSebastes ruberrimuswere at high and
moderate risk of extinction throughout Puget Sound/Georgia Basin [32]. Rockfish are
particu-larly vulnerable to overexploitation [33–35] for two main reasons. First, the life history of
rock-fish is characterized by long lifespans, late maturation, low offspring production (oviparous)
rates and generally large adult sizes [33,36]. Second, rockfish have strong site fidelity and a
lim-ited capacity for movement, increasing their vulnerability to local depletion. In a 445-day study
off the coast of central California, Green et al. [37] reported that the blue rockfishSebastes
mys-tinusonly moved within a home area of 0.07 to 0.53 km2. Jorgensen et al. [38] concluded that
S.mystinushas strong site fidelity and that short-term excursions were correlated with
envi-ronmental factors. Hannah and Rankin [39] performed an extensive study of several rockfish
species off the coast of Oregon, USA, and reported that five of the eight species examined were only detected by one or two nearby receivers in a large (5200-ha) receiver grid of 30 receivers during the entire year. These authors also provided substantial evidence for small vertical
migrations [39], which have implication for rockfish conservation and its vulnerability to
over-fishing, as fish performing stronger vertical migrations are more prone to encounter fishing
gears and be harvested [40]. Many studies [41,42] have therefore suggested that species of the
of Sciences (grant no. XDA11020404) provided by Chinese Academy of Sciences (URL:http://english. cas.cn/). JA was supported through a Marie Curie Post-Doc grant (FP7-PEOPLE-2012-IEF, grant no. 327160). The funders had no role in study design, data collection and analysis, decision to publish, or preparation of the manuscript.
genusSebasteshave strong site fidelity, which contributes to their vulnerability to local
deple-tion and overexploitadeple-tion [43].
Much less is known about the spatial and temporal dynamics of the movement behaviors
of the black rockfish,Sebastes schlegelii. This species inhabits shallow coastal waters (less than
100 m deep) along the coasts of Japan, Korea, and northern China [44,45]. Rockfish catch,
including that ofS.schlegelii, declined from the 1980s to 2005 [45,46].S.schlegeliiis one of the
most dominant fish species in the Yellow Sea (China) [35] and is estimated to be one of the
most important targeted species at our study site in Haizhou Bay [47]. Because of intense
bot-tom trawling, the catch per unit of effort (CPUE) and mean individual weight ofS.schlegeliiin
the Yellow Sea have significantly declined since 1985 [35]. To recover overexploited stocks,
China and Japan have implemented different management tools (such as prohibited fishing periods and zones and minimum sizes limitations) and a widespread stock-enhancement
pro-gram for this species [44,48,49]. MPAs, such as the National Marine Protected Area of
Demer-sal Fish Ecology in Lijin Dongying Shandong Province [50], have recently been created along
the coast of the Yellow Sea to reduce fish stock mortality by prohibiting commercial and recre-ational fishing activities. In addition, the Shandong Provincial Ocean and Fishery Agency and the Rizhao Blue Economy Zone Agency instituted two scientific research programs in 2005 to
enhance habitat recovery forS.schlegeliiand the greenlingHexagrammos otakii, including the
deployment of artificial reefs (ARs) around the Qiansan Islets [51–53]. The success of these
two management measures (MPAs and ARs) is strongly dependent on the range of movement
of this species [10,13], which is unknown.
In this study, we provide new information about the spatial and vertical behavior ofS.
schle-gelii. We performed an acoustic tracking experiment offshore of Ping Island in Haizhou Bay,
China, to provide new data oni) spatial movements and site fidelity in the acoustic array,ii)
the pattern of habitat utilization on natural habitats and artificial habitats andiii) the vertical
movement behavior of this species. Because of the current status of theS.schlegeliipopulation
in the Yellow Sea and the emerging interest of local authorities in spatial management, our work provides useful information for managers.
Materials and Methods
Ethics statement
S.schlegeliicollection and tagging and the deployment of the receiver mooring system around
Ping Island were permitted by the State Oceanic Administration People’s Republic of China
and the Qiansan Islets Aquatic Products Development Co. Ltd. All procedures were performed according to the guidelines of the American Fisheries Society for the use of fishes in research
[54]. The study was approved by the ethics committee of Institute of Oceanology, Chinese
Academy of Sciences. Our study did not involve endangered or protected species, and no ani-mals were sacrificed. Acoustic tags were attached to fish after anesthetization with MS-222, and all efforts were made to minimize fish handling and harm.
1. Study area
We performed an acoustic tracking experiment in the Qiansan Islets, a collection of three small
islands in Haizhou Bay in the central Yellow Sea, Northwest Pacific Ocean (seeFig 1). Our
study was centered around Ping Island (Fig 1), the largest islet of the Qiansan Islets. Our study
area covered the depth from the water surface of Ping Island to 38 m, and included different
types ofS.schlegeliinatural habitats: natural reefs and a mixture of kelp beds, gravel-cobble
bottoms and sandy substrates (Fig 1). Local authorities have submerged large rocks, cement
around the Qiansan Islets [51] (seeFig 1), and an MPA was created. The marine reserve sur-rounding Ping Island is the largest reserve within this MPA. We characterized the depth (m) of
the study area using a multi-beam sounding system (seeS1 Fig). The bottom substrate type
was determined using an EdgeTech 4100 Side Scan Sonar System (EdgeTech, Massachusetts,
USA) at 500 kHz (S2 Fig). The bottom types were further validated by the video surveys of the
SeaBotix LBV150-4 (Teledyne SeaBotix, California, USA) and the dive operated stereo-video
system (stereo-DOV) [47]. Video examples of the bottom types are provided inS1–S7Videos.
The spatial coverage of seagrass was quantified by a Simrad EY60 split-beam device run at 200 kHz along closely spaced routes parallel to the shelf in the shallow waters of the Qiansan Islets
(<20 m deep, seeS3 Figfor visualization of the trajectory), and the results suggested that the
seagrass was mainly distributed in shallower waters<15 m deep (Fig 1(C)). In general, the
Qiansan Islets are dominated by a semi-diurnal tide, with a southwest-oriented flood current
and a northeast-oriented ebb current at Ping Island (for more details, see [55,56]).
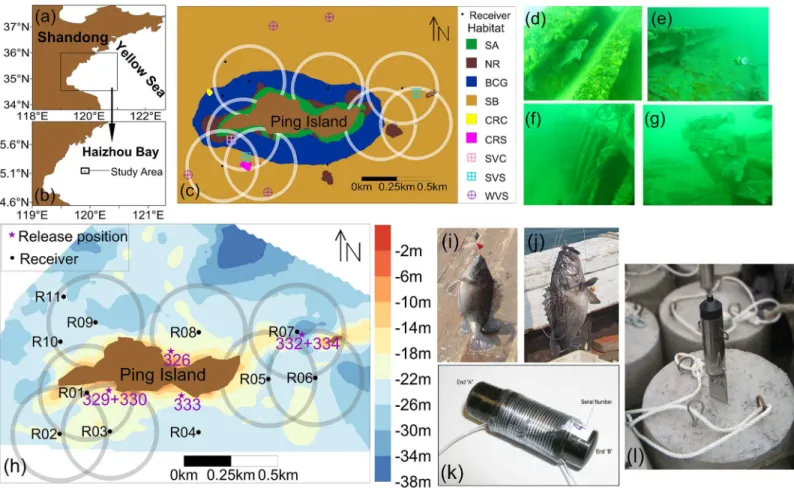
Fig 1. The study area location, habitat types, the tag wrapping method and the receiver mooring system.(a) The location of Haizhou Bay in the Yellow Sea. (b) The location of study area. (c) Bottom habitat types around Ping Island and detecting range of receivers. (d) Cement reef. (e)-(f) Sunken steel vessels. (g) Sunken wooden vessel. (h) The acoustic receiver array deployment, receiver positions and detecting range, the fish release positions and depth range (m) around Ping Island. (i)-(j) TwoS.schlegeliicaptured via hook and line by local fishermen. (k) The wrapping method for attachment of the acoustic tags and (l) The omnidirectional receiver and the mooring system. In panel (c), the halos around receivers represent a 250-m detection radius, and 3 receivers (R04, R10 and R11) without halo were lost. Habitat are named as seagrass at rocky bottom dominated bySargassum sp. (SA), natural reef (NR), boulder, cobble and gravel bottoms (BCG), sandy bottom (SB), cement reef at cobble bottom (CRC), cement reef at sandy bottom (CRS), sunken steel vessel at cobble bottom (SVC), sunken steel vessel at sandy bottom (SVS) and sunken wooden vessel at sandy bottom (WVS).
2. Receiver placement
On 1 August 2013, eleven acoustic receivers (model VR2W, VEMCO; Bedford, Nova Scotia,
Canada) were deployed on the seabed around Ping Island (Fig 1) to record the horizontal and
vertical movements ofS.schlegelii. Due to the limited number of receivers and limited
detec-tion range in our study area (seeFig 1), the study area was divided into five regions: a southwest
(SW) region that was monitored by three receivers (R01, R02 and R03), a southeast (SE) region that was monitored by one receiver (R04), an east (E) region that was monitored by three receivers (R05, R06 and R07), a northeast (NE) region that was monitored by one receiver (R08), and a northwest (NW) region that was monitored by three receivers (R09, R10 and R11).
To obtain the detection range of the VR2W receiver in our study area, an empirical range test was conducted using two anchored acoustic tags and one moving VR2W receiver. Two anchored acoustic tags (model: V9P-1H-A69-9002, 40 to 80 s burst interval) were fixed 10 m below the sea surface at the same position. The VR2W linked to the active VUE software (VEMCO) and situated 5 m below the sea surface was moved using a research vessel (equipped with an external GPS) from a distance of 0 m to 500 m from the two anchored tags. The received signal was at a maximum distance of 250 m from the receiver, which was calculated based on the GPS position where the receiver received signals and the acoustic tag position.
Therefore, we considered that the maximum detection range was 250 m (Fig 1panel (h)). This
maximum range of detection was similar to that reported by Villegas-Ríos et al. [57] for the
same tracking equipment in the shallow waters of Spain.
Before the acoustic receiver deployment in the study area, each VR2W receiver was
embed-ded in a protective steel barrel that was fixed on a cement base to ensure stability (Fig 1). The
fixed receiver system was placed on the sea floor using a heavy lift research vessel. Clements
et al. [58], Simpfendorfer et al. [59] and Espinoza et al. [60] suggested that detection probability
is highly influenced by environmental noise and may lead to erroneous interpretations of behavioral patterns. In fact, recent studies suggest that the detection of a distant acoustic signal can be highly influenced by environmental variables, such as the current generated by the tides
[23,61,62]. For this reason, we studied the patterns of three control tags (V9-1H-A69-1601, 9
mm diameter, 42 mm length, weight in air 3.6 g, weight in water 2.2 g, power output 151 dB re
1μPa at 1 m, 455 d life, 500 to 700 s burst interval) that were anchored at the centers of the SW
array (ID: 5011), E array (ID: 5012) and NW array (ID: 5001) in the study area to accurately
interpret the observed fish behaviors, following the recommendations of Payne et al. [63].
3. Tag attachment
SixS.schlegeliiwith weights ranging from 260 g to 610 g and total lengths ranging from
260 mm to 340 mm were sampled near the shelf of the study area without precise locations using conventional cage nets. These individuals were held for 24 h at the bottom of a fishing vessel in a recirculating live well (4 m × 2 m × 1 m). After 24 h, each individual was anesthe-tized using a dose of 100 mg/L MS-222. We then tagged the fish with an acoustic-pressure transmitter (model: V9P-1H-A69-9002, pressure sensitive [0 to 50 m] of 0.22 m resolution, 9 mm diameter, 42 mm length, weight in air 5.2 g, weight in water 2.7 g, power output 151 dB
re 1μPa at 1 m, 45 d life, 40 to 80 s burst interval) using an external attachment (Fig 1(K)).
This method of tagging is quick, easy to perform, and suitable for short-term studies [39,64]. A
needle was used to thread the two ends of the cord through the membrane between the second and third dorsal fin spines and the membrane between the fourth and fifth spines. The cord
ends were then threaded through two holes in a polyethylene gasket [65,66] on the opposite
2 min for each fish. After full recovery from anesthesia in the live well, the fish were released in
the study area (see positions of release inFig 1(H)). After 60 days of receiver recording tagged
fish underwater, we recovered the receivers, downloaded the data and constructed a geo-refer-enced database that included the data from tagged fish, the receiver positions and the time-related acoustic detections.
4. Data analysis
We structured the data analysis to achieve the three major objectives of this study:i) the
site-fidelity and temporal behavior variability ofS.schlegelii;ii) the spatial patterns and habitat
uti-lization ofS.schlegelii; andiii) the water column use and vertical behaviors ofS.schlegelii.
Detection data were filtered to remove potential spurious detections, defined as any single
transmitter code occurring alone during a 24-h period [57,67]. Given that the fine-scale
move-ment could not be determined, the geo-referenced receiver location was used as fish position, and the detecting range of the receiver was interpreted as the activity zone of the fish when the
receiver picked up a tagged fish [68]. This approach is widely used when the number of
receiv-ers [10,69] or the expected horizontal shift is limited (e.g., otherSebastesspecies [39]). We
derived a residence index for each individual following Green et al. [41] and March et al. [70]
by calculating the total number of days a tagged fish was detected in a region of the receiver array (DD) firstly and then dividing DD by the total period (TP) from release to the last detec-tion of each individual.
The effect of temporal variations onS.schlegeliibehavior was assessed via a continuous
wavelet transform (CWT) to identify any periodicity pattern in the hourly detections at differ-ent time scales (2, 4, 6, 16, 24, 32 and 64 hours). The robust predictive ability of CWT makes it one of the most promising tools for depicting multi-scale animal behaviors that are related to
environmental properties, i.e., diel and tidal patterns [71]. CWT allows a time series to be
divided into time-frequency space, which provides an alternative to Fourier analysis or other
time-frequency decomposition methods [72] to identify temporal patterns in behavioral data
during a tracking period [70,73]. The librarysowasin R (http://www.r-project.org/) was used
to compute the two-dimensional wavelet spectrum and to perform a point-wise test at a 95%
significance level for each of the tagged fish and control tags [74]. We fitted a single CWT for
each tagged individual and also for every control tag to separate any environmental periodicity
from behavioral periodicities [63].
We also specifically tested how diel phase (day versus night) affected hourly detections of control tags and tagged fish. Hourly detection data were grouped based on tag ID, diel phase (day versus night) and tracking date. Diel phase was considered as an independent variable and treated as a fixed factor, while controlling individual differences by treating tag ID as a ran-dom factor. For this assessment, we fitted the generalized linear mixed model (GLMM) to the
data of hourly detections for control tags and tagged fish using thelme4package in R [75]. The
temporal autocorrelation of the GLMMs residuals was assessed using the autocorrelation
func-tion acf in thestatspackage in R. The GLMMs were computed using the Poisson distribution,
and the dispersions of the GLMMs were computed to test the distribution fitness (Poisson
dis-tribution requires dispersion to be 1 [76]). The GLMM of control tag detections was fitted well
by a Poisson distribution (dispersion = 0.98), no significant temporal autocorrelation occurred, and the parameters of the GLMM were calculated. However, the GLMM of tagged fish hourly detections suffered strong over-dispersion (dispersion = 10.85) suggesting a zero-inflation of the data. We then fitted three zero-inflated GLMM with Gaussian, Poisson and negative
bino-mial distributions using the package‘glmmADMB’in R. The Akaike information criterion
zero-inflated negative binomial GLMM model was of the lowest AIC and fit best [77]. Tempo-ral autocorrelation was detected in the residuals of the model. The data were then resampled randomly until the acf plot showed no significant temporal autocorrelation. The parameters of the zero-inflated negative binomial GLMM with no significant autocorrelation were used to test whether diel phase affected hourly detections of tagged fish.
S.schlegeliispatial behavior was assessed by examining temporal plots of detections and
res-idence time at specific receivers. We also determinedS.schlegeliipreference for certain habitats
by calculating a habitat selection index (HSI) value for each fish to quantify preference for/
avoidance of different habitat types [78]. For each fish, the HSI value was calculated as the
quo-tient of habitat utilization, defined as the percentage of detections in a specific habitat, and hab-itat availability, defined as the percentage of each habhab-itat type in the 250 m detecting range of
the receivers that detected the fish [78]. Thus, preference or avoidance was calculated as the
degree of deviation (in a positive or negative direction, respectively) from the value of 1 [73,78].
We used the Tide_pred.m script (function) in the Tide Model Driver (TMD) MATLAB
package [79] to predict the tide height at Ping Island during our tracking period. Depth values
collected from tagged fish were closely related to predicted tide height (S4 FigandS1 Table).
CWT for fish depths revealed significant semi-diurnal periodicity (12 h) (S5 Fig), similar to the
local semi-diurnal tide periodicity. To ascertain accurate depth and vertical movements ofS.
schlegelii, the fish depths were corrected by deducting the predicted tide height (m) from the
collected depth every minute. The effect of temporal variation on the vertical behavior ofS.
schlegeliiwas statistically assessed via CWT to detect any periodicity in depth at different time
scales (2, 4, 6, 16, 24, 32 and 64 hours). Daily vertical movements ofS.schlegeliiwere also
grouped into one of 3 mutually exclusive categories: large vertical movement (LV), small
verti-cal movement (SV) and bottom dwelling behavior (BD), as described by Parker et al. [80]. LV
was characterized as>5 m of vertical movement per day. SV consisted of vertical movements
between 1 and 5 m per day. BD was characterized as<1 m vertical movement per day at a
steady depth or the depth of a semi-diurnal tide pattern.
Results
1. Detection sample size and site fidelity
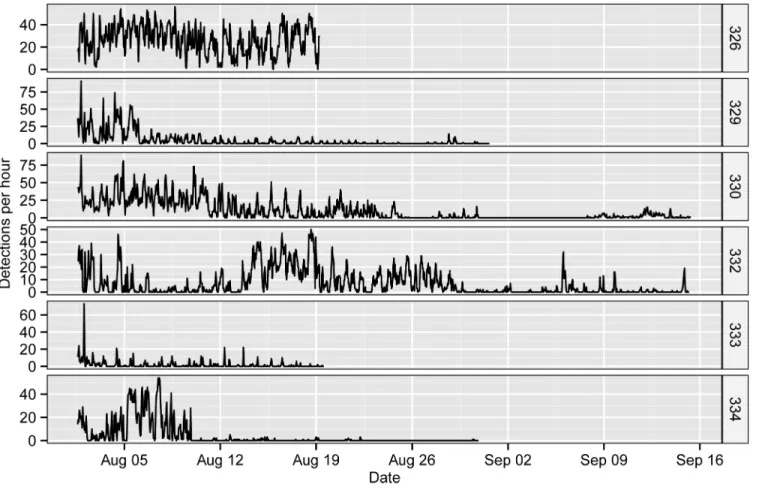
A total of 36,389 acoustic detections were collected from the six tagged fish in our acoustic
tracking experiment at Ping Island (Fig 2). The mean (± s.d.) number of detections of each fish
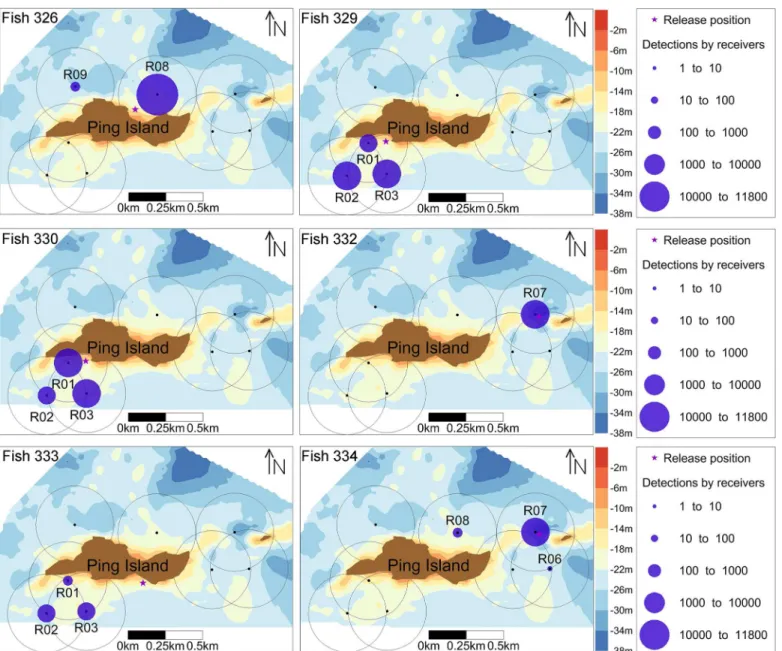
was 6065 ± 4241 and ranged from a minimum of 791 (ID: 333) to a maximum of 11201 (ID: 326). The fish were detected by at least one (ID: 332) and a maximum of 3 receivers (ID: 329,
330, 333 and 334), and fish 326 was detected by two receivers (Fig 3). The total DD of the
tagged fish ranged from 19 to 46 days, with an average of 28.67 ± 10.97 days. One fish (ID: 332) was detected in varying hourly detections throughout the entire study period (1 August to
15 September), a total of 46 days (Fig 2). Another fish (ID: 330) was detected for 38 days but
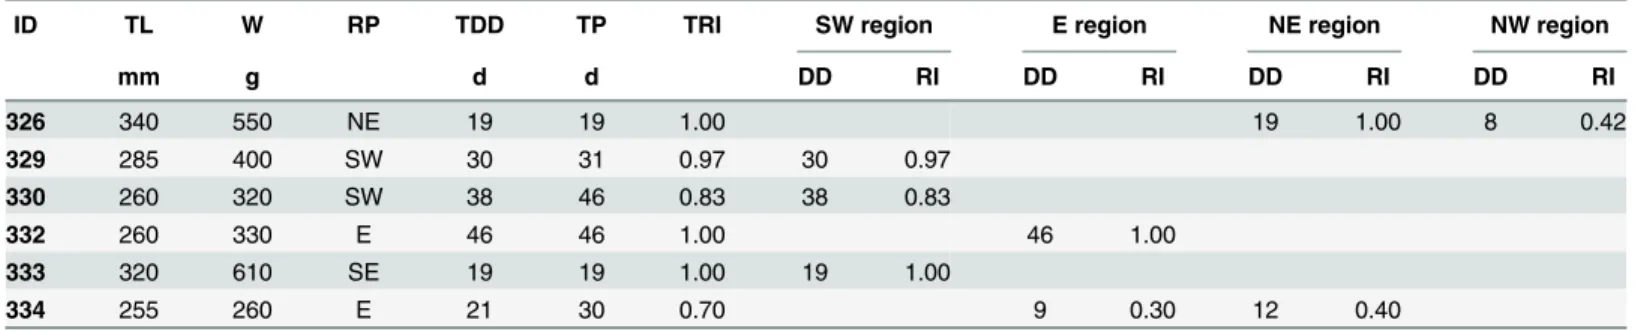
was lost from 30 Aug to 7 Sep, with a total period of 46 days. Fishes 329 and 334 were detected before 31 Aug for 30 days and 21 days, with total periods of 31 days and 30 days respectively. Fishes 326 and 333 were detected continuously until 19 August, a total of 19 days. The resi-dence index of tagged fish in the whole receiver array ranged from 0.70 to 1.00, with an average
of 0.92 ± 0.13 (Table 1). Four of six tagged fish were detected in only one region of the study
area and exhibited different degrees of site fidelity in their particular region (Table 1). Fish 326
was mainly detected in the NE region (R08), fish 329, 330 and 333 were only detected in the SW region (R01, R02 and R03), and fish 332 was only detected in the E region (R07), the
2. Diel detection pattern
The average hourly binned detections plot revealed a daily pattern of a higher number of
detec-tions during the day (15.54 ± 14.768 h−1) than during the night (13.07 ± 13.562 h−1) (Fig 4).
The GLMM (zero-inflated negative binomial model) confirmed this pattern and indicated that
the hourlyS.schlegeliidetections varied significantly with diel phase (day versus night)
(P<0.01) (Table 2). The GLMM fitted to the detections of control tags did not show changes
between day and night (Table 2), which excluded any environmental cause for the results
observed in the tagged fish.
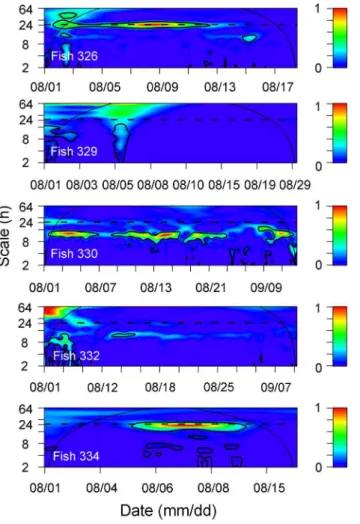
The temporal pattern of detections was assessed for every fish using wavelet spectrums (Fig 5). The diel pattern observed was only evident for certain periods of time and was not con-sistent across all tracking periods. The pattern of diel periodicity (24 h) was indicated by
signif-icant patches at 24 h scale in wavelet spectrums (Fig 5). For example, diel (24 h) periodicity
was only evident after 11 August for fish 326, between 4 and 9 August for fish 334 and after
tag-ging for fish 329 (Fig 5). The CWT results for the control tags confirmed that the pattern of
sig-nificant diel periodicities was related to fish behavior but not environmental factors (see the
absence of significant patches at 24 h scale inFig 6).
3. Habitat use
Most acoustic detections of individual fish were recorded by a relatively small number of
receivers, suggesting high site fidelity to specific areas (Fig 3). Habitat availability, defined as
Fig 2. Chronograms of the hourly detections (pooled from all receivers) of the six taggedS.schlegelii.
the percentage of each habitat type in the range of the receivers that detected the fish, varied
among habitat types (presented inTable 3). The habitat type of the greatest availability for
taggedS.schlegeliiat our study site was mixed sand/artificial reef bottoms (SB + AR)
(69.17 ± 12.67%), followed by sandy bottom (SB) (29.24 ± 22.91%), mixed bottoms of boulder, cobble, gravel and artificial reef (BCG + AR) (27.36 ± 0%), boulder, cobble and gravel bottoms
(BCG) (19.43 ± 17.91%), seagrass (dominated bySargassumsp.) (SA) (5.55 ± 2.26%) and
natu-ral reef (NR) (4.14 ± 1.06%). The average (± s.d.) habitat selection index (HSI) was larger than 1 (i.e., preference) for NR (1.11 ± 0.42), BCG + AR (1.05 ± 0.38) and SB + AR (1.04 ± 0.25) but less than 1 for SA (0.98 ± 0.71), BCG (0.79 ± 0.29) and SB (0.53 ± 0.62). These results suggest that fish exhibit a preference for NR, BCG + AR and SB + AR habitats and avoid SA, BCG and Fig 3. Spatial distribution of six taggedS.schlegeliidetections at receivers.The size of blue circles represents the number of individual detections of six taggedS.schlegeliiby every receiver.
SB habitats. The HSI of habitats that included AR (i.e., BCG + AR and SB + AR) was always
higher than 1, suggesting thatS.schlegeliimay prefer these artificial habitats.
4. Vertical movement
Although the available depth of the study area ranged (within the detection range) from land
(0 m) to 36 m, the taggedS.schlegeliiindividuals were detected at an average corrected depth
of 20.90 ± 5.71 m (Fig 7). The shallowest fish (ID 326) was detected at the depth (16.64 ± 0.64
m), and the deepest fish (ID 332) was detected at the depth (30.72 ± 0.51 m). The temporal pat-tern of corrected depth (i.e., depth after correction for the height of the tide) was determined for each tagged fish using CWT and showed a high variability among individuals and a lack of
any general pattern (Fig 8). CWT revealed significant diel periodicities (24 h) for fish 326 and
334, and semi-diurnal periodicities (12 h) for fish 330 (Fig 8). CWT showed no periodicity in
vertical movement of fish 329 and 332.
Of the three vertical behavioral patterns (LV, SV and BD), BD was observed most often (Table 4). BD was the most common behavior for most tagged fish. Fish 329, 330 and 332 per-formed BD and SV for most of the tracking period. Between 1 August and 19 August, SV was the most common behavioral pattern of fish 326 and 333. In our tagged fish (ID: 326, 329 and Table 1. Biological information and residence indices of six taggedS.schlegeliiindividuals.
ID TL W RP TDD TP TRI SW region E region NE region NW region
mm g d d DD RI DD RI DD RI DD RI
326 340 550 NE 19 19 1.00 19 1.00 8 0.42
329 285 400 SW 30 31 0.97 30 0.97
330 260 320 SW 38 46 0.83 38 0.83
332 260 330 E 46 46 1.00 46 1.00
333 320 610 SE 19 19 1.00 19 1.00
334 255 260 E 21 30 0.70 9 0.30 12 0.40
TL, total length; W, weight; RP, release position; TDD, total number of days detected by all receivers; TP, the total period from release to the last detection; TRI, total residence index; DD, number of days detected by an array; RI, residence index in an array.
doi:10.1371/journal.pone.0134381.t001
Fig 4. Mean hourly detections (±SE) of six tagged fish.Background color indicates day (white) or night (grey) based on the local sunrise and sunset time.
334), LV behavior was characterized by an ascent to shallow water during the night followed by a descent to deep water during the day. Fish 326 tended to ascend to shallow water and
descend to deep water during tidal movements throughout the study (Fig 7). Fish 334 remained
at a constant depth during the night but descended to the same maximum depth during the
day for less than one week (5 Aug to 10 Aug) (Fig 7). Similarly, fish 329 tended to ascend to
shallow water at night (1 Aug to 6 Aug).
Discussion
In this study, we used acoustic tracking to provide new information about the spatial and
tem-poral behaviors ofS.schlegelii. We provide new support for site fidelity, habitat utilization and
diel behavioral patterns over a short time scale (up to 46 days). In a recent effort to enhance
stocks and reduce fishing mortality ofS.schlegelii, the Japanese and Chinese governments have
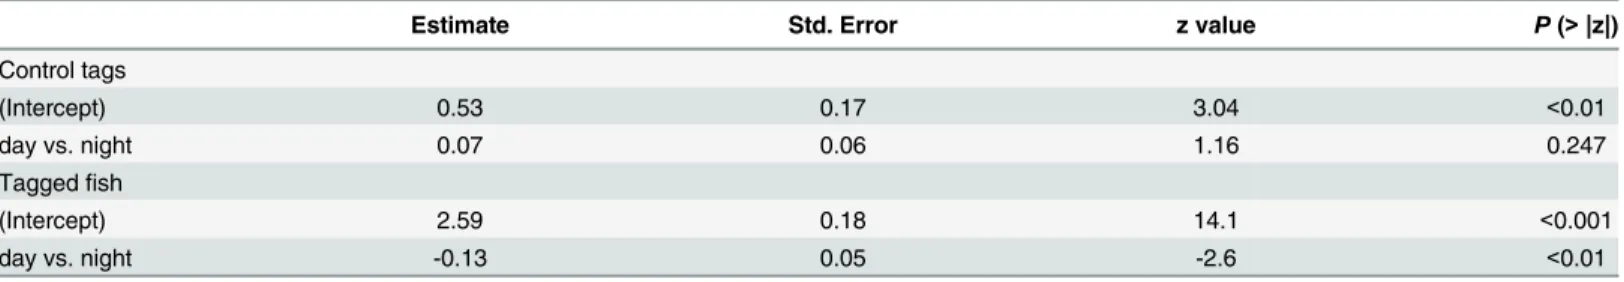
Table 2. Results of generalized linear mixed model testing effect of diel phase (day vs. night) on the hourly detections of control tags (in Poisson distribution) and taggedS.schlegelii(in zero-inflated negative binomial distribution).
Estimate Std. Error z value P(>|z|)
Control tags
(Intercept) 0.53 0.17 3.04 <0.01
day vs. night 0.07 0.06 1.16 0.247
Taggedfish
(Intercept) 2.59 0.18 14.1 <0.001
day vs. night -0.13 0.05 -2.6 <0.01
doi:10.1371/journal.pone.0134381.t002
Fig 5. Wavelet sample spectrums using a Morlet wavelet for detections of 6 tagged fish.Periodicities were detected in 3 individuals on a 24 h scale (horizontal dashed line). Continuous thin lines represent the cone of influence (COI). Values outside the COI should not be interpreted due to edge effects. Thick contours represent the 95% confidence level and scale bar represents the intensity of the time-frequency space over time.
stipulated spatial management plans, including the delimitation of MPAs and the deployment
of artificial reefs [44,48,49]. The success of these two management tools is strongly linked to
the spatial and temporal patterns of exploited species. Therefore, our results provide
informa-tion that can be directly applied to management plans forS.schlegeliiand contribute to
sustain-able fishery development.
1. Site fidelity
Species of theSebastesgenus exhibit strong site fidelity and very small home ranges in coastal
areas [38,39,81]. Our results indicate thatS.schlegeliialso exhibits strong site fidelity, with
resi-dence indices ranging from 0.70 to 1.00. The average resiresi-dence index of tagged fish in our study area was 0.92 ± 0.13, and most of the tagged fish (with the exception of fish 333) were Fig 6. Wavelet sample spectrums using a Morlet wavelet for 3 control tags.Continuous thin lines represent the cone of influence (COI). Values outside the COI should not be interpreted due to edge effects. Thick contours represent the 95% confidence level and scale bar represents the intensity of the time-frequency space over time. The pattern without diel periodicity is indicated by the lack of thick contours on a 24 h scale (horizontal dashed line).
doi:10.1371/journal.pone.0134381.g006
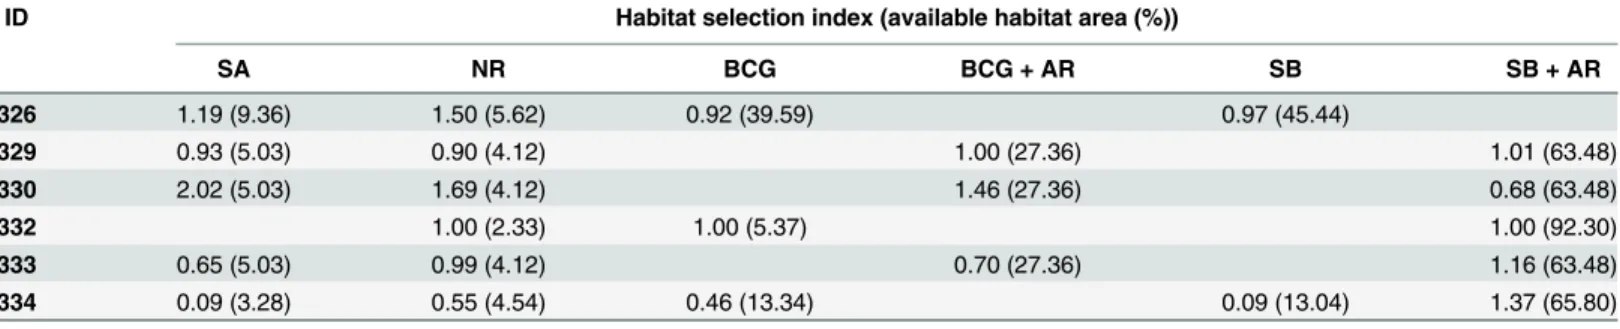
Table 3. Habitat selection index and available habitat area percentage for each tagged individual.
ID Habitat selection index (available habitat area (%))
SA NR BCG BCG + AR SB SB + AR
326 1.19 (9.36) 1.50 (5.62) 0.92 (39.59) 0.97 (45.44)
329 0.93 (5.03) 0.90 (4.12) 1.00 (27.36) 1.01 (63.48)
330 2.02 (5.03) 1.69 (4.12) 1.46 (27.36) 0.68 (63.48)
332 1.00 (2.33) 1.00 (5.37) 1.00 (92.30)
333 0.65 (5.03) 0.99 (4.12) 0.70 (27.36) 1.16 (63.48)
334 0.09 (3.28) 0.55 (4.54) 0.46 (13.34) 0.09 (13.04) 1.37 (65.80)
SA, seagrass (dominated bySargassumsp.) at rocky bottoms; NR, natural reef; BCG, boulder, cobble and gravel bottoms; BCG + AR, mixed bottoms of boulder, cobble, gravel and artificial reef; SB, sandy bottom, SB + AR, mixed sand/artificial reef bottoms.
continuously detected for more than 19 days in the receiver array during 46 day detecting peri-ods. Two tagged fish (ID: 330 and 332) were detected for nearly the entire tracking period and four tagged fish (ID: 326, 329, 333 and 334) were lost during the tracking period. One tagged fish (ID 334) migrated an approximate distance of 550 m from its site of release to a different
receiver. The observation of distance migrated is similar to those reported forS.schlegelii[82]
andS.mystinus[37]. The high site fidelity ofS.schlegeliisuggests that the MPAs recently
cre-ated by the Chinese and Japanese governments may be effective in protecting these species
from fishing mortality [45,51].
Variations of site fidelity and total detecting period among individuals may be attributed to
fish behavior or to the limitations of the number of receivers in this study.Sebastesspecies
exhibit a strong affinity for heterogeneous and structured rocky habitat [38,39], and another
black rockfish,Sebastes inermis, shelters in rock crevices during the day [42]. The use of
struc-tured habitat may result in a decline in detections. If the use of strucstruc-tured habitat was pro-longed (e.g., if individuals remained in the rock crevices all day), this would have led to an observed but false reduction in the site fidelity index. The use of structured habitat may there-fore explain why some tagged fish, such as fish 332, were detected for the entire tracking period but had an unexplained dramatic drop in detection during some periods (e.g., 5/08, 12/08). An alternative behavioral explanation for the site fidelity variation and the disappearance of tagged
fish from the acoustic array is thatS.schlegeliimay use spatial areas larger than those covered
by our receiver array. Although highly infrequent, we observed a maximum horizontal distance
of 550 m in our study. In fact, Kang and Shin [82] reported thatS.schlegeliimoved 2 km away
Fig 7. Chronogram of tide height and corrected depth of taggedS.schlegeliiover the tracking period.
from their release points to regions between small islands or coastal areas. Being fished out may be another reason for the perpetual disappearance during the tracking period. The site fidelity and spatial utilization of the species should be assessed further with more sophisticated tracking experiments, including greater coverage of the tracking area and an increased number of tagged fish, on which our work provides a good guideline.
Fig 8. Wavelet sample spectrums using a Morlet wavelet for corrected depths of 5 tagged individuals.
doi:10.1371/journal.pone.0134381.g008
Table 4. Total number of days that taggedS.schlegeliiexhibited each type of vertical movement behavior.
ID LV SV BD
326 4 15 0
329 3 3 24
330 0 3 35
332 1 9 36
333 1 17 1
334 5 4 13
LV, large vertical movement behavior; SV, small vertical movement; BD, bottom dwelling behavior.
2. Diel detection pattern
A common feature of the spatial and temporal behavior of rockfishes of the genusSebastesis
that their behaviors differ between day and night [83,84]. This divergent behavioral pattern
suggests that rockfish activity is closely related to ambient light intensity and that sunset and
sunrise determine changes in behavioral state [38]. However, this pattern is not consistent
amongSebastesspecies; some species are more active during the day, others during the night,
and some exhibit no diel behavioral patterns. For example, the rosethorn rockfishSebastes
hel-vomaculatusexhibits a clear diurnal activity pattern (active during the day and inactive at
night) [85]. Similarly,S.mystinusis more active during the day than at night, as indicated by a
steep decrease in detection rates at dusk and resuming to the high level at dawn [38]. By
con-trast,S.inermisremains buried in rock crevices during the day but ranges between the surface
and very deep depths at night [42]. In the present study,S.schlegeliiwas more frequently
detected during the day than night, which is interpreted as a day active behavior [70].
However, the diel detection pattern ofS.schlegeliiwas neither as evident nor as strong as
those observed forSebastesspp. or other species (e.g.,S.mystimus[38] andSerranus cabrilla
[73]). The CWT of tagged individuals indicates that the diel pattern was not consistent
throughout the study period and suggests that the diel pattern is weak in this species. Different reasons could explain this result. First, this inconsistency may be due to the high relief AR
habi-tat at our study site. The diel pattern ofDiplodus sargusdiffers from a diurnal pattern (higher
detections in daytime than during the night) at natural reefs to a nocturnal pattern (higher
detections in the night than during the day time) at ARs [10]. These authors further inferred
that NR resident fish search for food during the day and shelter in crevices during the night,
while the AR resident fish were active during the night and rested in the day [10]. Second, the
variation in diel pattern detection may be caused by diel vertical movement. For a period of one week, LV was observed for fish 326, 329 and 334 in our study after correcting depth by tide
height (Fig 7andTable 4).S.schlegeliimoved to shallow water at night but returned to the
deep water (i.e., closer to the receivers) during the day, which may have contributed to the higher hourly detections during the day compared to night. Unfortunately, with our experi-mental approach, we can not provide robust cause-and-effect evidence for this observed diel behavior, and we need further fine-scale tracking information to provide the exact mechanism generating these day and night differential behaviors that our approach has revealed.
3. Habitat use
We identified habitat preferences/avoidances for those periods during which fish were detected using HSI, under the limitation that the receiver detecting range was interpreted as the fish activity zone. HSI has been successfully used to describe the habitat preferences of various
spe-cies. For example, Topping et al. [78] observed that California sheepheadSemicossyphus
pul-cherfavor habitats covered by boulders and rock walls rather than mud or sand. Alós et al. [73]
established thatS.cabrillaspends much more time on soft, gravel and detritus bottoms than in
seagrass meadows (i.e.,Posidonia oceanicabeds). In this study, we provide some new
informa-tion about the habitat utilizainforma-tion ofS.schlegelii, on those habitats that include ARs. NR habitats
and those habitats including ARs (i.e., BCG + AR and SB + AR) produced higher positive HSI
values, suggesting that the preference ofS.schlegeliifor ARs is second only to that for natural
reefs.
Habitat enhancement via the deployment of ARs has been a widely used management and
conservation tool worldwide [86,87]. There is strong evidence that the implementation of ARs
[88–90]. AR restoration has been shown to mitigate rockfish population loss in many studies
[91–93] and, in general, rockfish habitat utilization is closely linked to habitat complexity [81].
In fact, rockfish exhibit a strong affinity for rugged geomorphological features [38,94,95] and
the heterogeneous and structured habitat of rocky substrates [39,96,97]. Reynolds et al. [81]
demonstrated the potential of ARs to provide quality habitat forS.caurinusalong the Alaskan
convergent transform plate boundary. The results of our study agree with these previous find-ings for other species, and we suggest that ARs create quality habitat and serve as attractants
forS.schlegelii.
4. Vertical movement
The results on the water column use indicate thatS.schlegeliiare mainly found at an average
depth of 20.90 m (ranging from 16 m to 31 m).S.schlegeliiis a demersal rockfish and remained
closer to the bottom for a large portion of the tracking period in our study (Table 4). In another
study, the black rockfishSebastes melanopsalso remained close to the bottom; the proposed
explanation for this behavior was that it enabled fish to avoid the water turbulence from wave
action and storm activity [41].
Vertical movement ofS.schlegelii(corrected by tide height) was highly variable among diel
pattern (24 h periodicity), semi-diurnal pattern (12 h periodicity) and no periodicity pattern, as revealed by CWT. The observed patterns were separate from any other environmental effects, as the CWT of control tags did not exhibit any periodicity in the probability of detec-tion. The diel pattern of vertical movement has been observed for many different species of
Sebastesgenus. For example,S.paucispinisandS.mystinusexhibit frequent vertical movements
in shallow water during the day but move to deeper water and remain sedentary during the
night [98,37].S.inermisare in the shallow water around rock crevices during daytime and
make frequent vertical movements at night [42]. Diel vertical migrations ofS.melanops
occurred for more than a week, with individuals being shallower either during the day in spring
or at night in autumn [80]. Without considering the area lag in predicted tide height of our
small study area, the semi-diurnal pattern of corrected depth may be caused by the location-dependent component of tide height.
For the three periodical patterns ofS.schlegeliivertical movement, we can not fully identify
the exact mechanisms. In fact, considering the limitations of our experimental design, the
verti-cal behavior observed inS.schlegeliican be caused by vertical and horizontal displacement as
observed inS.inermis[42]. But our study has revealed that the population ofS.schlegeliicould
show a high degree of individual variability in vertical behavior. The individual pattern of verti-cal migration is an important component defining the vulnerability of an individual fish to the
fishing gear. For example, Olsen et al. [40] found that Atlantic codGadus morhuaindividuals
performing stronger diel migrations were more prone to be captured than those individuals
with less evident migrations. The vertical movement ofS.schlegeliishould be studied further
with increased tagged fish and fine scale movement to test whether the individuals with
stron-ger vertical migrations are more susceptible to be captured as in the case ofG.morhua, and
whether vertical migration affects the population dynamics due to fishing activity.
Finally, our work has provided some new information on temporal and spatial behaviors of
S.schlegelii, which is heavily exploited in Japan and China. Some additional topics aboutS.
schlegeliimovement behavior are expected to be studied further to promote the sustainability
of the fishery: 1) the effective size of an MPA forS.schlegelii; 2) the diel activity levels ofS.
schlegeliiat heterogeneous bottoms (e.g. AR); 3) the mechanisms responsible for vertical
move-ments ofS.schlegeliiand the contribution of vertical migrations to overexploitation
that is primarily used by the exploited fish [13], and therefore there is a need for a long-term tracking experiment using a large number of receivers and fish tags to determine the space uti-lization of this species over the large part of its lifespan. Fish are expected to vary in behavioral
types [99], and further examination of the consistency and repeatability of these diel behaviors
and vertical movements would establish whether there are differentS.schlegeliibehavioral
types and the cause of those behaviors, which have strong implications for fisheries
sustainabil-ity [100]. This study is a useful baseline for ecologists and fishery scientists in future acoustic
tracking experiments that will address these questions. These results greatly contribute to our understanding of this economically important and vulnerable species.
Supporting Information
S1 Fig. The depth around Ping Island surveyed by multi-beam sounding system. (TIF)
S2 Fig. The bottom types determined by EdgeTech 4100 Side Scan Sonar System. (TIF)
S3 Fig. The dense routes of seagrass survey using Simrad EY60 split-beam at 200 kHz. (TIF)
S4 Fig. Chronogram of depth collected from fish tags over the tracking period. (TIF)
S5 Fig. Wavelet sample spectrums using a Morlet wavelet for depths of 5 tagged individu-als.
(TIF)
S1 Table. The linear mixed model (in thelmertestlibrary in R) results on effects of tide height on depth collected from fish tags, in which ID and date were treated as random fac-tors.
(DOCX)
S1 Video. Seagrass at rocky bottom around Ping Island videoed by the LBV150-4. (MP4)
S2 Video. Natural reef bottom around Ping Island videoed by the LBV150-4. (MP4)
S3 Video. Boulder, cobble and gravel bottoms around Ping Island videoed by the LBV150-4.
(MP4)
S4 Video. Sandy bottom around Ping Island videoed by the LBV150-4. (MP4)
S5 Video. Cement reefs around Ping Island videoed by the stereo-DOV. (MP4)
S6 Video. A sunken steel vessel around Ping Island videoed by the stereo-DOV. (MP4)
Acknowledgments
We thank Prof. Yi Zhou and Prof. Yong Tang for assistance and advice during the writing of this manuscript. We also thank Qingyuan Liu, Hongye Zhang, Jiehua Hao and the crew of the Qiansan Islets Aquatic Products Development Co. Ltd. for assistance with receiver placement, attachment of fish tags and retrieval of receiver data.
Author Contributions
Conceived and designed the experiments: YZ QX JA HL QZX HY. Performed the experiments: YZ QX HL QZX HY. Analyzed the data: YZ QX JA HL QZX HY. Contributed reagents/materi-als/analysis tools: YZ JA HL QX. Wrote the paper: YZ QX JA HY.
References
1. Pauly D, Alder J, Bennett E, Christensen V, Tyedmers P, Watson R (2003) The future for fisheries. Science 302 (5649): 1359–1361. doi:10.1126/science.1088667PMID:14631031
2. Worm B, Barbier EB, Beaumont N, Duffy JE, Folke C, Halpern BS, et al. (2006) Impacts of biodiversity loss on ocean ecosystem services. Science 314 (5800): 787–790. doi:10.1126/science.1132294
PMID:17082450
3. Worm B, Hilborn R, Baum JK, Branch TA, Collie JS, Costello C, et al. (2009) Rebuilding global fisher-ies. Science 325 (5940): 578–585. doi:10.1126/science.1173146PMID:19644114
4. Pauly D, Christensen V, Dalsgaard J, Froese R, Torres F (1998) Fishing down marine food webs. Sci-ence 279 (5352): 860–863. doi:10.1126/science.279.5352.860PMID:9452385
5. Myers RA, Worm B (2005) Extinction, survival or recovery of large predatory fishes. Phil Trans R Soc B 360 (1453): 13–20. doi:10.1098/rstb.2004.1573PMID:15713586
6. Mullon C, Freon P, Cury P (2005) The dynamics of collapse in world fisheries. Fish Fish 6 (2): 111– 120. doi:10.1111/j.1467-2979.2005.00181.x
7. Lorenzen K, Steneck RS, Warner RR, Parma AM, Coleman FC, Leber KM (2010) The spatial dimen-sions of fisheries: putting it all in place. Bull Mar Sci 86 (2): 169–177.
8. Parkinson EA, Post JR, Cox SP (2004) Linking the dynamics of harvest effort to recruitment dynamics in a multistock, spatially structured fishery. Can J Fish Aquat Sci 61 (9): 1658–1670. doi: 10.1139/f04-101
9. Hilborn R, Walters C (1992) Quantitative fisheries stock assessment: choice, dynamics and uncer-tainty. Chapman and Hall Inc., New York. 570 p.
10. Koeck B, Alós J, Caro A, Neveu R, Crec'hriou R, Saragoni G, et al. (2013) Contrasting fish behavior in artificial seascapes with implications for resources conservation. PLoS ONE 8 (7): e69303. doi:10. 1371/journal.pone.0069303PMID:23935978
11. Botsford LW, Brumbaugh DR, Grimes C, Kellner JB, Largier J, O'Farrell MR, et al. (2009) Connectiv-ity, sustainabilConnectiv-ity, and yield: bridging the gap between conventional fisheries management and marine protected areas. Rev Fish Biol Fish 19 (1): 69–95. doi:10.1007/s11160-008-9092-z
12. Block BA, Teo SLH, Walli A, Boustany A, Stokesbury MJW, Farwell CJ, et al. (2005) Electronic tag-ging and population structure of Atlantic bluefin tuna. Nature 434 (7037): 1121–1127. doi:10.1038/ nature03463PMID:15858572
13. Kramer D, Chapman M (1999) Implications of fish home range size and relocation for marine reserve function. Environ Biol Fishes 55 (1–2): 65–79. doi:10.1023/A:1007481206399
14. Abernethy KE, Allison EH, Molloy PP, Côté IM (2007) Why do fishers fish where they fish? Using the ideal free distribution to understand the behaviour of artisanal reef fishers. Can J Fish Aquat Sci 64 (11): 1595–1604. doi:10.1139/f07-125
15. Alós J, Palmer M, Arlinghaus R (2012) Consistent selection towards low activity phenotypes when catchability depends on encounters among human predators and fish. PLoS ONE 7 (10): e48030. doi:10.1371/journal.pone.0048030PMID:23110164
16. Bertrand S, Díaz E, Ñiquen M (2004) Interactions between fish and fisher's spatial distribution and behaviour: an empirical study of the anchovy (Engraulis ringens) fishery of Peru. ICES J Mar Sci 61 (7): 1127–1136. doi:10.1016/j.icesjms.2004.07.016
17. Cabanellas-Reboredo M, Alós J, March D, Palmer M, JordàG, Palmer M (2014) Where and when will
18. Post JR, Persson L, Parkinson EA, Kooten Tv (2008) Angler numerical response across landscapes and the collapse of freshwater fisheries. Ecol Appl 18 (4): 1038–1049. doi:10.1890/07-0465.1PMID:
18536261
19. Cooke SJ, Hinch SG, Wikelski M, Andrews RD, Kuchel LJ, Wolcott TG, et al. (2004) Biotelemetry: a mechanistic approach to ecology. Trends Ecol Evol 19 (6): 334–343. doi:10.1016/j.tree.2004.04.003 PMID:16701280
20. Bertrand S, Bertrand A, Guevara-Carrasco R, Gerlotto Fo (2007) Scale-invariant movements of fisher-men: the same foragning strategy as natural predators. Ecol Appl 17 (2): 331–337. doi:
10.1890/06-0303PMID:17489242
21. Heupel MR, Semmens JM, Hobday AJ (2006) Automated acoustic tracking of aquatic animals: scales, design and deployment of listening station arrays. Mar Freshw Res 57 (1): 1–13. doi:10.
1071/mf05091
22. Pedersen MW, Weng KC (2013) Estimating individual animal movement from observation networks. Methods Ecol Evol 4 (10): 920–929. doi:10.1111/2041-210x.12086
23. Alós J, Cabanellas-Reboredo M, Lowerre-Barbieri S (2012) Diel behaviour and habitat utilisation by the pearly razorfish during the spawning season. Mar Ecol Prog Ser 460: 207–220. doi:10.3354/ meps09755
24. Abecasis D, Erzini K (2008) Site fidelity and movements of gilthead sea bream (Sparus aurata) in a coastal lagoon (Ria Formosa, Portugal). Estuar Coast Shelf Sci 79 (4): 758–763. doi:10.1016/j.ecss. 2008.06.019
25. Koeck B, Pastor J, Saragoni G, Dalias N, Payrot J, Lenfant P (2014) Diel and seasonal movement pat-tern of the dusky grouperEpinephelus marginatusinside a marine reserve. Mar Environ Res 94: 38– 47. doi:10.1016/j.marenvres.2013.12.002PMID:24361257
26. Jadot C, Donnay A, Acolas ML, Cornet Y, Anras MLB (2006) Activity patterns, home-range size, and habitat utilization ofSarpa salpa(Teleostei: Sparidae) in the Mediterranean Sea. ICES J Mar Sci 63 (1): 128–139. doi:10.1016/j.icesjms.2005.06.010
27. Botsford LW, Micheli F, Hastings A (2003) Principles for the design of marine reserves. Ecol Appl 13 (sp1): 25–31. doi:10.1890/1051-0761(2003)013[0025:PFTDOM]2.0.CO;2
28. Heupel MR, Simpfendorfer CA (2005) Using acoustic monitoring to evaluate MPAs for shark nursery areas: the importance of long-term data. Mar Technol Soc J 39 (1): 10–18.
29. Parsons D, Egli D (2005) Fish movement in a temperate marine reserve: New insights through appli-cation of acoustic tracking. Mar Technol Soc J 39 (1): 56–63.
30. Levin PS, Holmes EE, Piner KR and Harvey CJ (2006) Shifts in a Pacific ocean fish assemblage: the potential influence of exploitation. Conserv Biol 20 (4): 1181–1190. doi:10.1111/j.1523-1739.2006.
00400.xPMID:16922234
31. Williams GD, Levin PS, Palsson WA (2010) Rockfish in Puget Sound: an ecological history of exploi-tation. Mar Policy 34 (5): 1010–1020. doi:10.1139/F01-191
32. NMFS (2008) Preliminary scientific conclusions of the review of the status of 5 species of rockfish: bocaccio (Sebastes paucispinis), canary rockfish (Sebastes pinniger), yelloweye rockfish (Sebastes ruberrimus), greenstriped rockfish (Sebastes elongatus) and redstripe rockfish (Sebastes proriger) in Puget Sound, Washington. National Marine Fisheries Service.
33. Parker SJ, Berkeley SA, Golden JT, Gunderson DR, Heifetz J, Hixon MA, et al. (2000) Management of Pacific rockfish. Fisheries 25 (3): 22–30. doi:10.1577/1548-8446(2000)025<0022:mopr>2.0.co;2
34. Baskett ML, Yoklavich M, Love MS (2006) Predation, competition, and the recovery of overexploited fish stocks in marine reserves. Can J Fish Aquat Sci 63 (6): 1214–1229. doi:10.1139/F06-013
35. Xu BD, Jin XS (2005) Variations in fish community structure during winter in the southern Yellow Sea over the period 1985–2002. Fish Res 71 (1): 79–91. doi:10.1016/j.fishres.2004.07.011
36. Magnuson-Ford K, Ingram T, Redding DW, Mooers AØ(2009) Rockfish (Sebastes) that are
evolution-arily isolated are also large, morphologically distinctive and vulnerable to overfishing. Biol Conserv 142 (8): 1787–1796. doi:10.1016/j.biocon.2009.03.020
37. Green KM, Greenley AP, Starr RM (2014) Movements of blue rockfish (Sebastes mystinus) off Central California with comparisons to similar species. PLoS ONE 9 (6): e98976. doi:10.1371/journal.pone. 0098976PMID:24902049
38. Jorgensen SJ, Kaplan DM, Klimley AP, Morgan SG, O'Farrell MR, Botsford LW (2006) Limited move-ment in blue rockfishSebastes mystinus: internal structure of home range. Mar Ecol Prog Ser 327: 157–170. doi:10.3354/meps327157
39. Hannah RW, Rankin PS (2011) Site fidelity and movement of eight species of pacific rockfish at a high-relief rocky reef on the Oregon Coast. N Am J Fish Manage 31 (3): 483–494. doi:10.1080/
40. Olsen EM, Heupel MR, Simpfendorfer CA, Moland E (2012) Harvest selection on Atlantic cod behav-ioral traits: implications for spatial management. Ecol Evol 2 (7): 1549–1562. doi:10.1002/ece3.244 PMID:22957161
41. Green KM, Starr RM (2011) Movements of small adult black rockfish: implications for the design of MPAs. Mar Ecol Prog Ser 436: 219–230. doi:10.3354/meps09263
42. Mitamura H, Uchida K, Miyamoto Y, Arai N, Kakihara T, Yokota T, et al. (2009) Preliminary study on homing, site fidelity, and diel movement of black rockfishSebastes inermismeasured by acoustic telemetry. Fish Sci 75 (5): 1133–1140. doi:10.1007/s12562-009-0142-9
43. Deegan LA, Buchsbaum R (2005) The effect of habitat loss and degradation on fisheries. In: Robert B., Judith P. and William R. E., editors. The decline of disheries resources in New England: Evaluating the impact of overfishing, contanmination, and habitat degradation. Massachusetts: MIT Sea Grant College Program. p. 67–96.
44. Nakagawa M, Okouchi H, Adachi J, Hattori K, Yamashita Y (2007) Effectiveness of stock enhance-ment of hatchery-released black rockfishSebastes schlegeliin Yamada Bay—evaluation by a fish market survey. Aquaculture 263 (1–4): 295–302. doi:10.1016/j.aquacutlure.2006.10.023
45. Chin BS, Nakagawa M, Noda T, Wada T, Yamashita Y (2013) Determining optimal release habitat for black rockfish,Sebastes schlegelii: examining growth rate, feeding condition, and return rate. Rev Fish Sci 21 (3–4): 286–298. doi:10.1080/10641262.2013.837364
46. Chin B-S, Nakagawa M, Tagawa M, Masuda R, Yamashita Y (2010) Ontogenetic changes of habitat selection and thyroid hormone levels in black rockfish (Sebastes schlegelii) reared in captivity. Ichthyol Res 57 (3): 278–285. doi:10.1007/s10228-010-0165-3
47. Liu H, Xu Q, Xu Q, Zhang Y, Yang H (2014) The application of stereo-video technology for the assess-ment on population change of black rockfishSebastes schlegeliin a vessel reef area in Haizhou Bay, China. Chin J Oceanol Limnol: 1–7. doi:10.1007/s00343-015-4049-2
48. Lü H, Zhang X, Fu M, Xi D, Gao T (2014) Use of tetracycline hydrochloride and alizarin complexone for immersion marking black rockfishSebastes schlegelii. Chin J Oceanol Limnol 32 (4): 810–820. doi:10.1007/s00343-014-3252-x
49. Nakagawa M (2008) Studies on the stock enhancement technology of the black rockfishSebastes schlegeli. Bull Fish Res Agency 25 (25): 223–287.
50. Liu L (2012) The study on the marine protected areas construction in Shandong Province. Mar Envi-ron Sci 31 (6): 918–952. doi:1007-6336(2012)06-0918-05(in Chinese with English abstract) 51. Ding Z (2007) Rizhao Qiansan Islets artificial reefs placement progress. Available:http://www.hssd.
gov.cn/article/news/20074/news_15051.asp
52. Li L (2012) Rizhao Qiansan Island sea bottom cultivation farm project. Department of Commerce of Shandong Province. Available:http://www.trade.gov.cn/project/52186.html
53. Sun L (2010) Evaluation of artificial reef construction in Shandong Province. Ocean University of China. 104 p. (in Chinese with English abstract)
54. Jenkins JA, Bart HL, Bowker JD, Bowser PR, MacMillan JR, Nickum JG, et al. (2014) Guidelines for use of fishes in research—Revised and expanded. Fisheries 39 (9): 415–416. doi:10.1080/ 03632415.2014.924408
55. Gong Z, Tai J, Zhang D (2002) Impacts of land pollution sources on Haizhou Bay environment. J Hohai Univ 30 (4): 5–8. doi:1000-1980(2002)04-0005-04(in Chinese with English abstract) 56. Xie F, Pang Y, Song Z (2007) Three-dimensional numerical simulation of tidal current in offshore area
of Haizhou Bay. J Hohai Univ 35 (6): 718–721. doi:1000-1980(2007)06-0718-04(in Chinese with English abstract)
57. Villegas-Ríos D, Alós J, March D, Palmer M, Mucientes G, Saborido-Rey F (2013) Home range and diel behavior of the ballan wrasse,Labrus bergylta, determined by acoustic telemetry. J Sea Res 80: 61–71. doi:10.1016/j.seares.2013.02.009
58. Clements S, Jepsen D, Karnowski M, Schreck CB (2005) Optimization of an acoustic telemetry array for detecting transmitter-implanted fish. N Am J Fish Manage 25 (2): 429–436. doi:10.1577/m03-224. 1
59. Simpfendorfer CA, Heupel MR, Collins AB (2008) Variation in the performance of acoustic receivers and its implication for positioning algorithms in a riverine setting. Can J Fish Aquat Sci 65 (3): 482– 492. doi:10.1139/F07-180
60. Espinoza M, Farrugia TJ, Webber DM, Smith F, Lowe CG (2011) Testing a new acoustic telemetry technique to quantify long-term, fine-scale movements of aquatic animals. Fish Res 108 (2–3): 364– 371. doi:10.1016/j.fishres.2011.01.011
62. How JR, de Lestang S (2012) Acoustic tracking: issues affecting design, analysis and interpretation of data from movement studies. Mar Freshw Res 63 (4): 312–324. doi:10.1071/MF11194
63. Payne NL, Gillanders BM, Webber DM, Semmens JM (2010) Interpreting diel activity patterns from acoustic telemetry: the need for controls. Mar Ecol Prog Ser 419: 295–301. doi:10.3354/meps08864
64. Bridger CJ, Booth RK (2003) The effects of biotelemetry transmitter presence and attachment proce-dures on fish physiology and behavior. Rev Fish Sci 11 (1): 13–34. doi:10.1080/
16226510390856510
65. Crook D (2004) A method for externally attaching radio transmitters to minimize dermal irritation. J Fish Biol 64 (1): 258–261. doi:10.1046/j.1095-8649.2003.00282.x
66. Mellas EJ and Haynes JM (1985) Swimming performance and behavior of rainbow trout (Salmo gaird-neri) and white perch (Morone americana): effects of ettaching telemetry transmitters. Can J Fish Aquat Sci 42 (3): 488–493. doi:10.1139/f85-066
67. Meyer CG, Holland KN, Papastamatiou YP (2007) Seasonal and diel movements of giant trevally Car-anx ignobilisat remote Hawaiian atolls: implications for the design of marine protected areas. Mar Ecol Prog Ser 333 (1). doi:10.3354/meps333013
68. Simpfendorfer CA, Heupel MR, Hueter RE (2002) Estimation of short-term centers of activity from an array of omnidirectional hydrophones and its use in studying animal movements. Can J Fish Aquat Sci 59 (1): 23–32. doi:10.1139/F01-191
69. Alós J, Cabanellas-Reboredo M (2012) Experimental acoustic telemetry experiment reveals strong site fidelity during the sexual resting period of wild brown meagre,Sciaena umbra. J Appl Ichthyol 28 (4): 606–611. doi:10.1111/j.1439-0426.2012.01955.x
70. March D, Palmer M, Alós J, Grau A, Cardona F (2010) Short-term residence, home range size and diel patterns of the painted comberSerranus scribain a temperate marine reserve. Mar Ecol Prog Ser 400: 195–206. doi:10.3354/meps08410
71. Gaucherel C (2011) Wavelet analysis to detect regime shifts in animal movement. Computational Ecology and Software 1 (2): 69–85.
72. Percival D and Walden A (2000) Wavelet methods for time series analysis. Cambridge University Press, Cambridge, England, 594 pp.
73. Alós J, March D, Palmer M, Grau A, Morales-Nin B (2011) Spatial and temporal patterns inSerranus cabrillahabitat use in the NW Mediterranean revealed by acoustic telemetry. Mar Ecol Prog Ser 427: 173–186. doi:10.3354/meps09042
74. Maraun D, Kurths J, Holschneider M (2007) Nonstationary gaussian processes in wavelet domain: synthesis, estimation, and significance testing. Phys Rev E 75 (1). doi:10.1103/PhysRevE.75. 016707
75. Zuur AF, Ieno EN, Walker NJ, Saveliev AA, Smith GM (2009) Mixed effects models and extensions in ecology with R. New York: Springer.
76. Lindén A, Mäntyniemi S (2011) Using the negative binomial distribution to model overdispersion in ecological count data. Ecology 92 (7): 1414–1421. doi:10.1890/10-1831.1PMID:21870615
77. Aho K, Derryberry D, Peterson T (2014) Model selection for ecologists: the worldviews of AIC and BIC. Ecology 95 (3): 631–636. doi:10.1890/13-1452.1PMID:24804445
78. Topping DT, Lowe CG, Caselle JE (2005) Home range and habitat utilization of adult California sheephead,Semicossyphus pulcher(Labridae), in a temperate no-take marine reserve. Mar Biol 147 (2): 301–311. doi:10.1007/s00227-005-1573-1
79. Padman L, Erofeeva S (2005) Tide Model Driver (TMD) manual. Earth and Space Research. 80. Parker SJ, Olson JM, Rankin PS, Malvitch JS (2008) Patterns in vertical movements of black rockfish
Sebastes melanops. Aquat Biol 2: 57–65. doi:10.3354/ab00036
81. Reynolds BF, Powers SP, Bishop MA (2010) Application of acoustic telemetry to assess residency and movements of rockfish and lingcod at created and natural habitats in Prince William Sound. PLoS ONE 5 (8): e12130. doi:10.1371/journal.pone.0012130PMID:20730090
82. Kang K-M, Shin H-O (2006) Movement ranges and routes of black rockfishSebastes schlegeliin sum-mer and autumn from acoustic telemetry. J Fish Sci Technol 9 (2): 91–96.
83. Stanley RD, Kieser R, Leaman BM, Cooke KD (1999) Diel vertical migration by yellowtail rockfish, Sebastes flavidus, and its impact on acoustic biomass estimation. Fish Bull 97 (2): 320–331. 84. Gauthier S, Rose G (2002) Acoustic observation of diel vertical migration and shoaling behaviour in
Atlantic redfishes. J Fish Biol 61 (5): 1135–1153. doi:10.1006/jfbi.2002.2128
86. Addis DT, Patterson WF, Dance MA, Ingram GW (2013) Implications of reef fish movement from unre-ported artificial reef sites in the northern Gulf of Mexico. Fish Res 147: 349–358. doi:10.1016/j.
fishres.2013.07.011
87. Baine M (2001) Artificial reefs: a review of their design, application, management and performance. Ocean Coast Manage 44 (3–4): 241–259. doi:10.1016/s0964-5691(01)00048-5
88. Syc TS and Szedlmayer ST (2012) A comparison of size and age of red snapper (Lutjanus campecha-nus) with the age of artificial reefs in the northern Gulf of Mexico. Fish Bull 110 (4): 458–469. 89. Arena PT, Jordan LKB, Spieler RE (2007) Fish assemblages on sunken vessels and natural reefs in
southeast Florida, USA. Hydrobiologia 580: 157–171. doi:10.1007/s10750-006-0456-x
90. Leitao F, Santos MN, Erzini K, Monteiro CC (2009)Diplodus spp. assemblages on artificial reefs: importance for near shore fisheries. Fish Manage Ecol 16 (2): 88–99. doi:10.1111/j.1365-2400.2008.
00646.x
91. Rilov G, Benayahu Y (1998) Vertical artificial structures as an alternative habitat for coral reef fishes in disturbed environments. Mar Environ Res 45 (4–5): 431–451. doi:10.1016/s0141-1136(98)00106-8 92. Carr MH, Hixon MA (1997) Artificial reefs: the importance of comparisons with natural reefs. Fisheries
22 (4): 28–33. doi:10.1577/1548-8446(1997)022<0028:artioc>2.0.co;2
93. Rilov G, Benayahu Y (2000) Fish assemblage on natural versus vertical artificial reefs: the rehabilita-tion perspective. Mar Biol 136 (5): 931–942. doi:10.1007/s002279900250
94. Gary Greene H, O’Connell VM and Brylinsky CK (2011) Tectonic and glacial related seafloor geomor-phology as possible demersal shelf rockfish habitat surrogates—examples along the Alaskan conver-gent transform plate boundary. Cont Shelf Res 31 (2): S39–S53. doi:10.1016/j.csr.2010.11.004
95. Krieger KJ (1993) Distribution and abundance of rockfish determined from a submersible and by bot-tom trawling. Fish Bull 91 (1): 87–96.
96. Garcia-Charton JA, Perez-Ruzafa A (2001) Spatial pattern and the habitat structure of a Mediterra-nean rocky reef fish local assemblage. Mar Biol 138 (5): 917–934. doi:10.1007/s002270000524 97. Claisse JT, Pondella DJ II, Love M, Zahn LA, Williams CM, Williams JP, et al. (2014) Oil platforms off
California are among the most productive marine fish habitats globallyle. Proc Natl Acad Sci U S A 111 (43): 15462–15467. doi:10.1073/pnas.1411477111PMID:25313050
98. Starr RM, Heine JN, Felton JM, Cailliet GM (2002) Movements of bocaccio (Sebastes paucispinis) and greenspotted (S.chlorostictus) rockfishes in a Monterey submarine canyon: implications for the design of marine reserves. Fish Bull 100 (2): 324–337.
99. Conrad JL, Weinersmith KL, Brodin T, Saltz JB, Sih A (2011) Behavioural syndromes in fishes: a review with implications for ecology and fisheries management. J Fish Biol 78 (2): 395–435. doi:10.
1111/j.1095-8649.2010.02874.xPMID:21284626