Æ. íàíî- åëåêòðîí. ô³ç./ J. Nano- Electron. Phys. 2010. – Ò.2, ¹4. – Ñ. 5-11
2010 ÑóìÄÓ (Ñóìñüêèé äåðæàâíèé óí³âåðñèòåò)
5 PACS numbers: 81.07.Bc, 78.67.Bf
ESTIMATION OF SIZE AND CONCENTRATION OF SILVER NANOPARTICLES IN AQUEOUS SUSPENSIONS FROM EXTINCTION
SPECTRA
S.Z. Malynych
V.E. Lashkaryov Institute for Physics of Semiconductors NAS of Ukraine, 41, Nauky Avenue, 03028, Kyiv, Ukraine
E-mail: [email protected]
The size and concentration of silver nanoparticles suspended in water can be easily determined from their extinction spectra. This is due to the strong correlation of the localized surface plasmon resonances which are excited by electromagnetic radiation inside nanoparticles with size and shape of metal nanoparticles. Calibration curve obtained from Mie theory calculations for silver nanoparticles suspended in water is presented. A comparison with published experimental data is also discussed.
Keywords: SILVER NANOPARTICLES, COLLOID, EXTINCTION SPECTRA, LOCALIZED SURFACE PLASMON RESONANCE.
(Received 26 November 2010, in final form 29 December 2010)
1. INTRODUCTION
Growing interest in the physical properties of metal nanoparticles observed over the last decades caused by their wide potential applications in modern science and technology. These applications embrace single molecule surface enhanced Raman scattering [1], nonlinear optics [2], and photovoltaics [3]. The unique optical properties of noble metal nanoparticles, especially gold and silver make them an appealing platform for biosensing [4] and fluore-scence-based biochips [5]. Recently, a colorimetric method with gold nano-particles in DNA-dispersed solution, in which the plasmon absorption band of gold nanoparticles determined DNA hybridization, has been reported [6]. For most biomedical applications it is essential to determine the size and concentration of the nanoparticles dispersed in a carrying substance. Direct measurement of the nanoparticles size using TEM is expensive and time-con-suming although it provides high accuracy in particle sizing. The methods based on dynamic light scattering are widely used but they are limited by a model of Brownian motion for spherical particles. At the same time there is no well-developed technique for concentration measurements of nanoparticles. In every-day laboratory practice it is desired to have low-cost, simple and fast method for the determination of nanoparticle size and concentration. Since the optical properties of metal nanoparticles are governed by its size and shape as well as the dielectric function of the particle and surrounding medium it is highly expected to use optical spectroscopy as an express tool for monitoring the particles size and concentration.
6 S.Z. MALYNYCH
to determine the size and concentration of gold nanoparticles from the extinction spectra. It should be mentioned here that most papers considering analytical tools for the characterization of metal nanoparticle suspensions are mainly devoted to gold nanoparticles. This is due to low chemical acti-vity of gold metal and well-developed nanoparticle synthesis technique. Among noble metals silver possesses the highest interband threshold that amounts 3,9 eV, while for Au and Cu it occurred at 2,4 and 2,1 eV respectively [8]. Thus, contribution of free electrons dominates in the optical response of silver nanoparticles. It means that the excitations in Ag nanoparticles have lower damping rates in compare to other noble metals, which makes them more favorable for photonic applications. Despite vast of works on physical properties and synthesis of silver nanoparticles there is lack of papers focusing on the experimental determination of size and concentration from their optical spectra. Systematic optical studies of Ag NPs ranging in size from 20 to 200 nm were performed by Chumanov and co-workers [9]. Here, we compare published experimental data on spectral properties of Ag nano-particles depending on size and concentration with Mie theory simulations. 2. THEORETICAL CONSIDERATIONS
Optical response of metal nanoparticles results from the excitation of the conduction electrons coupled to the electromagnetic field. These modes are non-propagating and thus are termed Localized Surface Plasmon Resonances (LSPR). On the other hand, LSPR arise naturally from the scattering prob-lem of a small, sub-wavelength conductive nanoparticle in an oscillating electro-magnetic field. Surprisingly enough, a complete theory of the scattering and absorption of electromagnetic radiation by a sphere developed by G. Mie in 1908 does not use the notion of surface plasmons, but completely describes the distribution of electromagnetic radiation in far-field. Nowadays that theory is widely used and is treated in a variety of books.
According to Mie theory the extinction, scattering, and absorption cross-sections of spherical particles of arbitrary size can be calculated by series expansion of the internal and scattered fields into a set of partial waves described by vector harmonics:
2 1 2
2 1 Re
ext L L
L
C L a b
k 2 2 2 1 2 2 1
sca L L
L
C L a b
k
abs ext sca
C C C (1)
with
' '
' '
L L L L
L
L L L L
m mx x x mx
a
m mx x mx
' '
' '
L L L L
L
L L L L
mx x m x mx
b
ESTIMATION OF SIZE AND CONCENTRATION… 7
where m n/nm, n and nm are the complex refractive index of the
nano-particle and real refractive index of the surrounding medium respectively, k is the wave vector, x |k|R is the size parameter, L, L are Riccati-Bessel
cylindrical functions. The prime indicates differentiation with respect to the argument. The summation index L gives the order of the partial wave, L 1 corresponds to dipole fields, L 2 to quadrupole, L 3 to octupole fields and so on. From the analysis of Eq. (1) follows that spectral position of plasmon resonance strongly depends on the size of a particle. Namely, Mie theory predicts a shift of LSPR towards longer wavelength with increasing the diameter of a particle. The red shift is a consequence of retardation ef-fect when particle dimensions become comparable with the wavelength of light. Two different processes take place when light travels through a suspen-sion of small particles. They are absorption of light which leads to thermal losses and scattering or re-radiation of the incident light. Total losses that account for both components are termed the extinction of light. Optical transmittance defined as the ratio of the transmitted light intensity to the incident one is a usual measured quantity in most UV-vis spectroscopic experiments. Sometimes it is convenient to plot transmittance in a semi-loga-rithmic scale then the extinction would be a linear function of the optical path and/or concentration of a solution. For an ensemble of N non-interac-ting particles transmitted intensity follows Beer’s law I I0exp( – CextlN),
where Cext is the extinction cross-section of individual particle in cm2, l is
the path length in cm, N is the particle concentration in cm–3. Thus, the
extinction of a suspension of nanoparticles can be defined as
E 0,4343CextlN. (2)
Hence, Mie theory provides a fundamental basis for the experimental determination of the size and concentration of nanoparticles from their extinction spectra.
3. RESULTS AND DISCUSSION
8 S.Z. MALYNYCH
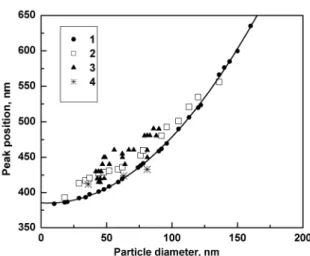
Fig. 1 – Position of the LSPR peak as a function of particle diameter for Ag nanoparticles in water. 1 – calculated data from Mie theory; 2, 3, 4 – experimental data from Refs. 9b, 12, 13 respectively. Solid line represents polynomial fit to the calculated data.
Decreasing of the nanoparticles size constrains the applicability of Mie theory due to additional collisions of free electrons with the boundary of the particle. As a result, dielectric function and plasmon peak positions for metal nanoparticles differ from those for bulk metal. Usually, only the imaginary part of the dielectric function is being modified to take into account size-limiting effects. According to [15, 16] small-size regime should be consi-dered for the particles less than 10 nm in diameter. To avoid size and shape limitations several numerical methods have been developed. Discrete dipole approximation (DDA) is one of the most frequently used so far. In this method the particles of interest are divided into a cubic array of finite elements. The response of the whole array of elementary dipoles to an applied electro-magnetic field is then described by self-consistently determining the induced dipole moment in each element, i.e. the dielectric properties of nanoparticle is directly related to the polarizability of the individual element. Jensen et al. have shown a good agreement of DDA and Mie theory results for silver nanoparticles with diameters ranging from 40 to 200 nm [17].
Polydispersity of silver nanoparticle suspensions embarrasses precise measurement of plasmon peak position introducing additional error to the determination of the particle size from the extinction spectra. Another plausible reason of the deviations of experimental data from calculated ones is the presence of chemical reaction products used during silver nanoparticle synthesis [12, 13]. The reaction products form a thin layer on the nano-particles surface and can substantially alter their optical response.
Theoretical calibration curve is described by following empirical expression max
24, 01 100( 385) 4,9
d ,
where d, max are the nanoparticle diameter and the LSPR wavelength,
ESTIMATION OF SIZE AND CONCENTRATION… 9
60-70 nm. For smaller nanoparticles the calibration allows only rough esti-mation of the particle diameter.
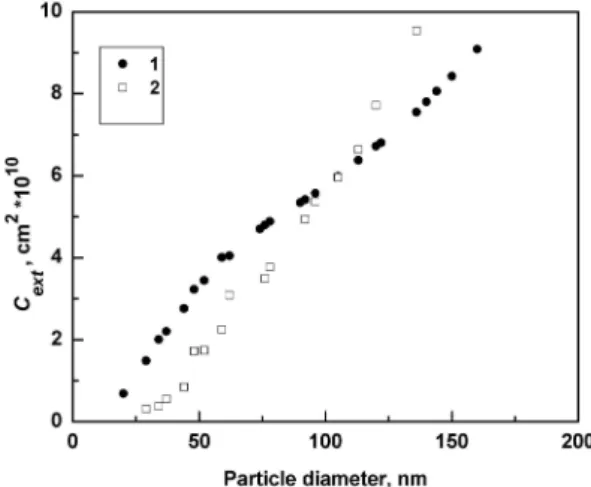
Evanoff and Chumanov developed a method to determine the concentration of silver nanoparticles which they named as standard subtraction [9b]. The method is based on the measurement of extinction spectra of Ag nano-particle aqueous suspension prior and after the removal of a known number of particles. Clean glass slides modified with poly(vinylpyridine) were used to remove the particles from a suspension. The slides were immersed into a measured volume of colloid and exposed about 70 hours with gentle stirring. Due to the strong affinity of pyridyl group to metals the particles self-assembled on the surface forming a single layer with an average interpar-ticle distance of 200-300 nm [18]. Total number of parinterpar-ticles self-assembled on a glass surface was determined employing scanning electron microscopy. Then the concentration of particles in a suspension was calculated from the decrease of the extinction spectra. Extinction cross sections of individual nanoparticles were determined using expression analogous to the Eq. (2). Corresponding plot is shown in Fig. 2 along with the cross sections calcu-lated from Mie theory.
Fig. 2 – Extinction cross section of silver nanoparticles in water as a function of particle diameter obtained from Mie theory simulations (1), experimental data from Ref. 9b (2).
10 S.Z. MALYNYCH
4. CONCLUSIONS
In this paper, we have shown that optical spectroscopy provides a simple analytical tool for the estimation of the size and concentration of silver nanoparticle in aqueous suspension. Calibration curve for the LSPR position and the extinction cross section vs. particle size are also presented along with corresponding empirical expression. Deviation of the nanoparticle shape from ideal sphere and extraneous chemicals on the nanoparticles surface causes disagreements between experimental data and the results obtained by Mie theory simulations. The disagreements become substantial for the particles less than 60 nm in diameter allowing rough estimation of size and concentration of Ag nanoparticles. Nevertheless, simplicity and express character of the described method makes it useful in the laboratory practice.
ÎÖ²ÍÊÀ ÐÎÇ̲ÐÓ ÒÀ ÊÎÍÖÅÍÒÐÀÖ²¯ ÍÀÍÎ×ÀÑÒÈÍÎÊ ÑвÁËÀ Ó ÂÎÄÍÎÌÓ ÇÀÂÈѲ Dz ÑÏÅÊÒв ÅÊÑÒÈÍÊÖ²¯
Ñ.Ç. Ìàëèíè÷
²íñòèòóò ô³çèêè íàï³âïðîâ³äíèê³â ³ì. Â.ª. Ëàøêàðüîâà ÍÀÍ Óêðà¿íè, ïðîñï. Íàóêè, 41, 03028, Êè¿â, Óêðà¿íà
E-mail: [email protected]
Ðîçì³ð òà êîíöåíòðàö³þ íàíî÷àñòèíîê ñð³áëà, çàâèñëèõ ó âîä³, ìîæíà ëåãêî îö³íèòè çà ¿õ ñïåêòðàìè åêñòèíêö³¿. Öå ìîæëèâî çàâäÿêè ñèëüí³é êîðåëÿö³¿ ëîêàë³çîâàíèõ ïîâåðõíåâèõ ïëàçìîííèõ ðåçîíàíñ³â, ùî çáóäæóþòüñÿ ó íàíî÷àñòèíêàõ åëåêòðîìàãí³òíèì âèïðîì³íþâàííÿì, ³ç ðîçì³ðîì òà ôîðìîþ ìåòàëåâèõ íàíî÷àñòèíîê. Ïðåäñòàâëåíî êàë³áðóâàëüíó êðèâó äëÿ íàíî÷àñòèíîê ñð³áëà ó âîä³, îòðèìàíó ³ç ðîçðàõóíê³â çã³äíî ç òåîð³ºþ ̳. Ïðîâåäåíî ïîð³âíÿííÿ ç îïóáë³êîâàíèìè åêñïåðèìåíòàëüíèìè äàíèìè.
Êëþ÷îâ³ ñëîâà: ÍÀÍÎ×ÀÑÒÈÍÊÈ ÑвÁËÀ, ÊÎËίÄ, ÑÏÅÊÒÐÈ ÅÊÑÒÈÍÊÖ²¯, ËÎÊÀ˲ÇÎÂÀÍÈÉ ÏÎÂÅÐÕÍÅÂÈÉ ÏËÀÇÌÎÍÍÈÉ ÐÅÇÎÍÀÍÑ.
ÎÖÅÍÊÀ ÐÀÇÌÅÐÀ È ÊÎÍÖÅÍÒÐÀÖÈÈ ÍÀÍÎ×ÀÑÒÈÖ ÑÅÐÅÁÐÀ  ÂÎÄÍÎÉ ÂÇÂÅÑÈ ÈÇ ÑÏÅÊÒÐΠÝÊÑÒÈÍÊÖÈÈ
Ñ.Ç. Ìàëèíè÷
Èíñòèòóò ôèçèêè ïîëóïðîâîäíèêîâ èì. Â.Å. Ëàøêàðåâà ÍÀÍ Óêðàèíû, ïðîñï. Íàóêè, 41, 03028, Êèåâ, Óêðàèíà
E-mail: [email protected]
Ðàçìåð è êîíöåíòðàöèþ âçâåøåííûõ â âîäå íàíî÷àñòèö ñåðåáðà ìîæíî ëåãêî îöåíèòü èç ñïåêòðîâ ýêñòèíêöèè. Ýòî âîçìîæíî áëàãîäàðÿ ñèëüíîé êîððåëÿöèè ëîêàëèçîâàííûõ ïîâåðõíîñòíûõ ïëàçìîííûõ ðåçîíàíñîâ, âîçáóæäàåìûõ ýëåêòðî-ìàãíèòíûì èçëó÷åíèåì, ñ ðàçìåðîì è ôîðìîé ìåòàëëè÷åñêèõ íàíî÷àñòèö. Ïðåäñòàâëåíà êàëèáðîâî÷íàÿ êðèâàÿ äëÿ îöåíêè ðàçìåðà íàíî÷àñòèö ñåðåáðà, ïîëó÷åííàÿ èç ðàñ÷åòîâ ñîãëàñíî òåîðèè Ìè. Ïðîâåäåíî ñðàâíåíèå ñ îïóáëèêî-âàííûìè ýêñïåðèìåíòàëüíûìè äàííûìè.
ESTIMATION OF SIZE AND CONCENTRATION… 11
REFERENCES
1. K.L. Wustholz, A.-I. Henry, J.M. Bingham, S.L. Kleinman, M.J. Natan, R.G. Freeman, R.P. Van Duyne, P. Soc Photo-Opt. Inst. 7394, 739403 (2009).
2. E.L. Falcao-Filho, C.B. de Araujo, Jr. J.J. Rodrigues, J. Opt. Soc. Am. B 24, 2948 (2007).
3. K.R. Catchpole, A. Polman, Opt. Express16, 21793 (2008).
4. K. Tamada, F. Nakamura, M. Ito, X. Li, A. Baba, Plasmonics2, 185 (2007). 5. O. Stranik, R. Nooney, C. McDonagh, B.D. MacCraith, Plasmonics2, 15 (2007). 6. R. Elghanian, J.J. Storhoff, R.C. Mucic, R.L. Letsinger, C.A. Mirkin, Science
277, 1078 (1997).
7. N.G. Khlebtsov, Anal. Chem.80, 6620 (2008).
8. U. Kreibig, M. Vollmer, Optical properties of metal clusters (Heidelberg: Springer-Verlag: 1995).
9. a) D.D. Evanoff Jr., G. Chumanov J. Phys. Chem. B108, 13948 (2004), b) D.D. Evanoff Jr., G. Chumanov, J. Phys. Chem. B108, 13957 (2004),
c) A.S. Kumbhar, M.K. Kinnan, G. Chumanov, J. Am. Chem. Soc.127, 12444 (2005), d) S. Malynych, G. Chumanov, J. Quant. Spectrosc. Ra. 106, 297 (2007).
10.J. Camden, G.C. Schatz, (DOI: 10254/nanohub-r1309.2, 2009). 11.P.B. Johnson, R.W. Christy, Phys. Rev. B6, 4370 (1972).
12.J.J. Mock, M. Barbic, D.R. Smith, D.A. Schultz, S. Schultz, J. Chem. Phys. 116, 6755 (2002).
13.P. Lundahl, R. Stokes, E. Smith, R. Martin, D. Graham, Micro Nano Lett. 3, 62
(2008).
14.K.L. Kelly, E. Coronado, L.L. Zhao, G.C. Schatz, J. Phys. Chem. B107, 668 (2003). 15.N.G. Khlebtsov, V.A. Bogatyrev, L.A. Dykman, A.G. Melnikov, J. Colloid. Interface
Sci.180, 436 (1996).
16.L.B. Scaffardi, J.O. Tocho, Nanotechnology 17, 1309 (2006).