Structural Differentiation of Graphs Using Hosoya-Based
Indices
Matthias Dehmer1,2*, Abbe Mowshowitz3, Yongtang Shi4,5
1Department of Computer Science, Universita¨t der Bundeswehr Mu¨nchen, Neubiberg, Germany,2Institute for Bioinformatics and Translational Research, UMIT, Hall in Tyrol, Austria,3Department of Computer Science, The City College of New York (CUNY), New York, New York, United States of America,4Center for Combinatorics and LPMC-TJKLC, Nankai University, Tianjin, China,5College of Computer and Control Engineering, Nankai University, Tianjin, China
Abstract
In this paper, we introduce the Hosoya-Spectral indices and the Hosoya information content of a graph. The first measure combines structural information captured by partial Hosoya polynomials and graph spectra. The latter is a graph entropy measure which is based on blocks consisting of vertices with the same partial Hosoya polynomial. We evaluate the discrimination power of these quantities by interpreting numerical results.
Citation:Dehmer M, Mowshowitz A, Shi Y (2014) Structural Differentiation of Graphs Using Hosoya-Based Indices. PLoS ONE 9(7): e102459. doi:10.1371/journal. pone.0102459
Editor:Matjaz Perc, University of Maribor, Slovenia
ReceivedMay 9, 2014;AcceptedJune 19, 2014;PublishedJuly 14, 2014
Copyright:ß2014 Dehmer et al. This is an open-access article distributed under the terms of the Creative Commons Attribution License, which permits unrestricted use, distribution, and reproduction in any medium, provided the original author and source are credited.
Data Availability:The authors confirm that, for approved reasons, some access restrictions apply to the data underlying the findings. The data sets (graphs) can be generated by using the papackage Nauty (subpackage geng) by McKay.
Funding:Matthias Dehmer thanks the Austrian Science Funds for supporting this work (project P26142). Matthias Dehmer gratefully acknowledges financial support from the German Federal Ministry of Education and Research (BMBF) (project RiKoV, Grant No. 13N12304). Yongtang Shi are supported by NSFC, PCSIRT, China Postdoctoral Science Foundation and China Scholarship Council. The funders had no role in study design, data collection and analysis, decision to publish, or preparation of the manuscript.
Competing Interests:Matthias Dehmer is a PLOS ONE Editorial Board member. This does not alter the authors’ adherence to PLOS ONE Editorial policies and criteria.
* Email: [email protected]
Introduction
Structural differentiation entails the classification of graphs according to structural features captured by quantitative measures, see, e.g., [1–5]. One way to demonstrate a classification procedure is to apply a measure (or index) to a special class of graphs and show that the measure discriminates between non-isomorphic graphs with high probability. A prominent example is the Balaban
Jindex [6–8] which is highly discriminating on chemical graphs. However, this index has limitations as shown by Dehmer et al. [2] by means of a statistical analysis of the performance of theJand other indices on an exhaustively generated set of graphs without structural constraints, see [2]. This analysis shows that the discrimination power (also called uniqueness [2]) of graph measures depends on the underlying class of graphs [2].
This paper is an investigation of the discriminating power of structural indices based on the zeros of partial Hosoya polynomials and graph spectra. Also, we introduce and evaluate the Hosoya information contentof a graph. To position this investigation we begin with a survey of literature dealing with eigenvalues and entropy-based measures of graphs. Classical results in the theory of graph spectra are due to Cvetkovic´ et al. [9]. The main concern of this theory is to explore structural properties of graphs and complex networks captured by graph spectra [10]. More recent results have been presented and surveyed by Chung [11] and Cioaba^
[12]. Interdisciplinary applications of graph spectra, e.g., the analysis of biological networks and web graphs can be found in [10,13]. Various graph measures incorporating eigenvalues have been discussed by Randic´ et al. [14] and Dehmer et al. [15]. One example of a measure is defined as the sum of the moduli of
non-zero eigenvalues of the adjacency matrix of a graph; another is given by graph entropies based on the eigenvalues of matrices associated with a graph [14–16]. Yet another well-known measure is the Estrada index [17–20] which has been explored in bioinformatics, mathematical chemistry and applied mathematics. A more recent review of this quantity is due to Gutman et al. [21]. Variants of this measures using other matrices have been discussed by Li et al. [22]. A related measure is the so-called energy of a graph is an important quantity defined in relation to the eigenvalues of matrices associated with a graph, see [23– 25]. Extremal properties of graph energy have been studied by [23– 25]. A recent book on graph energy summarizing classical and new results is [26]. Inequalities for eigenvalue-based graph measures have been discussed in [12]. Elphick and Wocjan [27] analyzed a novel spectral measure for determining network irregularity [27].
Graph entropy measures have been explored extensively in various disciplines. Rashevsky and Mowshowitz did seminal work when developing the first graph entropy measures based on vertex orbits [28,29]. Ko¨rner introduced a graph entropy measure that has been used in information theory [30]. Bonchev et al. developed the magnitude-based information indices and various others based on graph invariants such as vertex degrees and distances in graphs [31–34]. Also, Bonchev et al. [1] proposed an information index for graphs which is based on the Hosoya graph decomposition. However, this information index (using Hosoya indexZ[35] to define the probabilities of the induced partition) is quite different from the one we introduce here in section ‘Hosoya-based Indices’. Many other graph entropy measures can be found in [36–38]. To study results towards the Hosoya polynomial, we refer to [39,40].
In an earlier paper [3], we explored the discrimination power of measures (see section ‘Hosoya-based Indices’) that are based on the moduli of the zeros of the partial Hosoya polynomial. The main contribution of this paper is to define the Hosoya-Spectral indices combining structural information captured by partial Hosoya polynomials with graph spectra. Also, we examine the discrimination power of these indices and of the Hosoya information content of a graph. We discuss and compare the numerical results with the earlier ones produced in [3]. Further we elaborate on the usage of these measures as highly discriminating graph invariants.
Methods and Results
Hosoya-Based Indices
In this section, we reproduce the graph indices based on partial Hosoya polynomials, see [3]. As outlined in [3], the partial Hosoya polynomial of a vertex vi in the graph G~(V,E) is given by [41,42]
Hvi(G,z):~X v[V v=vi
zd(vi,v), ð1Þ
whered(vi,v)is the distance (i.e., length of a shortest path) between the verticesviandv. Solving the equation
Hvi(G,z)~0, ð2Þ
yields the complex zeros zvi1,zvi2,. . .,zviki which are not equal to zero. We inferkivDVDby applying the well-known fundamental theorem of Algebra [43,44] stating that a complex polynomial
f(z):~akzkzak
{1zk{1za1zza0,ak=0,ak[CD, ð3Þ with degreedeg (f)~khaskcomplex zeros.
Also in [3], Dehmer et al. introduced the following indices:
M1(G):~(Dzv1 1DzDz
v1
2Dz zDz
v1 k1D)z(Dz
v2
1DzDz
v2
2 Dz zDz
v2 k2D) z z(Dzv1DVDDzDzv2DVDDz zDzvkDVD
DVDD),
ð4Þ
M2(G):~
ffiffiffiffiffiffiffiffiffiffiffiffiffiffiffiffiffiffiffiffiffiffiffiffiffiffiffiffiffiffiffiffiffiffiffiffiffiffiffiffiffiffiffiffiffiffi Dzv1
1DzDz
v1
2Dz zDz
v1 k1D q
z
ffiffiffiffiffiffiffiffiffiffiffiffiffiffiffiffiffiffiffiffiffiffiffiffiffiffiffiffiffiffiffiffiffiffiffiffiffiffiffiffiffiffiffiffiffiffi Dzv2
1 DzDz
v2
2Dz zDz
v2 k2D q
z z
ffiffiffiffiffiffiffiffiffiffiffiffiffiffiffiffiffiffiffiffiffiffiffiffiffiffiffiffiffiffiffiffiffiffiffiffiffiffiffiffiffiffiffiffiffiffiffiffiffiffiffiffiffiffi Dzv1DVDDzDz2vDVDDz zDzvkDVD
DVDD r
,
ð5Þ
and
M3(G):~(Dzv1
1DzDz
v1
2Dz zDz
v1
k1D) log (Dz
v1
1DzDz
v1
2Dz zDz
v1
k1D)
z(Dzv2
1DzDz
v2
2Dz zDz
v2 k2D) log (Dz
v2
1DzDz
v2
2Dz zDz
v2 k2D)
z z(Dzv1DVDDzDz
vDVD
2 Dz zDz
vDVD kVD) log (Dz
vDVD
1 DzDz
vDVD
2 Dz zDz
vDVD kDVDD):
ð6Þ
Here, M1 is the sum of the sums of the moduli of all partial
Hosoya polynomials Hv1,Hv2,
. . .,HvDVD. M2 is the sum of the
square roots of the sums of the moduli of all partial Hosoya polynomials. M3 represents an entropy-like measure taking the
sums of the moduli of all partial Hosoya polynomials into account. Spectra of graphs have been investigated extensively [9,12]. As already mentioned, well-known spectral based indices are the Estrada index [18–20] and various forms of graph energy due to Gutman, see [23–25]. Since Hosoya polynomials and graph spectra capture different aspects of graph structure, we propose to combine the two in one index. So, letl1 lDVDbe the eigenvalues
of x(G):~det (A{lE); A the adjacency matrix of G. The Hosoya-Spectral indicesHSi(G)are defined as follows:
HS1(G):~l1(jz
v1
1jzjz
v1
2jz zjz
v1 k1j) zl1(jz
v2
1 jzjz
v2
2 jz zjz
v2 k2j) z zljVj(jz
vjVj
1 jzjz
vjVj
2 jz zjz
vjVj kjVjj),
ð7Þ
HS2(G):~l1
ffiffiffiffiffiffiffiffiffiffiffiffiffiffiffiffiffiffiffiffiffiffiffiffiffiffiffiffiffiffiffiffiffiffiffiffiffiffiffiffiffiffiffiffiffiffiffi jzv1
1jzjz
v1
2jz zjz
v1 k1j q
zl2
ffiffiffiffiffiffiffiffiffiffiffiffiffiffiffiffiffiffiffiffiffiffiffiffiffiffiffiffiffiffiffiffiffiffiffiffiffiffiffiffiffiffiffiffiffiffiffi jzv2
1jzjz
v2
2jz zjz
v2 k2j q
z zljVj
ffiffiffiffiffiffiffiffiffiffiffiffiffiffiffiffiffiffiffiffiffiffiffiffiffiffiffiffiffiffiffiffiffiffiffiffiffiffiffiffiffiffiffiffiffiffiffiffiffiffiffiffiffiffiffiffi jzv1jVjjzjz2vjVjjz zjzvkjVj
jVjj r
, ð8Þ
HS3(G):~l1(Dz
v1
1DzDz
v1
2Dz zDz
v1 k1D) log (Dz
v1
1DzDz
v1
2Dz zDz
v1 k1D)
zl2(Dz
v2
1DzDz
v2
2Dz zDz
v2 k2D) log (Dz
v2
1DzDz
v2
2Dz zDz
v2 k2D)
z zlDVD(Dzv1DVDDzDz
vDVD
2 Dz zDz
vDVD kVD) log (Dz
vDVD
1 DzDz
vDVD
2 Dz zDz
vDVD kDVDD):
ð9Þ
Inspired by studying information-theoretic complexity measures [1,28,31–33,45], we define the Hosoya information content of a graphG. LetVifor1ƒiƒkbe the set of all vertices inGwith the
i{thofkpartial Hosoya polynomials of the vertices ofG~(V,E);
Vi is then the i-th block in a partition of V. The Hosoya information contentofGis defined by
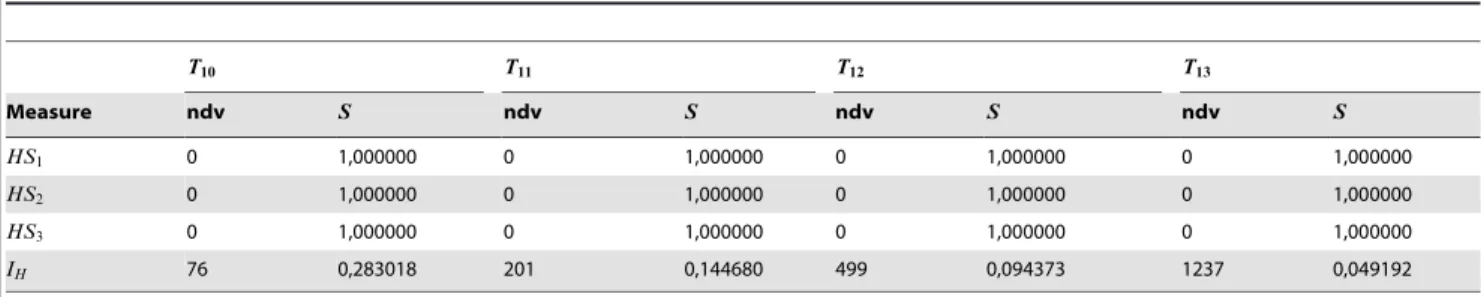
Table 1.Exhaustively generated sets of non-isomorphic trees:DT10D~106,DT11D~235,DT12D~551,DT13D~1301.
T10 T11 T12 T13
Measure ndv S ndv S ndv S ndv S
HS1 0 1,000000 0 1,000000 0 1,000000 0 1,000000
HS2 0 1,000000 0 1,000000 0 1,000000 0 1,000000
HS3 0 1,000000 0 1,000000 0 1,000000 0 1,000000
IH 76 0,283018 201 0,144680 499 0,094373 1237 0,049192
doi:10.1371/journal.pone.0102459.t001
Structural Differentiation of Graphs
IH(G):~{X k
i~1
DViD DVDlog
DViD DVD
: ð10Þ
In the next section, we evaluate the discrimination power of this new measure and the Hosoya-Spectral indices on exhaustively generated graphs.
Numerical Results
As in [3], we present the numerical values resulting from the evaluation of the discrimination power of the Hosoya-Spectral indices and the Hosoya information content. In order to do so, we use the same graph classes in order to make direct comparisons [3]; Ti,10ƒiƒ18 are the sets of all non-isomorphic trees withi
vertices.N9is the set of all non-isomorphic graphs with 9 vertices,
see [2].
To evaluate the discrimination power quantitatively, we use the same measures as in [3]: ndv stands for the number of non-distinguishable graphs according to the values of the indices. From this, we also computeS(I):~DGD{ndv
DGD whereI:G?R, see [46].
As in [3], the measuresHSi are fully unique onT10,. . .,T13,
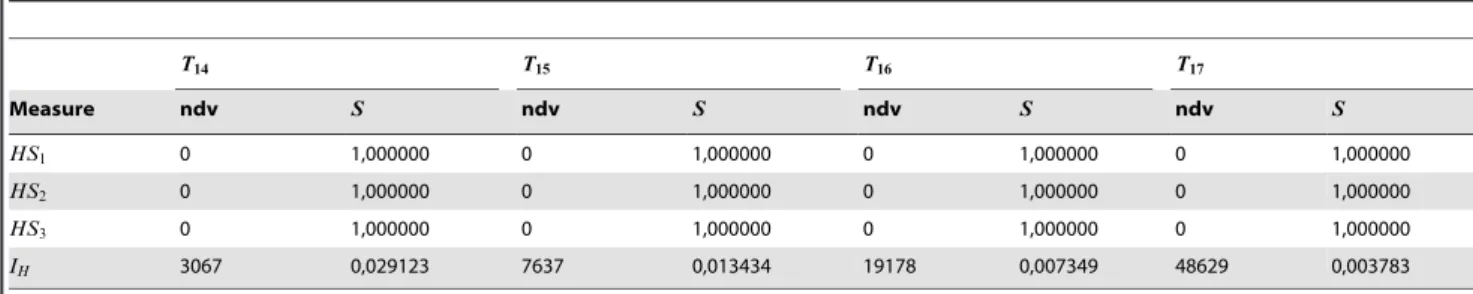
see Table 1. We obtain the same result by applying the Hosoya-Spectral indices to T14,. . .,T17, see Table 2. See also
[3]. Moreover, the Hosoya-Spectral indices can discriminate the tree classT18uniquely (see Table 3). Note that the earlier defined
measuresMi (see Equation 4–6) [3] produced the first degener-acies on the setT18.
The exhaustively generated graphs with 9 vertices (N9) warrants
special attention. In contrast to the previously introduced measuresMi, Table 3 shows that the uniqueness ofHSiis high. More precisely,HS1andHS2can discriminate 99% of the graph
uniquely. The discrimination power ofHS3is approximately 95%.
This marks a considerable improvement compared with the measuresMievaluated in [3] on the same classes of graphs. The
improvement of the discrimination power of the new measures can be explained by the fact that partial Hosoya polynomials and graph spectra capture quite different aspects of graph structure. In particular, the partial Hosoya polynomial captures local graph properties related to distances in a graph, and the indicesMitake account of the moduli of the zeros of these polynomials. By contrast, the spectrum of a graph captures connectivity properties linked to its adjacency matrix. The combination of these graph properties in the measures HSi plausibly accounts for their superior performance over the single property measures (Mi).
Evidently, the discrimination power ofIHdeclines as the graph classes grow in size, i.e., the greater the cardinality of the graph class, the lower is index’s discrimination power (measured by ndv andS), see Table 1–3. Even for small classes, the degeneracy is high. For N9, the Hosoya information content IH cannot
discriminate at all and, hence, S~0. These results are not surprising in view of the definition of Hosoya information content. The blocks of the partitions consist of vertices with the same partial Hosoya polynomial. Thus, the more cycles in a graph, the greater the likelihood of obtaining large blocks of vertices with the same partial Hosoya polynomial. The occurrence of such large blocks results in high values for the quantity ndv (and low values forS).
Summary and Conclusions
In this paper, we defined the Hosoya-Spectral indices as well as the Hosoya information content of a graph. The former measures combine structural information captured by partial Hosoya polynomials and graph spectra. It is evident that those two graph features capture structural information differently and, hence, the resulting measures may be more unique than the ones (Mi) used in earlier work, see [3]. The numerical study reported here has confirmed this conjecture for both trees and graphs. Finally, as expected, the discrimination power of Hosoya information content was found to be very low.
In future research, we plan to explore extremal properties of both measures. In particular, Hosoya information content is
Table 2.Exhaustively generated sets of non-isomorphic trees:DT14D~3159,DT15D~7741,DT16D~19320,DT17D~48629.
T14 T15 T16 T17
Measure ndv S ndv S ndv S ndv S
HS1 0 1,000000 0 1,000000 0 1,000000 0 1,000000
HS2 0 1,000000 0 1,000000 0 1,000000 0 1,000000
HS3 0 1,000000 0 1,000000 0 1,000000 0 1,000000
IH 3067 0,029123 7637 0,013434 19178 0,007349 48629 0,003783
doi:10.1371/journal.pone.0102459.t002
Table 3.Exhaustively generated sets of non-isomorphic trees and graphs:DT18D~123757,DN9D~261080.
T18 N9
Measure ndv S ndv S
HS1 0 1,000000 24 0,999908
HS2 0 1,000000 18 0,999931
HS3 0 1,000000 12393 0,952723
IH 123512 0,001979 261080 0,000000
doi:10.1371/journal.pone.0102459.t003
Structural Differentiation of Graphs
related to the orbit structure of a graph, and this calls for studying the automorphism groups of certain classes of graphs.
Acknowledgments
We thank Lukas Huber for help regarding the data analysis and fruitful discussions
Author Contributions
Contributed to the writing of the manuscript: MD YS AM.
References
1. Bonchev D, Mekenyan O, Trinajstic´ N (1981) Isomer discrimination by topological information approach. J Comp Chem 2: 127–148.
2. Dehmer M, Grabner M, Varmuza K (2012) Information indices with high discriminative power for graphs. PLoS ONE 7: e31214.
3. Dehmer M, Mowshowitz A, Shi Y (2014) Discrimination power of graph measures based on complex zeros of the partial Hosoya polynomial. submitted for publication.
4. Konstantinova EV, Paleev AA (1990) Sensitivity of topological indices of polycyclic graphs. Vychisl Sistemy 136: 38–48.
5. Petrov E, Stoyanov B, Kochev N, Bangov I (2014) Use of cti index for perception of duplicated chemical structures in large chemical databases. MATCH Commun Math Comput Chem 71: 645–656.
6. Balaban AT (1982) Highly discriminating distance-based topological index. Chem Phys Lett 89: 399–404.
7. Randic´ M (2013)dMAXmatrix of dominant distances in a graph. MATCH Commun Math Comput Chem 70: 221–238. 8. Randic´ M, Orel R, Balaban AT (2013)dMAXmatrix graph invariants as graph
descriptors. graphs having the same balabanjindex. MATCH Commun Math Comput Chem 70: 239–258.
9. Cvetkovic´ DM, Doob M, Sachs H (1980) Spectra of Graphs. Theory and Application. Deutscher Verlag der Wissenschaften. Berlin, Germany. 10. Estrada E (2011) The Structure of Complex Networks. Theory and
Applications.. Oxford University Press.
11. Chung F (1997) Spectral Graph Theory, volume 12 of Cbms Regional Conference Series in Mathematics. American Mathematical Society. 12. Cioaba^
SM (2010) Some applications of eigenvalues of graphs. In: Dehmer M, editor, Structural Analysis of Complex Networks, Boston/Basel: Birkha¨user. pp. 357–379.
13. Wu J, Deng HZ, Tan YJ (2010) Spectral measure of robustness for internet topology. In: 2010 3rd IEEE International Conference on Computer Science and Information Technology (ICCSIT). volume 6, pp. 50–54.
14. Randic´ M, Vracko M, Novic M (2001) Eigenvalues as molecular descriptors. In: Diudea MV, editor, QSPR/QSAR Studies by Molecular Descriptors, Nova Publishing. pp. 93–120. Huntington, NY, USA.
15. Dehmer M, Sivakumar L, Varmuza K (2012) Uniquely discriminating molecular structures using novel eigenvalue-based descriptors. MATCH Communications in Mathematical and in Computer Chemistry 67: 147–172. 16. Janezˇic´ D, Milezˇevic´ A, Nikolic´ S, Trinajstic´ N (2009) Topological complexity of
molecules. In: Meyers R, editor, Encyclopedia of Complexity and System Science, Springer, volume 5. pp. 9210–9224.
17. Das KC, Lee SG (2009) On the Estrada index conjecture. Linear Algebra and its Applications 431: 1351–1359.
18. Estrada E (2000) Characterization of 3d molecular structure. Chemical Physics Letters 319: 713–718.
19. Estrada E (2002) Characterization of the folding degree of proteins. Bioinfor-matics 18: 697–704.
20. Gutman I, Estrada E, Rodriguez-Vela´zquezc JA (2007) On a graph-spectrum-based structure descriptor. Croatica Chemica Acta 80: 151–154.
21. Gutman I, Deng H, Randenkovic´ S (2011) The Estrada index: An updated survey. In: Cvetkovic´ D, Gutman I, editor, Selected Topics on Applications of Graph Spectra, Mathematical Institute of the Serbian Academy of Sciences and Arts, Belgrade. pp. 155–174.
22. Li J, Shiu WC, Chan WH (2011) Note on the Laplacian Estrada Index of a Graph. MATCH Commun Math Comput Chem 6: 777–784.
23. Gutman I (2001) The energy of a graph: Old and new results. In: Betten A, Kohnert A, Laue R, Wassermann A, editor, Algebraic Combinatorics and Applications, Springer Verlag. pp. 196––211, . Berlin.
24. Gutman I, Zhou B (2006) Laplacian energy of a graph. Linear Algebra and its Applications 414: 29–37.
25. Gutman I, Li X, Zhang J (2009) Graph energy. In: Dehmer M, Emmert-Streib F,editor, Analysis of Complex Networks: From Biology to Linguistics, Wiley-VCH. pp. 145–174.
26. Li X, Shi Y, Gutman I (2012) Graph Energy. Springer.
27. Elphick C, Wocjan P (2014) New measures of graph irregularity. Electronic Journal of Graph Theory and Applications 2: 52–65.
28. Mowshowitz A (1968) Entropy and the complexity of the graphs I: An index of the relative complexity of a graph. Bull Math Biophys 30: 175–204. 29. Rashevsky N (1955) Life, information theory, and topology. Bull Math Biophys
17: 229–235.
30. Ko¨rner J (1973) Coding of an information source having ambiguous alphabet and the entropy of graphs. Transactions of the 6-th Prague Conference on Information Theory: 411–425.
31. Bonchev D, Trinajstic´ N (1977) Information theory, distance matrix and molecular branching. J Chem Phys 67: 4517–4533.
32. Bonchev D (1979) Information indices for atoms and molecules. MATCH Commun Math Comp Chem 7: 65–113.
33. Bonchev D (1983) Information Theoretic Indices for Characterization of Chemical Structures. Research Studies Press, Chichester.
34. Bonchev D (2000) Overall connectivities and topological complexities: A new powerful tool for QSPR/QSAR. J Chem Inf Comput Sci 40: 934–941. 35. Hosoya H (1971) Topological index. A newly proposed quantity characterizing
the topological nature of structural isomers of saturated hydrocarbons. Bull Chem Soc Jpn 44: 2332–2339.
36. Dehmer M, Mowshowitz A (2011) A history of graph entropy measures. Information Sciences 1: 57–78.
37. Devillers J, Balaban AT (1999) Topological Indices and Related Descriptors in QSAR and QSPR. Gordon and Breach Science Publishers. Amsterdam, The Netherlands.
38. Mehler A, Weib P, Lu¨cking A (2010) A network model of interpersonal alignment. Entropy 12: 1440–1483.
39. Gutman I, Zhang Y, Dehmer M, Ilic´ A (2012) Altenburg, Wiener, and Hosoya polynomials. In: Gutman I, Furtula B,editor, Distance in Molecular Graphs -Theory, Univ. Kragujevac.pp. 49–70. Kragujevac.
40. Deutsch E, Klavzˇar S (2013) Computing the hosoya polynomial of graphs from primary subgraphss. MATCH Commun Math Comput Chem 70: 627–644. 41. Dosˇlic´ T (2008) Vertex-weighted Wiener polynomials for composite graphs. Ars
Math Contemp 1: 66–80.
42. Hosoya H (1988) On some counting polynomials. Discrete Applied Mathematics 19: 239–257.
43. Dehmer M, Mowshowitz A (2011) Bounds on the moduli of polynomial zeros. Applied Mathematics and Computation 218: 4128–4137.
44. Fricke R (1924) Lehrbuch der Algebra. Friedrich Vieweg & Sohn Verlag. Braunschweig, Germany.
45. Dehmer M, Borgert S, Emmert-Streib F (2008) Entropy bounds for molecular hierarchical networks. PLoS ONE 3: e3079.
46. Konstantinova EV, Skorobogatov VA, Vidyuk MV (2002) Applications of information theory in chemical graph theory. Indian Journal of Chemistry 42: 1227–1240.
Structural Differentiation of Graphs