Article
0103 - 5053 $6.00+0.00
*e-mail: [email protected]
SPME-GC-FID Method Development for Analyzing Cyclohexanone Hydrogenation Products
Adriana R. A. Coelho, Ione M. F. Oliveira and Zenilda L. Cardeal*
Departamento de Química, Instituto de Ciências Exatas, Universidade Federal de Minas Gerais, Av. Antônio Carlos, 6627, 31270-901 Belo Horizonte-MG, Brazil
Este trabalho apresenta o desenvolvimento de um método simples, rápido e preciso para análise dos produtos da hidrogenação eletrocatalítica da ciclohexanona com a técnica de microextração em fase sólida, usando cromatografia a gás com detector de ionização por chama. A otimização preliminar do método foi realizada através de ferramentas quimiométricas. Os resultados de LOD e LOQ foram 0,50% de conversão ou 0,78 mg L-1 e 1,20% de conversão ou 1,86 mg L-1,
respectivamente. A curva analítica demonstra boa linearidade (R2 = 0,9936).
This work presents a method development for analyzing electrocatalytic hydrogenation products of cyclohexanone with the simple, fast and accurate SPME, coupled with classic gas chromatographic methods using flame ionization detection. Preliminar method optimization was made using chemometric tools. LOD and LOQ obtained were 0.50% conversion or 0.78 mg L-1
and 1.20% conversion or 1.86 mg L-1 respectively. The analytical curve obtained displays good
linearity (R2 = 0.9936).
Keywords: SPME, HEC, cyclohexanone, chemometrics
Introduction
Both heterogeneous and homogeneous catalysis play an important role in the fragrance and flavor industry. Catalytic hydrogenations are usually heterogeneous, because the catalyst can be easily separated and recycled. Its main use is the reduction of olefins, but it also applies to the reduction
of carbonyl compounds.1
The hydrogenation reactions of unsaturated compounds bear great interest for modern industry. Although various catalytic and electrocatalytic processes have been presented that allow selective hydrogenation of unsaturated organic compounds, there is still room for improvement, particularly
in the field of electrocatalysis.2
In most studies on the field of electrocatalytic hydrogenation (ECH) and catalytic hydrogenation (CH), the method applied for the analysis of the reaction products or media is gas chromatography, which can sometimes be coupled with a spectrometric method. In general, the reaction product is separated from the aqueous media by liquid-liquid extraction.
The electrocatalytic hydrogenation (ECH) of phenol at a Raney nickel cathode, for instance, was studied in
aqueous and hydro-organic solutions. At 30 ºC, without surfactants, cyclohexanol was obtained with low or medium yields. The progress of the electrolysis was followed by gas-liquid chromatography with a FID detector and a DB-Wax capillary column. Aliquots (0.5 mL) from the aqueous catholyte were extracted with ethoxyethane, after addition of 1 mL of saturated NaCl solution and acidification
(pH ca.1) with HCl. The products were identified by
comparing their retention times with those of authentic
samples, using n-heptadecane or dodecane as internal
standard method. With hydro-organic solutions, prior to the extraction, ethanol was removed by distillation at atmospheric pressure and quantitatively analyzed by GLC.
The ethoxyethane was then dried (MgSO4), evaporated
under vacuum and the mass balance was calculated from the weight of the crude product. In some experiments the crude
product was also analysed by 1H NMR spectroscopy.3
were removed at different times during the electrolysis. Cyclohexanone and cyclohexanol were extracted in a solution of ethyl acetate containing HCl, NaCl and ISTD (3-methylcyclohexa-1-ol in water). The aqueous phase
was frozen on an acetone/CO2 ice mix. The organic part
was removed, dried and injected in a gas chromatograph system, equipped with FID detector to further identify the
organic compounds.4
A modified electrode (ME) covered with
poly-[allyl-ether-p-(2-aminoethyl)-phenol] film containing
platinum particles was prepared and used for the electrohydrogenation of several carbonylic compounds. The ECH of cyclohexanone, for example, took 24 h at first, obtaining a 65.3% yield, and the use of the modification led to a 88.5% yield, obtained after 16 h of ECH at −0.6 V
potential versus satured calomel electrode (SCE). In this
study, to isolate the reaction products, the final solution
was neutralized with NaHCO3 and CH2Cl2 was used for
extraction. After solvent evaporation, the products were analyzed by GC-FID. Isophorone (3,5,5-trimethylcyclohex-2-en-1-one) and cyclohex-2-en-1-one products were
analyzed by 1H NMR, using a Brüker AC-80 (80 MHz)
spectrometer.5
In another study, the electrocatalytic hydrogenation of cyclohexanone was used to test the performance (amount
of cyclohexanol versus time of generated electrolysis at
constant current) of original and versatile new materials for the electrocatalytic hydrogenation of organic substracts. The data is measured and compared for the various bonded organic functions of the modified silica surface. The ECH yield is defined as the relative amount (%) of cyclohexanol generated in the solution for a given Faradic charge. The results are presented as the sum of the amount of cyclohexanol and cyclohexanone being 100%. The hydrogenation efficiency reached over 80% for a 336 C charge applied.
During the electrocatalytic hydrogenation process (ECH), samples of 500 µL were withdrawn from the catholyte, saturated with sodium chloride, and then extracted with 1 mL of chloroform. The solution was dried using anhydrous sodium sulfate and analyzed by
GC-FID.6
The catalytic and electrocatalytic hydrogenation of benzophenone (diphenylmethanone) were performed in aqueous ethanol onto 10% (m/m) Pd-alumina supported catalyst and finely divided Pd catalyst. Quantitative analyses were carried out by gas chromatography (GC-MS). Aliquots were removed from the cathodic compartment at different times of electrolysis (for ECH) or from a bulk solution at different times of reaction (for CH). The solution was treated with NaCl and chloroform, the
organic phase was removed, dried and injected in the gas
chromatograph.7
The use of SPME improves the efficiency of the analysis of volatile organic compounds in many different samples: it produces rapid extraction and allows direct introduction in the analytical equipment; it does not disturb the living system equilibrium and provides better analytical performance in lesser time; it is easily automated and solvent-free.
In 2003, a method for the direct determination by gas chromatography–mass spectrometry (GC-MS) analysis of the products from the limonene (1-methyl-4-prop-1-en-2-yl-cyclohexene) disproportionation obtained from the catalytic hydrogenation of castor oil was proposed. To monitor the hydrogenated products formed on the reaction by (GC-MS) it would be necessary to transesterify many small samples several times during the reaction course. In order to avoid those steps, a headspace solid-phase microextraction (SPME) method followed by GC-MS was optimized.
SPME was carried out in the headspace mode with a 100 µm polydimethylsiloxane (PDMS) fiber. Hydrogenation reaction was performed in a 50 mL two-necked round-bottomed flask with a thermometer and a reflux condenser for 1 h at 178 ºC. Hexane was added to the flask, immediately followed by centrifugation. The extract was hot filtered, for the separation of Pd/C, and the hydrogenated product was precipitated by freezing. The liquid phase was separated and stored at 4 °C and the hydrogenated product was dried and also stored. SPME-GC-MS was found to be a simple and sensible method for the evaluation of the volatile compounds formed on the disproportionation of limonene during the hydrogenation of castor oil, and proved to be a good method to follow the intermediate products of disproportionation of limonene as
an indicator of the hydrogenation of the Castor oil.8
Solid-phase microextraction has also been used for identifying, quantifying and following the evolution of intermediate products of octan-1-ol degradation by photocatalytic and ultrasound processes, inducing mainly the same active species, and the photocatalytic degradation of the organophosphorus insecticides ethyl parathion (diethoxy-(4-nitrophenoxy)-sulfanylidene-phosphorane) and fenthion (dimethoxy-(3-methyl-4-methylsulfanyl-phenoxy)-sulfanylidene-phosphorane) in aqueous titanium
dioxide suspensions under simulated solar irradiation.9,10
In this paper, a fast direct SPME method is proposed for GC-FID analysis of the electrocatalytic hydrogenation product of cyclohexanone, cyclohexanol. Such idea aims to reduce the steps of sample preparation, as well as to reduce solvent use, and to give a more accurate response for analyzing the progress of the reaction by introducing analytical curve, precision methods (variation coefficient intra and inter essay) and quantification limit tests for specific analysis of substracts and products from a reaction. It is considered that similar methods can be developed in the future, regarding any other substracts that could undergo electrocatalytic hydrogenation, reaching more reliable results.
Experimental
Apparatus
Electrochemical measures were made using a PGSTAT-20 potenciostat, from AutoLab (Eco Chemie, Netherlands), connected to the corresponding software (General Purpose Electrochemical System, GPES) through an ISA-IF020 interface. A three-electrode cell was used for the hydrogenation. The reference electrode used was Ag; Pt was the auxiliary electrode and the working electrode was a modified electrode, prepared over a carbon felt (10 mm x
10 mm x 3 mm) by polymerization of n
-(4-carboxybenzyl)-pyrrole monomer followed by deposition of nickel particles,
as described by Oliveira.11
Chromatographic analysis were performed with a HP PAS/5 (25 m × 0.32 mm × 0.52 µm) capilar column (Hewlett Packard, Palo Alto, USA), on a Shimadzu GC-17 (Kyoto, Japan) gas chromatographer with flame ionization detector. The Class-CR10 software was used for data treatment.
SPME was carried out in 22 mL glass vials sealed with Teflon septa and aluminum caps, using a 100 µm PDMS polydimethylsiloxane fiber and manual supporte from Supelco (Bellefonte, USA). The temperature was controlled with a system consisting of a metallic block with two cavities: one for the vial and one for a thermometer, the block being placed over an electrical stirrer hot plate.
All the chemometric data management was performed with the aid of the Microsoft Excel® worksheets designed
by Teófilo and Ferreira.12
Materials and reagents
High purity deionized (MilliQ) water was the solvent both in chromatographic and electrochemical experiments. Potassium chloride, from Merck, was used as electrolyte for the hydrogenation. Sodium chloride, also Merck, was
used in 5% (m/v) concentration in all SPME solutions. Cyclohexanone and cyclohexanol were HPLC grade.
All the electrochemical experiments were performed under nitrogen 99% pure atmosphere (White Martins, Belo Horizonte, Brazil).
Electrocatalytic hydrogenation procedure
The coulommetric electrocatalytic hydrogenation was conduct on a 17 mL cell containing 15 mL aqueous KCl
0.5 mol L-1 and 240 µL (2.32 mmol L-1) of cyclohexanone,
under a −1.35 V potencial. Samples of 0.5 mL were taken
after 445 C and 990 C was applied (2 and 4 electrons per
molecule, respectively).
SPME samples
Preliminary SPME and GC setup studies were carried out in a cyclohexanol/cyclohexanone diluted solution
containing 0.08 mmol L-1 of each reagent.
To elaborate the analytical curve, 50 mL solutions were prepared using cyclohexanol in quantities that would reproduce 0 to 98.1% hydrogenation of the 2.32 mmol of cyclohexanone in the proposed reactional media. The final concentrations in cyclohexanol were 0.77, 1.55, 3.10, 6.20, 15.49, 77.46, 9.14, 19.05, 37.95, 75.91, 114.02 and
151.97 mg L-1. All solutions had the same cyclohexanone
concentration, fit to represent 50% of the total content in
the reactional media, 75.9 mg L-1, in 5% (m/v) sodium
chloride aqueous solution. A sample blank solution was also prepared for analytical curve, LOD and LOQ studies, and it was cyclohexanone and cyclohexanol free.
The 0.5 mL reaction samples obtained from the hydrogenation process were diluted 1:100 mL in 5% (m/v) sodium chloride aqueous solution for analysis.
In all analysis, 15 mL solution were added to the vial for the SPME extraction. The vial was kept at 45 ºC during 5 min for the SPME direct extraction followed by a thermal desorption at 220 ºC for 102 s (1.7 min).
Parameters of the chromatographic analysis
After preliminary studies, the optimized oven temperature program began at 52 ºC, held for 16 min and
was then raised to 90 ºC at 15 ºC min-1, and held for one
minute at this temperature. The column flow was 1 mL min-1.
Hydrogen ultra pure was used as carrier gas. The detector used nitrogen, syntethic air and hydrogen with
30:300:30 mL min-1 flows respectively. The detector
Chemometrics
Two experimental designs were proposed to optimize
the SPME parameters. First, a 23 fatorial design with 5
replicates center points (Table 1).
From that, a central composite design (Table 2) was prepared. Only two factors were considered, based on the
23 fatorial design results.
Validation
Analytical curve, precision methods (variation coefficient intra and inter essay) and quantification limit tests were made
based on Eurachem recommendations.13 Two replicates of
thirteen sample points were used to build the analytical curve, with the aid of Microsoft Excel® software. The precision method was investigated through seven consecutive replicates of three arbitrary points of the analytical curve for intra-essay studies, and analysis of the same three points along 7 days for the inter-essay studies. Finally, the detection and quantification limits were determined by 10 replicates of blank analysis, with values according to the mathematical expression suggested by Eurachem:
LOD = sample blank mean value + 3 standard deviations
of the blank mean (1)
LOQ = sample blank mean value + 10 standard deviations
of the blank mean (2)
Results and Discussion
Chemometrics
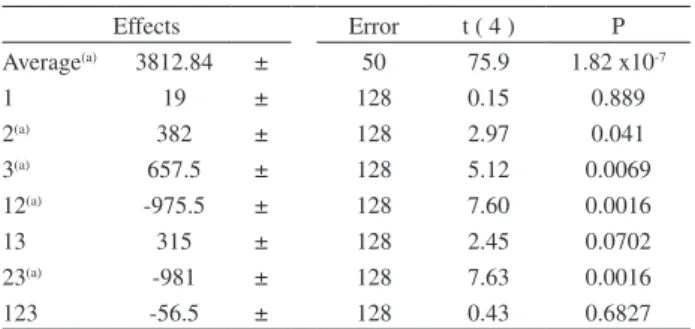
From the data obtained by the 23 factorial design
(Table 3), we can observe that effect 1, extraction time, is not relevant. It was further set to 5 minutes. Factors 2 and 3
show individual relevance, along with interactions between factors 1-2 and 2-3.
With the following step, central composite design, the results obtained (Table 4) show that the interaction between extraction temperature and desorption time is the most relevant factor.
The quadratic equation obtained is able to explain 78.47% of the variance of the system.
Z = 3434.492 + 113.152x + 346.981y +
345.343x2 − 640.272y2 − 670.75xy (3)
In this equation, Z is the response (peak area), x is the temperature of extraction and y is the desorption time. The surface obtained by this quadratic equation displays a saddle point exactly under the conditions set as central point. The response increases both to the combination of higher temperature and lower desorption time, and lower temperature and higher desorption time. Since the system is aqueous, the decision was made to operate under the second combination of factors. This way, it was established that the best given conditions would be 45 ºC extraction temperature with 5 min extraction time and 102 s desorption time (1.7 min).
Method validation
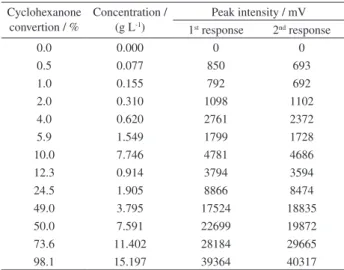
The analytical curve obtained based on the peak
intensity (see Table 5) displays good linearity (R2 = 0.9936)
in the analyzed range, leading to the function
Table 2. Factors and levels for the central composite design
Factor Level value
-1.41 -1 0 1 1.41
1 (extraction temperature) / ºC 45 55 80 105 115
2 (desorption time) / s 18 30 60 90 102
Table 3. Results obtained in the 23 factorial design
Effects Error t ( 4 ) P
Average(a) 3812.84 ± 50 75.9 1.82 x10⁻⁷
1 19 ± 128 0.15 0.889
2(a) 382 ± 128 2.97 0.041
3(a) 657.5 ± 128 5.12 0.0069
12(a) -975.5 ± 128 7.60 0.0016
13 315 ± 128 2.45 0.0702
23(a) -981 ± 128 7.63 0.0016
123 -56.5 ± 128 0.43 0.6827
(a)Relevant effects for significance level (α) 0.05.
Table 4. Results obtained in the central composite design
Effects Error t ( 2 ) P
Average(a) 3350 ± 89 37 0.0007161
1 -304.5 ± 237 1.28 0.3281319
2 -25.5 ± 237 0.107 0.9242536
12(a) -1341.5 ± 237 5.65 0.0299098
(a)Relevant effects for significance level (α) 0.05.
Table 1. Factors and levels for the 23 factorial design
Factor Lower
level
Central Point
Higher level
1 (extraction time) / min 2 16 30
2 (extraction temperature) / ºC 25 45 65
P.I. = 399.13 C, (4)
where P.I means peak intensity (in mV) and C means conversion %.
The variation coefficients for the method indicate good precision, as seen in Table 6.
The limit of detection obtained was 0.78 mg L-1
cyclohexanol (0.50% convertion of total cyclohexanone
available), while limit of quantification was 1.86 mg L-1
cyclohexanol (1.20% convertion convertion of total cyclohexanone available). The total cyclohexanone is
152 mg L-1, given that the reactional media presents
2.32 mmol of the substract in 15.0 mL solution and samples are to be diluted 1:100.
Aplication of proposed method
The hydrogenation results were very low. For 2 electrons
per molecule, a 1.33% hydrogenation was accounted
(2.06 mg L-1). This sample was taken after 54 min, when
445 C passed through the system. For 4 electrons per
molecule, 990 C, another 86 min were necessary, in a total time of 140 min, and the hydrogenation product was still
low: only 3.08% (4.78 mg L-1).
Conclusions
Chemometric methods were successfully applied to optimize the SPME-GC-FID procedure to determine the electrocatalytic hydrogenation products of cyclohexanone. The analytical method developed showed good linearity, high precision and low detection and quantification limits, allowing its wide use, whatever were the hydrogenation results. The quantification is highly reliable due to the analytical curve.
Acknowledgments
The authors would like to thank Prof. Jean-Claude Moutet for donating the N-(4-carboxybenzyl)-pyrrol. CAPES (Coordenação de Aperfeiçoamento de Pessoal de Nível Superior, Brazil) is acknowledged for the financial support.
References
1. Chapuis, D. J.; Appl. Catal., A2001, 221, 93.
2. St-Pierre, G.; Chagnes, A.; Bouchard, N.-A.; Harvey, P. D.; Brossard, L.; Ménard, H.; Langmuir2004, 20, 6365.
3. Ilikti, H.; Rekik, N.; Thomalla, M.; J. Appl. Electrochem.2002,
32, 603.
4. Dubé, P.; Kerdouss, F.; Laplante, F.; Proulx, P.; Brossard, L.; Ménard, H.; J. Appl. Electrochem.2003,33, 541.
5. Lofrano, R. C. Z.; Madurro, J. M.; Abrantes, L. M.; Romero, J. R.; J. Mol. Catal. A: Chem.2004, 218, 73.
6. Lofrano, R. C. Z.; Madurro, J. M.; Abrantes, L. M.; Romero, J. R.; Langmuir2004, 20, 15.
7. Cirtiu, C. M.; Brisach-Wittmeyer, A.; Ménard, H.; Catal. Commun. 2007, 8, 751.
8. Schneider, R. C. S.; Baldissarelli, V .Z.; Martinelli, M.; von Holleben, M. L. A.; Caramão, E. B.; J. Chromatogr., A2003,
985, 313.
9. Guillard, C.; Théron, P.; Pichat, P.; Pétrier, C.; Water Res.2002,
36, 4263.
10. Sakkas, V. A.; Lambropoulou, D. A.; Sakellarides, T. M.; Albanis, T. A.; Anal. Chim. Acta2002, 467, 233.
11. Oliveira, G. F.; MSc Dissertation, Universidade Federal de Minas Gerais, Brazil, 2004.
12. Teófilo, R. F.; Ferreira, M. M. C; Quim. Nova2006, 29, 338. 13. Eurachem Guide; The Fitness for Purpose of Analytical
Methods, a Laboratory Guide to Method Validation and Related
Topics; LGC: Teddington, UK, 1998.
Received: June 18, 2008
Web Release Date: March 6, 2009
Table 5. Analytical curve data for cyclohexanone hydrogenation
Cyclohexanone convertion / %
Concentration / (g L-1)
Peak intensity / mV 1st response 2nd response
0.0 0.000 0 0
0.5 0.077 850 693
1.0 0.155 792 692
2.0 0.310 1098 1102
4.0 0.620 2761 2372
5.9 1.549 1799 1728
10.0 7.746 4781 4686
12.3 0.914 3794 3594
24.5 1.905 8866 8474
49.0 3.795 17524 18835
50.0 7.591 22699 19872
73.6 11.402 28184 29665
98.1 15.197 39364 40317
Table 6. Variation coefficients for the analysis of cyclohexanol
Sample id Variation coefficient
Inter-essay Intra-essay
P2 4% 6%
P4 2% 3%