Article
Occurrence of Nonylphenol and Bisphenol-A in Surface Waters from Portugal
Débora de A. Azevedoa *, Silvia Lacorteb, PaulaVianac and Damià Barcelób
a
Departamento de Química Orgânica, Instituto de Química, Universidade Federal do Rio de Janeiro, CT, Bl. A, S/603, Ilha do Fundão, 21949-900, Rio de Janeiro - RJ, Brazil
b
Department of Environmental Chemistry, IIQAB-CSIC, Jordi Girona 18-26, Barcelona, 08034, Spain c
Direção Geral do Ambiente, Ministério do Ambiente, Rua da Murgueira, Zambujal, 2720 Amadora, Portugal
A presença de bisfenol A e de isômeros do 4-nonilfenol, compostos que promovem desequilíbrio do sistema endócrino, foi determinada em amostras de águas superficiais de Portugal. O método analítico envolveu a preconcentração de 200 mL de água, utilizando extração por fase sólida com cartuchos OASIS, seguida de análise por cromatografia gasosa acoplada a espectrometria de massas. As recuperações e os limites de detecção do bisfenol A e dos isômeros do 4-nonilfenol foram 119 % e 73 %, respectivamente e 0,002 µg L-1 e 0,01 µg L-1. O método foi aplicado na determinação destes poluentes em águas de rios e costeiras por um período de três meses (agosto-outubro/1999). O total de amostras analisadas foi 135. As concentrações de bisfenol A e dos isômeros do 4-nonilfenol variaram de 0,2 a 4,0 µg L-1 e 0,2 a 30 µg L-1, respectivamente. Somente em duas amostras de água de rios, a concentração dos isômeros de 4-nonilfenol ultrapassou 10 µg L-1 e do bisfenol A 2 µg L-1. Concentrações superiores a estes valores podem causar efeitos estrogênicos em peixes.
The occurrence of the endocrine disruptor compounds, such as 4-nonylphenol isomers and bisphenol A was determined in surface water samples from Portugal. The analytical method used involved the preconcentration of 200 mL of water sample by solid phase extraction (SPE) using a OASIS (Waters) cartridge, followed by Gas Chromatography-Mass Spectrometry (GC/MS) determination. Recoveries and limits of detection of 4-nonylphenol isomers and bisphenol-A were 73 % and 119 %, respectively, 0.01 µg L-1 and 0.002 µg L-1. The method was applied to the determination of these estrogenic pollutants in river and coastal waters during three months (August-October/1999). The total samples analyzed were 135. Concentrations of 4-nonylphenol isomers and bisphenol-A ranged from 0.03-30 µg L-1 and 0.07-4.0 µg L-1, respectively. Only in two river samples, concentrations of 4-nonylphenol isomers were above 10 µg L-1 and bisphenol-A were above 2 µg L-1. These values can cause estrogenic effects in fish and these sampling points require further investigation in order to verify the maintenance of these levels.
Keywords: bisphenol A, 4-nonylphenol, GC/MS, river waters, estrogenic pollutant
Introduction
Nonylphenol isomers and bisphenol A are important contaminants that have been discussed extensively during the last few years due to the adverse effects to wildlife, being endocrine disruptors. For example, polystyrene tubes release nonylphenol and polycarbonate flasks release bisphenol-A. Alkylphenol polyethoxylates are mainly present in surfactants but are also found in paints, herbicides and pesticides formulated products, among others. More than 500,000 tons of alkylphenol polyethoxylates are produced annually worldwide, 60 % of which ends up in the aquatic environment.
Nonionic surfactants (nonylphenol ethoxylates) and alcohol ethoxylates are being used increasingly to remove skin grease in the leather industry1,2. Alkylphenol polyethoxylates have mainly an industrial origin and their incomplete degradation in the sewage treatment plants leads to increasing levels of nonylphenol. These degradation products, nonylphenols, showed estrogenic effects. Alkylphenols are present in certain sewage outlets in concentrations sufficient to feminize certain fish species like trout and carp3,4. The in vivo estimated concentration of octylphenols (and consequently others alkylphenols, as nonylphenol) responsible of vitellogenin induction in rainbow trout is between 1-10 µg L-1 and in male roach is 10-100 µg L-1 5. A widely accepted measure of estrogenicity is the determination of vitellogenin (VTG, a
* e-mail: [email protected]
protein) in male fish plasma2,5,6. It has been hypothesized that endocrine disruptors may play a role in the decrease in the quantity and quality of human semen during the last 50 years, as well as in the increased incidence of testicular cancer and cryptorchidism in males and breast cancer incidence in both females and males1.
Alkylphenols accumulate in river sediment and in the fat of exposed fish. These compounds are found in many environmental samples7-13. Previous study indicated that high concentration of nonylphenols could be responsible for the estrogenicity observed in male carp in two catalan water tributaries, where concentration values reached 6.87 mg L-1 in the outlet of sewage treatment plants2.
Nonylphenol is one of 33 priority substances proposed in the new European Union Water Framework Directive4. It has been also detected in coastal and urban atmospheric samples of the lower Hudson river estuary15.
Bisphenol A is the monomer used in the manufacture of polycarbonate. Polycarbonate, in turn, is used in plastic products with new applications continuously being developed such as lacquer-coated cans, tooth filling, etc16. This compound is also used in dental sealants and composites1. Krishnan et al.17, found that 2-5 µg L-1 of bisphenol-A is hormonally active when they were studying yeast culture medium.
Analysis of nonylphenol isomers and bisphenol A can be accomplished by liquid-liquid extraction or solid phase extraction followed by gas chromatography/mass spectrometry (GC/MS)11,12,15,16,19 or/and liquid chromatography/mass spectrometry (LC/MS)4,18.
Nonylphenol has been previously detected in many water samples: river waters from Tokyo up to 1 µg L-112; drinking water well of Massachusetts up to 33 µg L-110; surface waters of highly industrialized regions at 11-42 µg L-1 9; wastewater effluents in south central Michigan up to 37 µg L-18; surface waters from Canada up to 1µg L-17. However, the normal range in most river stretches was between 0.2 to 12 µg L-1.
In this paper, a GC/MS method for determination of 4-nonylphenol isomers and bisphenol-A in water is reported. The extraction of these compounds from water was carried out by an automated solid phase extraction (SPE) instrument, using an OASIS cartridge. This method has been applied to 135 river and coastal water samples from Portugal during a pilot survey study of three months (August-October/1999). This is the first study that collects sufficient data on levels of 4-nonylphenol isomers and bisphenol A in surface waters from Portugal. This study will also show which sampling points exhibit levels which can be of concern to fish and it is a preliminary work that should lead to further studies of the “hot spots” of
Portuguese waters. Monitoring of other organic pollutants in these Portuguese waters, as pesticides and phenols, has been undertaken previously20-22 and showed that two major contamination sources were present related respectively with industrial and agricultural practices. Highly contaminated areas were detected in the North around Portos and in the Central Part of Portugal (from Monte da Vinha to Esteiro Molta)22 .
Experimental
Chemicals and reagents
4-Nonylphenol was obtained from Kao Corporation (Barcelona, Spain) and Bisphenol-A from Aldrich (Milwaukee, WI, USA). LC-grade solvents acetonitrile and water were obtained from Merck (Darmstadt, Germany). Acetic acid proanalysis grade from Panreac (Barcelona, Spain) was used. Stock solutions of 1000 mg L-1 were prepared by weighing 10 mg of each of the solutes and dissolving them in chromatographic-grade dichloromethane (Merck). They were then stored at –20 oC.
Sampling
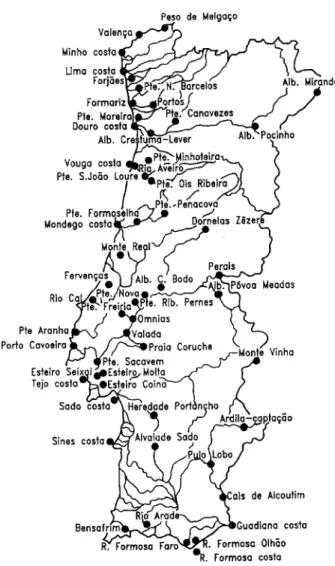
In order to determine the levels of 4-nonylphenol and bisphenol A in the river water samples from Portugal, 45 different sampling sites were established in the area. In this study, samples obtained from each of the sites were collected once a month from August to October. Figure 1 shows the map of Portugal and the sampling points.
Samples were collected in 1 L precleaned amber glass bottles, acidified with acetic acid to pH~4.0, filtered through 1.2 and 0.45 µm glass fiber filters in order to remove suspended particles. Samples were extracted in Portugal’s laboratory and the cartridges transported to Barcelona by plane at 4 oC. The cartridges were kept at –20 oC in the dark until analysis23.
SPE extractions
(1:1) followed by 3.2 mL of dichloromethane at a flow rate of 1 mL min-1. The eluate was evaporated almost to dryness with a gentle stream of nitrogen (N2) and then was transferred to vials utilizing dichloromethane as a solvent. The final sample was weighed and the volume value (0.2-0.3 mL) obtained with the solvent density (density of dichloromethane, ρ = 1.32).
GC/MS conditions
Gas chromatography-mass spectrometry analyses were performed in a Trace GC 2000 Series and Trace MS ThermoQuest Finnigan Instruments equipped with a quadrupole mass analyzer, utilizing helium as carrier gas. Electron impact ionization at 70 eV was used. Interface temperature was 270 oC and source temperature was 200 oC. Separation was performed using a 30 m length, 0.25
mm i.d. fused silica column HP-5MS with 0.25 µm film thickness. Temperature program was held at 60 oC for 1 min, 60 oC to 175 oC at 6 oC min-1, hold at 175 oC for 4
min, 175 oC to 240 oC at 3 oC min-1, hold at 240 oC for 5 min, 240 oC to 300 oC at 7 oC min-1, hold at 300 oC for 1 min. The injection was operated in splitless mode (splitless time of 1 min) at a temperature of 250 oC with a 2 µL injection volume. This multi-ramp temperature program was utilized following previous work in this Portugal survey20. There is no strong advantage to use it only to analyze nonylphenol and bisphenol A. All samples were analyzed in Single Ion Monitoring (SIM) mode for quantitation purposes (major ions corresponding to the typical fragments of the compounds were selected; Table 1) and linear scan (SCAN) mode in the range 70-450 Daltons for comparison of the spectral data against the real standard and library search.
Figure 1. Map of Portugal with selected sampling points.
Table 1. Molecular weight (MW), diagnostic m/z ion, mean percentage recovery (% REC), standard deviation (SD), limits of detection (LOD - µg L-1), calibration equation and coefficients of correlation (R2)
using SPE followed by GC/MS in SIM mode, for 4-nonylphenol isomers and bisphenol-A. The average and ranges were calculated taking into account all analyzed samples in three months (August-October/1999; n=135). Water volume of 200 mL.
4-Nonylphenol isomers Bisphenol-A
Molecular Weight 220 228
Diagnostic m/z ion 135 213
REC (%) 73 119
SD (n=3) 8 15
LOD (µg L-1) 0.01 0.002
Correlation Equation Y= 2E+06X-17749 Y=1E+06X-192797
R2 0.9995 0.9948
Range (µg L-1) 0.03-30 0.07-4.0
Average (µg L-1) 0.80 0.10
Identification by GC/MS
The unequivocal confirmation of the identification of the compounds were carried out by comparison with authentic standards, considering both full mass spectra and retention times, and with the help of the NIST98 standard mass spectral library.
Recoveries
A spike and recovery study was performed to determine the efficiency and reproducibility of the method for each of the target analytes. Three replicates of ground water samples were used. The compounds were spiked in 200 mL of water to give a final concentration of 5.0 µg L-1 of each analyte and subsequently the water was acidified to a lower pH (pH ~ 4.0). Immediately after this operation, the water samples were extracted with the ASPEC XL.
achieved usually by using single ion monitoring (SIM), Table 1. The limits of detection (LODs) were calculated by using a signal-to-noise ratio of 3 (the ratio between the peak intensity under SIM conditions and the intensity of the noise was used).
Quantitation
External standard calibration was used for quantification of the extracts. Calibration curves for SIM mode were plotted using 4-6 points in the concentration 0.05, 0.10, 0.25, 0.5, 1.0 and 2 mg L-1. Calibration equations obtained in SIM mode and R2 values are presented in Table 1. Samples that give a previous concentration value higher than 2 µg L-1 suffer further dilution, leading to concentrations within the calibration curve.
The individual 4-nonylphenols are not commercially available. The standard is a mixture of isomers. These isomers give similar mass spectra presenting different relative abundances for the same ions. Nevertheless, all of them present the m/z 135 fragment as an intense ion in their mass spectra (>50 %). 4-Nonylphenol concentrations reported were the sum of isomers as previously described15,19.
Results and Discussion
Recoveries and limits of detection for 4-nonylphenol isomers and bisphenol-A were 73 %, 119 % and 0.01 µg L-1, 0.002 µg L-1, respectively (Table 1). In 1997, Olmo et al.16 presented a method with limit of detection for bisphenol-A of 0.6 µg L-1. Furthermore, they used a liquid-liquid extraction with dichloromethane in acid medium of 1000 mL of water. Isobe et al.12 obtained a lower limit of detection for bisphenol A, 15 ng L-1, but also utilized 1 L water samples. Rudel et al.10 studied nonylphenol and bisphenol A to characterize their impact to Cape Cod drinking water supplies, by GC/MS but with previous derivatization. Detection limits for 4-nonylphenol and bisphenol A were 0.0106 µg L-1 and 0.0054 µg L-1. They also utilized liquid-liquid extraction of 1000 mL water samples with 60 mL of dichlorometane. By the present method, we obtained even lower LOD values for bisphenol A (2 ng L-1) and similar values for 4-nonylphenol with lower water samples volumes (200 mL) and without any derivatization step.
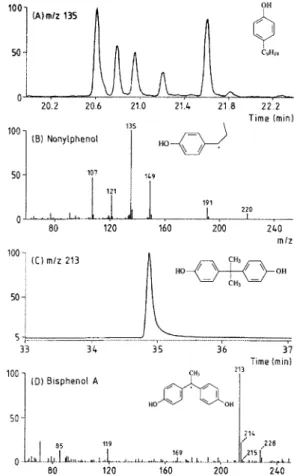
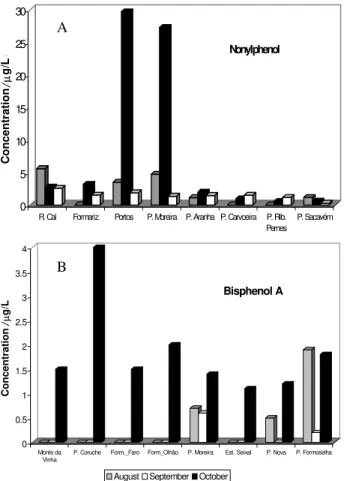
Results of quantitative analyses are reported in Table 2. Figure 2 shows the mass chromatogram for the m/z 135 fragment of 4-nonylphenol isomers, for the m/z 213 fragment of bisphenol-A and also typical mass spectra of positive samples (P. Coruche for bisphenol A; Portos for 4-nonylphenol isomers). Figure 3 shows concentration values for selected positive samples analyzed for 4-nonylphenol isomers and bisphenol A.
Table 2. Concentration (µg L-1) of 4-nonylphenol isomers and Bisphenol
A for selected water samples from Portugal. 4-Nonylphenol concentrations are reported as sum of isomers.
Sample Name August September October Nonylphenol
R. Cal 5.6 2.8 2.6
Formariz nd 3.2 1.5
Portos 3.5 30 1.9
P. Moreira 4.7 30 1.4
P. Aranha 1.2 2.0 1.5
P. Carvoeira nd 1.0 1.5
P. Rib. Pernes nd 0.6 1.2
P. Sacavém 1.2 0.6 0.3
Bisphenol A
Monte da Vinha nd nd 1.5
P. Coruche nd nd 4.0
Form. Faro nd nd 1.5
Form. Olhão nd nd 2.0
P. Moreira 0.7 0.6 1.4
Est. Seixal nd nd 1.1
P. Nova 0.5 nd 1.2
P. Formoselha 1.9 0.2 1.8
nd = not detected; below 0.01 µg L-1 and 2 ng L-1 for nonylphenol and
bisphenol A, respectively.
Analyses of 4-nonylphenol isomers and bisphenol A were carried out in 135 surface water samples from Portugal. 4-Nonylphenol isomers and bisphenol A were detected in 79 % and 51 %, respectively, of the analyzed samples. Only in two of the samples (1.5 %) 4-nonylphenol isomers and bisphenol A were detected in concentrations greater than 10 µg L-1 and 2 µg L-1 , respectively, values considered to cause estrogenic effects in fish. For 4-nonylphenol isomers, 19 water samples (14 %) presented concentration values greater than 1 µg L-1 , a concentration that can also cause such effects. For bisphenol A, concentrations greater than 1 µg L-1 was only observed in ten water samples (7 %). 18 % of the detectable values of bisphenol A and 5 % of 4-nonylphenol isomers were below 0.2 µg L-1 . The average concentration and range for 4-nonylphenol isomers calculated taking into account all the positive samples analyzed were 1.2 µg L-1 and 0.03-30
µg L-1 , respectively. For bisphenol A they were 0.5 µg L-1 and 0.07-4.0 µg L-1 , respectively.
The observed concentrations of 4-nonylphenol isomers and bisphenol-A in river and coastal waters from Portugal are similar to previously observed results in other surface
waters around the world7,10,12. The two sites where concentrations were specially high for 4-nonylphenol isomers, Portos and Ponte Moreira, are located in the northern and more industrialized part of Portugal (see map, Figure 1). Tannery and textile industries are located in this area. Also ethoxylated nonylphenol and other highly water soluble organic compounds have been previously detected in this area14. Nonylphenol has been previously reported in an effluent from textile industry near Porto (Portugal) at concentrations around 510 µg L-1 (sum of the isomers) as analyzed by GC/MS19 and 175 µg L-1 (1998) by LC/MS14.
Conclusions
An environmental analytical procedure has been applied to efficiently determine 4-nonylphenol and bisphenol A in river and coastal water samples from Portugal. The analytical protocol has been applied during a three month period (August-October/1999). 4-Nonylphenol isomers have been detected at values up to 30 µg L-1, while bisphenol-A at values of 4.0 µg L-1. A total of 135 water samples were analyzed. Only in two of them, concentrations greater than 10 µg L-1 of 4-nonylphenol isomers and 2 µg L-1 of bisphenol A were observed; the threshold concentrations stipulated to cause endocrine disruptions effects in fish. 4-Nonylphenol isomers concentration were associated with textile and tannery industry, while it was not possible to associate a particular source for Bisphenol A. Their sampling points need further attention concerning monitoring programs in Portugal. Estrogenic effects in fish should also be investigated in this area.
Acknowledgements
D. A. A. acknowledges a grant from CNPq. Direção Geral do Ambiente, Ministério do Ambiente (Portugal), the EU project of the waste water cluster SANDRINE (ENV4-CT98-0801) and CICYT (AMB/999-1705-CE) are acknowledged for financial support to this project. Rosa Alonso and Roser Chaler are acknowledged for technical assistance.
References
1. Sonnenschein, C.; Soto, A. M. J. Steroid. Biochem. Molec. Biol. 1998, 65, 143.
2. Solé, M.; Alda, M. J. L.; Catillo, M.; Porte, C. Ladegaard-Pedersen, K.; Barceló, D. Environ. Sci. Technol.2000, 34, 5076.
3. Shiraishi, H. ; Carter, D. S.; Hites, R. A. Biomed. Environ. Mass Spectrom.1989, 18, 478.
4. Castillo, M.; Barceló, D. Anal. Chem.1999,71, 3769.
0 5 10 15 20 25 30
Concentration (
µ
g/L)
R. Cal Formariz Portos P. Moreira P. Aranha P. Carvoeira P. Rib. Pernes
P. Sacavém Nonylphenol
0 0.5 1 1.5 2 2.5 3 3.5 4
Concentration (
µ
g/L)
Monte da Vinha
P. Coruche Form._Faro Form_Olhão P. Moreira Est. Seixal P. Nova P. Formoselha
Bisphenol A
August September October
Figure 3. Concentrations (µg L-1) of 4-Nonylphenol isomers (A) and
Bisphenol A (B) after analyses by Gas Chromatography-Mass Spectrometry (GC/MS) for selected positive samples.
A
5. Routledge, E. J.; Sheahan, D. A.; Desbrow, C.; Brighty, E. J.; Waldock, M.; Sumpter, J. P. Environ. Sci. Technol. 1998, 32, 1559.
6. Jobling, S.; Sheahan, D.; Osborne, J. A.; Matthiessen, P.; Sumpter, J. P. Environ. Toxicol. Chem.1996, 15, 194. 7. Bennie, D. T.; Sullivan, C. A.; Lee, H. B.; Peart, T. E.; Maguire, R. J. Sci. Total Environ. 1997, 193, 263. 8. Snyder, S. A.; Keith, T. L.; Verbrugge, D. A.; Snyder,
E. M.;, Gross, T. S.; Kannan, K.; Giesy, J. P. Environ. Sci. Technol. 1999, 33, 2814.
9. Tanghe, T.; Devriese, G. ; Verstraete, W. J. Environ. Qual. 1998,28, 702.
10. Rudel, R. A. ; Melly, S. J. ; Geno, P. W. ; Sun, G. ; Brody, J. G. Environ. Sci. Technol.1998,,32, 861. 11. Ding, W. -H. ; Tzing, S. -H. J. Chromatogr. A1998,
824, 79.
12. Isobe, T.; Satoh, M.; Ogura, N.; Takada, H. Mizu Kankyo Gakkaishi1999,22 , 118. (CA 130:328907h) 13. Sarai, E. ; Hayakawa, S. ; Ichioka, T. ; Kato, S. Mie-Ken Kankyo Kagaku Senta Kenkyu Hokuku1999, 19, 13. (CA 131:23084t)
14. Castillo, M.; Alonso, M. C.; Riu, J.; Barceló, D. Environ. Sci. Technol.1999, 33, 1300.
15. Dachs, J.; Van Ry, D. A.; Eisenreich, S. J. Environ. Sci. Technol.1999, 33, 2676.
16. del Olmo, M.; González-Casado, A.; Navas, N. A.; Vilchez, J. L. Anal. Chim. Acta1997, 346, 87. 17. Krishnan, A. V.; Stathis, P. ; Permuth, S. F.; Tokes, L.;
Feldman, D. Endocrinology 1993, 132, 2279. 18. Castillo, M.; Oubiña, A.; Barceló, D. Environ. Sci.
Technol. 1998, 32 , 2180.
19. Benfenati, E.; Fanelli, R.; Delmonte, M.; Del Frate, D.; Pierucci, P.; Paolillo, A. Anal. Chim. Acta2001 (in press). 20. Azevedo, D. A.; Lacorte, S.; Vinhas, T.; Viana, P.;
Barceló, D. J. Chromatogr. A2000, 879, 13. 21. Azevedo, D. A.; Lacorte, S.; Viana, P.; Barceló, D.
Chromatographia2001, 53,113.
22. Romã, T.; Azevedo, D. A.; Lacorte, S.; Céspedes, R.; Viana, P.; Barceló, D. Environ. Technol. 2001
(accepted for publication).
23. Aguilar, C.; Ferrer, I.; Borrull, F.; Marcé, R. M.; Barceló, D. Anal. Chim. Acta1999, 386, 237.