Article
*e-mail: [email protected]
A New Gas Chromatography/Mass Spectrometry (GC-MS) Method for the
Multiresidue Analysis of Pesticides in Bread
Diana I. Kolberg, Osmar D. Prestes, Martha B. Adaime and Renato Zanella*
Departamento de Química, Universidade Federal de Santa Maria, 97105-900 Santa Maria-RS, Brazil
Neste trabalho desenvolveu-se um método para a determinação de 15 pesticidas em pão utilizando cromatograia gasosa acoplada à espectrometria de massas (GC-MS), operando no modo de ionização química negativa (NCI). No preparo da amostra utilizou-se acetonitrila contendo 1% (v/v) de ácido acético, na presença de acetato de sódio, citrato de sódio e sulfato de magnésio. O método foi validado avaliando os seguintes parâmetros: linearidade, limite de detecção (LOD), limite de quantiicação (LOQ), precisão e exatidão. A faixa linear utilizada foi de 1,0-100 µg L-1. As recuperações foram consideradas satisfatórias apresentando valores entre 70 e 117%, com RSD ≤ 17,6% para quase todos os compostos. O LOQ do método variou de 10 a 20 µg kg-1. O método demonstrou ser adequado, sensível e altamente seletivo para a análise multirresíduo de pesticidas em pão.
In this work a method for the determination of 15 pesticides in bread samples using gas chromatography coupled with mass spectrometry (GC-MS), operating in the negative chemical ionization mode (NCI) was developed and validated. For the extraction procedure acetonitrile containing 1% (v/v) acetic acid was used in presence of sodium acetate, sodium citrate and magnesium sulphate. The method was validated evaluating the following parameters: linearity, limit of detection (LOD), limit of quantiication (LOQ), precision and accuracy. The linear range used was from 1.0 to 100 µg L-1. The recoveries had been considered satisfactory presenting values between 70 and 117% with RSD ≤ 17.6% for almost all the compounds. The real method LOQ ranged from 10 to 20 mg kg-1. The method shown to be adequate for the multiresidue analysis of pesticides in bread and the GC-MS (NCI) proved to be sensitive and highly selective.
Keywords: pesticides, multiresidue, bread, GC-MS
Introduction
Pesticides have played a very important role in the development of the agriculture since their invention, which were still irreplaceable until the present time. Therefore, different countries have promulgated their own residue limits in the international trade. There are many analytical methods for determination of pesticide multiresidues in agricultural products and animal derived foods, but the key technique is: irstly, how several dozens of varieties or even hundreds of pesticide residues can be thoroughly extracted from the complex matrixes; secondly, how a great deal of interfering matters co-extracted with the pesticides can be cleaned up; thirdly, what analytical modes should
be adopted for the pesticide determination.1
Wheat is a major cereal grain cultivated throughout the world and one third of this cereal is consumed by
milling and baking.2,3 Commercially produced bread
is an important component of every day diet in many countries. During bread making process, lour is subjected to biological (fermentation) and physical (baking)
transformation.3,4
The cultivation and storage of grains often require the intensive use of pesticides, which may be present in grains
and in foods prepared from them.5
In the last years, many researchers have published about
pesticide analysis in food matrices.6-13 However, in these
studies the mainly matrices were fruits and vegetables. Sample preparation is always the major bottleneck in any analytical procedure, in 2003 a method that provided high quality results with a minimum number of steps and a low
method was given an acronymic name, QuEChERS, that relected its major advantages (quick, easy, cheap, effective, rugged, and safe). The QuEChERS procedure omits or replaces many complicated analytical steps commonly employed in traditional methods by easier ones. The original procedure consists of extracting the homogenized sample by hand-shake or Vortex with the same amount of acetonitrile in order to have a inal extract concentrated enough without the need of a solvent evaporation step. The technique has attracted the attention of pesticide analysis
studies worldwide,15-18 and a review has been published
recently.19 In the other hand, the research about pesticides
analysis in dry samples (e.g. cereals) and in processed food
still require new developments.20,21
The main objective of this work was demonstrating the potential sample preparation of a miniaturized acetonitrile-based extraction followed by a dispersive solid phase
extraction (D-SPE) clean-up step.13 Unlike traditional
methods using SPE tubes, in D-SPE clean-up is facilitated by mixing bulk amounts of sorbent with a aliquot of extract. In addition evaluating the GC coupled with a quadrupole mass analyzer operated in negative chemical ionization (NCI) mode for sensitive and reliable multiresidue method for pesticide analysis in bread samples.
Experimental
Apparatus
A Varian CP-3800 gas chromatograph equipped with electronic low control (EFC), a 1079 PTV injector, a CP 8400 autosampler and a 1200 triple quadrupole mass spectrometer (Varian, Walnut Creek, USA). Analytical balance HR-120 (A & D, Tokyo, Japan), Ultraturrax blender (Kinematica, Lucerne, Switzerland), bread machine (Britânia, São Paulo, Brazil) and a Jouan C 412 (Saint-Herblain, France) centrifuge were employed.
Reagents and materials
Acetonitrile pesticide residue grade and acetic acid analytical grade were obtained from Merck (Darmstadt, Germany). Toluene and isooctane were both pesticide residue grade (J.T. Baker, Phillipsburg, USA). Anhydrous
magnesium sulphate (MgSO4), anhydrous sodium acetate,
sodium citrate tribasic dehydrate, sodium chloride all reagent grade were purchased from Merck (Rio de Janeiro, Brazil). Water was freshly puriied using a Direct UV3
system (Millipore, Molsheim, France). Adsorbent C18
(55 mm) was obtained from Phenomenex (Torrance, USA).
Polypropylene centrifuge tubes (Sarstedt, Nümbrecht,
Germany), 50 mL volume for initial extraction, and 15 mL volume for D-SPE step were used.
Pesticide solid standards of azoxystrobin, chlorthalonil, chlorpyrifos-ethyl, chlorpyrifos-methyl, dicofol,
a-endosulfan, b-endosulfan, endosulfan-sulfate, endrin,
fenithrothion, lindane, malathion, parathion-ethyl, pirimiphos-methyl and tetradifon (purity > 94.0%) were obtained from Dr. Ehrenstorfer (Augsburg, Germany). Stock
standard solutions (1,000 mg L-1) of individual pesticides
were prepared in toluene. Working standard mixture in
toluene, containing 1 mg L-1 of each pesticide, was prepared
for use as spiking solution and for the analytical curves.
Bread making
The bread sample was made in the laboratory with a bread machine using standard procedure: 750 g of wheat lour was mixed with 10 g dry yeast, 20 g vegetable fat, 5 g salt and 40 g milk powder. The ingredients were mixed and kept for fermentation inside of bread machine at a temperature of 30 ºC during 15 min, after that the temperature was set at 180 ºC for 45 min.
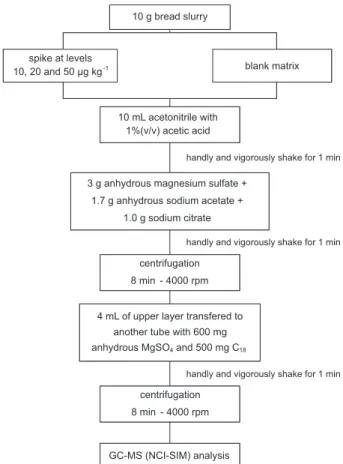
Sample extraction
A sub-sample of 500 g of bread was homogenized in Ultraturrax at high speed with 500 mL of puriied water to give an homogeneous slurry (paste) from which aliquots are taken for analysis.
A 10 g portion of slurry previously homogenized was weighed in a 50 mL centrifuge tube. Ten milliliters of acetonitrile, containing 1% (v/v) of acetic acid, were then added to the sample, and the mixture was hand-shaken for
1 min. Afterwards 3 g of anhydrous MgSO4 were added
and the tube was hand-shaken immediately for 20 s. Later, 1.7 g of sodium acetate and 1 g of sodium citrate were added and the tube was hand-shaken for another 1 min to provide well-deined phase separation after 8 min of centrifugation at 4,000 rpm. During the clean-up step, 4 mL aliquot of the upper layer was transferred to a centrifuge
tube (15 mL) containing 0.6 g of anhydrous MgSO4 and
0.5 g of adsorbent C18. The tube was hand-shaken for 1 min
and centrifuged at 4000 rpm for 8 min. An aliquot of the supernatant was transferred into an autosampler vial to its injection into the GC-MS system. Figure 1 shows a scheme of the modiied QuEChERS method used in this work.
Equipment parameters
(30 m × 0.25 mm I.D., 0.25 mm ilm thickness) from Varian
(Middleburg, The Netherlands). Aliquots of 2 mL of sample
extract were injected into the gas chromatograph. The injector temperature was held at 80 °C for 0.1 min during
injection and then programmed at 200 °C min-1 to 300 °C
which was held for 13 min. The injector liner (3.4 mm i.d.) was illed with a Carbofrit plug (Restek, Bellefonte, USA). The GC oven temperature program was 80 °C for 1.0 min,
followed by a 25 °C min-1 ramp to 180 °C and a inal ramp
of 5 °C min-1 to 280 °C (held for 5 min).Carrier gas was
helium (99.9999% purity; Air Products, Allentown, USA)
at a constant low-rate of 1.3 mL min-1.
The mass spectrometer was operated in negative chemical ionization (NCI) mode using methane (99.999% purity; AGA, São Paulo, Brazil) as the reagent gas. The MS was calibrated with perluorotributylamine (PFTBA). The MS system temperatures of the detector interface was set at 250 °C, the source of ionization at 235 °C and the manifold at 40 °C. A delay time of 7.0 min was set to prevent instrument damage. The MS system was set in selective ion monitoring (SIM) mode and each compound was quantiied based on peak area using three qualiier ions (Table 1). The identiication and conirmation of the pesticides were performed as recommended by the
European SANCO Guidelines.21
Results and Discussion
Method performance and validation
For the validation of the modified QuEChERS method we selected 15 multiclass (organochlorine, organophophorus, pyretroids and others) pesticides (Table 1) for the GC-MS (NCI-SIM) analysis, based on their relevance in wheat cultivation and storing conditions.
Figure 1. Scheme of the modiied QuEChERS method for analysis of pesticides in bread.
Table 1. Retention time and MS determination conditions
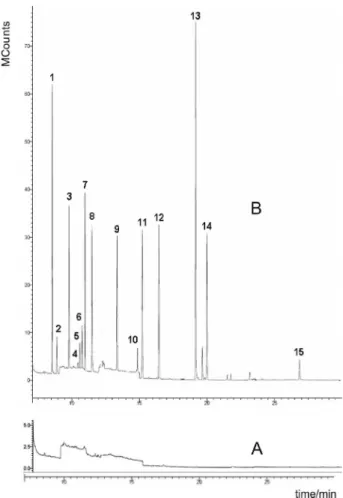
No. Pesticides tR / min Monitored ions / m/z Segment time window / min
1 Lindane 8.54 71+73+255+253 2 7.0-9.1
2 Chlorothalonil 8.89 266+264+268 2
3 Chlorpyrifos-methyl 9.78 141+214+212 3 9.1-10.9
4 Pirimiphos-methyl 10.45 141+304+290 3
5 Fenithrothion 10.59 168+141+169 3
6 Malathion 10.77 157+159+172 3
7 Chlorpyrifos-ethyl 10.98 169+214+212 4 10.9-12.0
8 Paration-ethyl 11.22 154+169+155 4
9 Dicofol 11.49 250+252+251 4
10 a-Endosulfan 13.35 242+240+244 5 12.0-15.0
11 Endrin 14.85 237+239+240 5
12 b-Endosulfan 15.21 99+242+240 6 15.0-19.0
13 Endosulfan-sulfate 16.44 97+386+80+99 6
14 Tetradifon 19.15 320+318+245 7 19.0-23.0
A good resolution of all pesticides studied was achieved with the proposed chromatographic conditions, as demonstrated in Figure 2. The good stability of the GC-MS system used and the low interference noise presented by the sample extracts permitted the quantiication also of compounds less sensitive like pirimiphos-methyl. Based on the pesticides retention time, the GC-MS acquisition method was divided into as many time-windows as possible in order to maximize signal for pesticides that gave low
response.20 This method consisted of 8 retention
time-window segments (Table 1).
Linearity study and detection and quantiication limits
The analytical curves was evaluated with a matrix-matched standard calibration in blank extracts of bread in the concentrations 1.0; 2.0; 4.0; 8.0; 20.0; 50.0 and
100.0 mg L-1, where this sequence was injected six times
(n = 6). Calculations were performed considering the average peak areas, relative standard deviations (RSD),
the determination coeficients (r2) and also linear ranges
were determined for each pesticide analyzed. Most of all
pesticides analysed showed r2 values ≥ 0.99 and linear range
from 1.0 to 100 mg L-1 (Table 2).
From the calibration curves data and the repeatability (RSD%) of the instrument at the lowest concentration level of each pesticide, the intrument limit of detection (LODi) were
estimated via the formula: LODi = 3×RSD×concentration.
Table 2. Calibration data and detection and quantiication limits analysed by GC-MS (NCI)
Pesticicides Linear range /
(µg L-1) Calibration equation r2
LODm / (µg kg-1)
LOQm / (µg kg-1)
Lindane 1.0-100.0 y = 313774x + 208982 0.9981 3.0 10.0
Chlorothalonil 1.0-100.0 y = 48953x + 5817.5 0.9952 3.0 10.0
Chlorpyrifos-methyl 1.0-100.0 y = 306375x + 35078 0.9921 6.0 20.0
Pirimiphos-methyl 1.0-100.0 y = 17958x + 26329 0.9933 3.0 10.0
Fenithrothion 1.0-100.0 y = 72329x + 42067 0.9864 3.0 10.0
Malathion 1.0-100.0 y = 84900x + 51746 0.9767 3.0 10.0
Chlorpyrifos-ethyl 1.0-100.0 y = 306375x + 35078 0.9842 3.0 10.0
Parathion-ethyl 1.0-100.0 y = 137087x + 110675 0.9932 3.0 10.0
Dicofol 1.0-100.0 y = 673192x + 211615 0.9939 6.0 20.0
a-Endosulfan 1.0-100.0 y = 265150x + 200647 0.9988 6.0 20.0
Endrin 1.0-100.0 y = 51354x + 21601 0.9901 3.0 10.0
b-Endosulfan 1.0-100.0 y = 288112x + 306518 0.9983 6.0 20.0
Endosulfan-sulfate 1.0-100.0 y = 433838x + 486547 0.9911 3.0 10.0
Tetradifon 1.0-100.0 y = 308395x + 38078 0.9985 6.0 20.0
Azoxystrobin 1.0-100.0 y = 109167x - 23173 0.9888 3.0 10.0
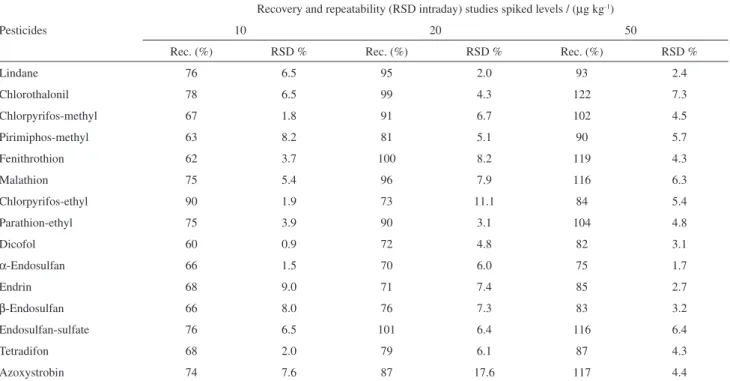
Table 3. Recoveries % (n=6) and RSD (%) obtained by modiied QuEChERS extraction of bread, spiked at 10, 20 and 50 mg kg-1 levels, analysed by GC-MS (NCI)
Pesticides
Recovery and repeatability (RSD intraday) studies spiked levels / (mg kg-1)
10 20 50
Rec. (%) RSD % Rec. (%) RSD % Rec. (%) RSD %
Lindane 76 6.5 95 2.0 93 2.4
Chlorothalonil 78 6.5 99 4.3 122 7.3
Chlorpyrifos-methyl 67 1.8 91 6.7 102 4.5
Pirimiphos-methyl 63 8.2 81 5.1 90 5.7
Fenithrothion 62 3.7 100 8.2 119 4.3
Malathion 75 5.4 96 7.9 116 6.3
Chlorpyrifos-ethyl 90 1.9 73 11.1 84 5.4
Parathion-ethyl 75 3.9 90 3.1 104 4.8
Dicofol 60 0.9 72 4.8 82 3.1
a-Endosulfan 66 1.5 70 6.0 75 1.7
Endrin 68 9.0 71 7.4 85 2.7
b-Endosulfan 66 8.0 76 7.3 83 3.2
Endosulfan-sulfate 76 6.5 101 6.4 116 6.4
Tetradifon 68 2.0 79 6.1 87 4.3
Azoxystrobin 74 7.6 87 17.6 117 4.4
This concentration should be injected and detected
repeatedly for six times. The LOQi was defined as
3.3×LODi. The real method limit of quantiication (LOQm) was based on the recovery results and was deined as the lowest validated spike level meeting the requirements of 70
to 120% of recovery with RSD ≤ 20%.22 For all the analytes
the LODm values were between 3.0 and 6.0 mg kg-1 and
LOQm ranged from 10 to 20 mg kg-1 (Table 2).
Evaluation of modiied QuEChERS method
Sample preparation, carried out following a modiied QuEChERS procedure using buffered acetonitrile and clean-up with the sorbent C18 instead of primary-secondary amine (PSA), provided high throughput with adequate validation parameters and low cost per sample. The recoveries and repeatability (intraday precision) of the studied pesticides at three different spike
concentration levels 10, 20 and 50 mg kg-1, performed at
six replicates for each level, were presented in Table 3. Mean results shown recoveries between 70 and 117% with
RSD ≤ 17.6%. At the lowest level (10 mg kg-1) pesticides
like azoxystrobin, chlorpyrifos-methyl, chlorothalonil,
dicofol, a-endosulfan, b-endosulfan, endrin, fenithrothion
and pirimiphos-methyl not satisied the recovery criteria for validation method, and showed recoveries between
60 and 122%, but with good RSD values (≤ 9%). The
interday precision was performing during 3 consecutive
days, samples spiked at 10, 20 and 50 mg kg-1 levels,
were analyzed. The RSD values were lower than 18.1% for all pesticides.
The developed method was applied to two commercial bread samples and residues of pirimiphos-methyl (88.2
and 283.3 mg kg-1) and fenithrothion (26.3 mg kg-1), both
pesticides allowed for use in wheat grains storage.
Conclusions
In this study we optimized parameters and evaluated performance characteristics of GC-MS with negative chemical ionization for the analysis of multiple pesticides in bread. The modiied QuEChERS extraction method used in this study minimized the time, labor and cost of the sample preparation. The proposed method allowed the determination at low detection limits with good precision and accuracy. The combination of quick extraction and simultaneous determination for 15 pesticides enables rapid and eficient monitoring of pesticide residues in an important food. It was conirmed that the proposed method is suitable for routine residue monitoring.
Acknowledgments
the Coordenação de Aperfeiçoamento de Pessoal de Nível Superior (CAPES), Brazil.
References
1. Pang, G. F.; Cao, Y. Z.; Zhang, J. J.; Fan, C. L.; Liu, Y. M.; Li, X. M.; Jia, G. Q.; Li, Z. Y.; Shi, Y. Q.; Wu, Y. P.; Guo, T. T.; J. Chromatogr., A 2006, 1125, 1.
2. Kihlberg, I.; Johansson, L.; Kohler, A.; Risvisk, E.; J. Cereal Sci. 2004, 39, 67.
3. Sharma, J.; Satya, S.; Kumar, V.; Tewary, D. K.; Chem. Health Safety 2005, 12, 17.
4. Kaushik, G.; Satya, S.; Kaik, S. N.; Food Res. Int. 2009, 42, 26. 5. Vela, N.; Pérez, G.; Navarro G.; Navarro, S.; J. AOAC Int. 2007,
90, 544.
6. Hercegová, A.; Dömötörová, M.; Matisová, E.; J. Chromatogr., A 2007, 1153, 54.
7. Maštovská, K.; Lehotay, S.; J. Chromatogr., A 2004, 1040, 259. 8. Lehotay, S.; Maštovská, K.; Lightield, A. R.; J. AOAC Int. 2005,
88, 615.
9. Díez, C.; Traag, W. A.; Zommer, P.; Marinero, P.; J. Chromatogr., A 2006, 1131, 11.
10. Aysal, P.; Ambrus, Á.; Lehotay, S. J.; Cannavan, A.; J. Environ. Sci. Health, Part B 2007, 42, 481.
11. Titato, G. M.; Bicudo, R. C.; Lanças, F. M.; Int. J. Mass Spectrom. 2007, 42, 1348.
12. Maldaner, L.; Santana, C. C.; Jardim, I. C. S. F.; J. Liq. Chromatogr. Relat. Technol. 2008, 31, 972.
13. Kolberg, D. I. S.; Presta, M. A.; Wickert, C.; Adaime, M. B.; Zanella, R.; J. Braz. Chem. Soc. 2009, 20, 1220.
14. Anastassiades, M.; Lehotay, S.; Štajnbaher, D.; Schenk, J. F.; J. AOAC Int. 2003, 86, 412.
15. Hernández-Borges, J.; Cabrera, J. C.; Rodríguez-Delgado, M. A.; Hernández-Suárez, E. M.; Saúco, V. G.; Food Chem. 2009, 113, 313.
16. Kmellár, B.; Fodor, P.; Pareja, L.; Ferrer, C.; Martínez-Uroz, M. A.; Valverde, A.; Fernandez-Alba, A. R.; J. Chromatogr., A 2008, 1215, 37.
17. Mezcua, M.; Ferrer, C.; García-Reyes, J. F.; Martínez-Bueno, M. J.; Sigrist, M.; Fernández-Alba, A. R.; Food Chem. 2009, 112, 221.
18. Stubbings, G.; Bigwood, T.; Anal. Chim. Acta 2009, 637, 68. 19. Prestes, O. D.; Friggi, C. A.; Adaime, M. B.; Zanella, R.; Quim.
Nova 2009, 32, 1620.
20. Walorczyk, S.; J. Chromatogr., A 2007, 1165, 200. 21. Walorczyk, S.; J. Chromatogr., A 2008, 1208, 202.
22. SANCO, Document no. SANCO/2007/3131; Directorate General Health and Consumer Protection, 2007, pp. 1-35. 23. Pizzutti, I.; Kok, A. de, Zanella, R.; Adaime, M. B.; Hiemstra, M.;
Wickert, C.; Prestes, O. D.; J. Chromatogr. A 2007, 1142, 123.
Received: July 31, 2009