Article
Printed in Brazil - ©2012 Sociedade Brasileira de Química0103 - 5053 $6.00+0.00
A
*e-mail: [email protected]
Application of
β
-Cyclodextrin/MnFe
2O
4Magnetic Nanoparticles as a Catalyst for
Fast Chemiluminescence Determination of Glutathione in Human Blood using
Luminol-Diperiodatoargentate(III) System
Behzad Rezaei,* Ali A. Ensafi, Fariba Haghighatnia and Saeed E. Aalaye
Department of Chemistry, Isfahan University of Technology, Isfahan 84156-83111, I. R. Iran
Este trabalho baseia-se na quimioluminescência (CL) intensificada da reação entre luminol e diperiodato de prata (III) (K[Ag(H3IO6)2], DPA) em solução alcalina para determinação
da glutadiona (GSH). Na presença de nanopartículas magnéticas do complexo de inclusão β-ciclodextrina (β-CD)/nanopartículas magnéticas MnFe2O4 (MNPs), os resultados experimentais
mostraram que a emissão CL foi muito rápida (tempo de resposta de ca. 1 s, parâmetro muito importante em análise clínica) e aguda (sinal CL aumentado de 9 vezes). Os efeitos catalíticos das MNPs β-CD/MNPs MnFe2O4 na resposta CL do sistema luminol-DPA foram investigados.
A linearidade do método dependeu da concentração da GSH nos intervalos de 5,0 × 10⁻⁸ a
4,0 × 10⁻⁶ mol L–1, o limite de detecção calculado foi 1,5 × 10⁻⁸ mol L–1 e desvio padrão relativo
de 2,8% para 9 replicatas de GSH 8,0 × 10⁻⁷ mol L–1. O método proposto foi aplicado com sucesso
na determinação rápida e sensível da GSH em amostras de sangue humano.
This work is based on the enhanced chemiluminescence (CL) of the reaction between luminol and diperiodatoargentate(III) (DPA) {K[Ag(H3IO6)2]} in alkaline solution fordetermination
of glutathione (GSH). In the presence of inclusion complex β-cyclodextrin(β-CD)/MnFe2O4
magnetic nanoparticles (MNPs), the experimental results showed that theCL emission was very fast (response time of about 1 s, which is a very important parameter in the clinical analysis) and sharp (CL signal increased 9 times). The catalytic effects of β-CD/MnFe2O4 MNPs on the CL
response of luminol-DPA system were investigated. The linearly of method depended on GSH concentration in the ranges of 5.0 × 10⁻⁸ to4.0 × 10–6 mol L–1 and limit of detection calculated
was 1.5 × 10⁻⁸ mol L–1 and relative standard deviation of 2.8% for 9 replicated measurements of
8.0 × 10⁻⁷ mol L–1 GSH. The proposed method was successfully applied for rapid and sensitive
determination of GSH in human blood samples.
Keywords: chemiluminescence, MnFe2O4 magnetic nanoparticles, glutathione, human blood,
luminol-diperiodatoargentate(III)
Introduction
Aminothiols are biological agents, which are important physiologically. The levels of these compounds are important in plasma and urine as biomarkers in a number of clinical diagnoses.1 Glutathione (GSH) is an intracellular
tripeptide present in all tissues (Figure 1a). Variation in the GSH status has relationship with the pathogenesis of several diseases such as liver injury, cancer, diabetes mellitus, cataract, inflammatory diseases and radiation damages. Variation in the GSH concentration might also be due to the pollution, cigarette smoke, side effects of drugs and aging.2 GSH can be bound to proteins or occur freely in
the cells.Measurement of free GSH in the blood samples is essentialto estimate the detoxification and redox status of cellsbecause it has the protective role against oxidative and freeradical-mediated radiation cell injury.3
A number of methods used for the determination of GSH have been reported including enzymatic,4
spectrophotometric,5-7 high performance liquid
chromatography (HPLC),8,9 electrochemical methods10-18 and
chemiluminescence.19-23 The spectrophotometric methods
are simple but not sufficiently sensitive. HPLC methods are usually time-consuming for sample preparation and in need of pure and sometimes toxic solvents and most of the electrochemical methods have high limits of detection.
simplicity of detection, low limit of detection, wide linear dynamic ranges, short analysis times and relatively low cost of instrumentation which make this method appealing. One of the best and most efficient CL reactions is the oxidation of luminol in the basic solutions which can be oxidized by some strong oxidants such as diperiodatoargentate(III) (DPA). DPA, with the following complex [Ag(HIO6)2]5− in
formula alkaline media, is a powerful oxidizing agent in this medium.24
DPA, whose chemical structure in the aqueous media is proposed in Figure 1b, has a plane-square coordinate structure around a central metal and can be easily synthesized.
Recently, it was reported a new CL system based on the reaction of [Ag(HIO6)2]
5– complex with luminol for
the determinations of cortisol and DPA.25,26 The produced
CL signal from luminol is followed by the formation of dinegative ions of luminol which reacts with oxygen or other oxidizing agent to yield an excited state of the aminophthalate ion responsible for the emission of light.27
The chemiluminescent oxidation of luminol is notably enhanced, both in intensity and duration, in the presence of natural cyclodextrins (α-, β-, γ-CD). The results are explained in terms of the binding between the luminescent intermediate of the reaction, 3-aminophthalate (3-AP) and CD, rather than to the luminescent reactant itself.28
In recent years, more attention has been given to the metallic and magnetic nanoparticles (MNPs) because of their catalytic effect, super paramagnetic behavior, large ratio of surface to volume and low toxicity. In most investigations, magnetic nanoparticles were used for supporting catalytic action of the porous materials such as a nanostructured metal catalyst.29-38
The solute molecules that have the correct dimensions can interact with the cyclodextrin cavity, which is nonpolar, and form the inclusion complexes. The reduced
for the CL analysis of hydrogen peroxide based on an inclusion complex of CoFe2O4 magnetic nanoparticles. In
this work, the kinetic properties of the luminol-DPA system on the CL spectra of GSH were studied in the presence and absence of catalyst. It is described the novel inclusion complexes of β-CD/MnFe2O4 MNPs as catalysts for the
luminol-DPA CL system. The proposed system was used for very fast, sensitive and selective CL determination of GSH in the human blood samples.
Experimental
Reagents and solution
Luminol (5-amino-2,3-dihydrophthalazine-1,4-dione) was purchased from Merck(Germany Company). Luminol stock solution was prepared by dissolving 0.0177g of it in aspecified amount of potassium hydroxide solution and then diluted with doubly distilled water to 100.0 mL to obtain the 1.0 × 10⁻³ mol L-1 concentration. β-CD (beta
cyclodextrin hydrate 99%) was purchased from Acros Organics (New Jersey, USA).
DPA was synthesized according to reference considering facts such as the use of micro filter for separating precipitate and shielding the solution container from light by aluminum foil during the heating process.24
The prepared complex, determined by the spectroscopic method, showed UV-Vis peak with maximum absorbance at 362 and 253 nm as shown in Figure 2.DPA stock solution of 2.5 × 10⁻⁴ mol L–1 was freshly prepared by dissolving
0.0121 g of DPA in doubly distilled water and diluting to 100.0 mL in a volumetric flask.
Stock solution of GSH (Merck, Germany) was prepared by dissolving 0.0100 g of GSH in deionized water and diluting to 10.0 mL in a volumetric flask. All of the solutions were freshly prepared and stored in a refrigerator. MnFe2O4
(MNPS) was prepared at physics laboratory ofIsfahan
University of Technology (I. R. Iran).
The chemical materials used to prepare MnFe2O4
(Merck, Germany) were ferric nitrate, manganese nitrate,
citric acid and ammonia. At first, an appropriate amount of metal nitrates and citric acid were dissolved in a minimum amount of deionized water to make a clear solution. Molar ratio of nitrates to citric acid was 1:1. Using this procedure, the solution was continuously stirred through a magnetic agitator. Then, the mixed solution was poured into a petri dish and heated and stirred continuously to transform into a xerogel, then the powder was heated at 300 oC for 1 h.
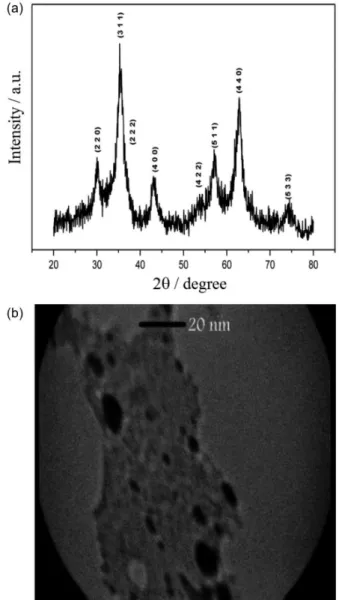
The crystal structure of samples was analyzed using a X-ray diffractometer (Philips EXPERT MPD) with Cu-Kα (λ = 0.154 nm) radiation. The magnetic properties of the samples were determined by ac susceptibility measurements (AC susceptometer Lake Shore, Model 7000) and vibrating sample magnetometer (VSM) at room temperature. Figure 3a shows the X-ray diffraction (XRD) pattern for the sample at room temperature. The observed diffraction peaks are indexed to a cubic spinel phase. The average crystallite size of the sample was estimated by the Scherrer formula. The result showed that the average crystallite size was around 5.7 nm. Figure 3b shows the typical transmission electron micrograph of the sample. TEM image indicated that the uniform nanoparticles (about 5 nm) were well distributed and some agglomeration occurred and the ferrit nanoparticles had a tendency to agglomerate. Serum samples were taken from the Health Center of Isfahan University of Technology.
Preparation of the β-CD/MnFe2O4 MNPs
Three solutions of the inclusion complexes were prepared by mixing three samples of0.0020 g of MnFe2O4 MNPs in
the specified amount of1.0 × 10–4 mol L–1β-CD solution.
Then, this β-CD solution was dissolved in three separate containers of 25.0 mL of H2O, KOH and H2SO4 to yield
the neutral solution, solution of 0.020 mol L–1 KOH and
0.010 mol L–1 H
2SO4 respectively. Further, mixtures were
stirred at room temperature and kept for the nextuse for 20 min.
Apparatus
The CL-batch system used in this work is shown in Figure 4.27 It consisted of 1.0 mL quartz cell located
directly in front of the window of a detector. The detector isa Hamamatsu photo multiplier tube (PMT, Tokyo, Japan Model R212) connected to an amplification and filtration
processing system. The CL signal was recorded in terms of time by the computer.
Spectrometric measurements were performed by UV-Vis spectrophotometer JASCO (Tokyo, Japan).
Experimental procedure
In the batch system, firstly, DPA and luminol solutions were mixed in equal volumes (250 µL)under optimum conditions to create base CL signal. When the baseline
Figure 2. UV-Vis spectrum of DPA complex.
became stable, GSH sample solutions (250 µL) were injected to be mixed with the reagent. The produced CL signal was detected by a photomultiplier tube (operated at −1000 V) and recorded by the computer. The CL intensity I, (I = I1 − I0, in which I1 and I0 were
the CL intensity of sample solutions and blank solution, respectively) was converted to GSHconcentration using a calibration curve.
range of 5.0 × 10⁻⁸ to 5.0 × 10⁻⁶ mol L–1, DPA concentration
of 2.5 × 10⁻⁴ mol L–1 and luminol concentration of
5.0 × 10⁻⁵ mol L–1 (Figure 5a). It was observed that KOH
concentration of 2.0 × 10⁻² mol L–1 had a higher CL
intensity. So, this concentration was used in the magnitude studies.
The effect of luminol concentration on the CL intensity was studied in the range of 5.0 × 10⁻⁶ to 1.0 × 10⁻⁴ mol L–1
of luminol, KOH concentration of 2.0 × 10⁻² mol L–1, DPA
Figure 5. (a) Effect of KOH concentration on the CL intensity; conditions: [DPA] = 2.5 × 10⁻⁴ mol L–1; [luminol] = 5.0 × 10⁻⁵ mol L–1. (b) Effect of luminol
concentration on the CL intensity; conditions: [DPA] = 2.5 × 10⁻⁴ mol L–1; [GSH] = 1.0 × 10⁻⁶ mol L–1; luminol in 0.020 mol L–1 KOH solution. (c) Effect
concentration of 2.5 × 10⁻⁴ mol L–1 and GSH concentration
of 1.0 × 10⁻⁶ mol L–1 (Figure 5b). The results have
demonstrated that the CL signal has increased by increasing the luminol concentration up to 3.0 × 10⁻⁵ mol L–1.
Additional increase in the luminol concentration decreases the CL signal. Therefore, luminol concentration of 3.0 × 10⁻⁵ mol L–1 was selected for further study.
The influence of DPA concentration on the CL intensity was investigated in the range of 5.0 × 10⁻⁵ to 5.0 × 10⁻⁴ mol L–1
using 250 µL of GSH of 1.0 × 10⁻⁶ mol L–1 under the
optimum conditions. The results indicated that as DPA concentration increase up to 1.0 × 10⁻⁴ mol L–1, CL signals
increased and after that the signals decreased (Figure 5c). Therefore, DPA concentration of 1.0 × 10⁻⁴ mol L–1 was
selected for further studies.
Catalytic influence of MnFe2O4 MNPs and β-CD on the CL
signal
The variations of CL intensity for different amounts of β-CD/MnFe2O4 MNPs (controlled by different volumes
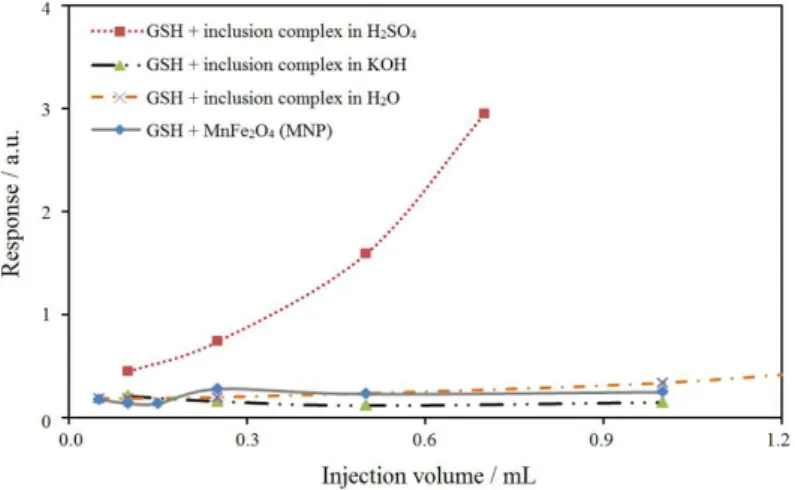
of the inclusion complex injected in the specific GSH solution) were studied in the range of 0.05-1.0 mL of the inclusion complex in different media. The results showed that higher CL intensity could be achieved in the presence of β-CD/MnFe2O4 MNPs in acidic medium (Figure 6). As
it was shown, an increase in the volume of the inclusion complex added to GSH solution created higher CL signals but when the volume of the inclusion complex in acidic medium was higher than 0.5 mL, the system became saturated and CL intensity was not dependent on the GSH concentration changes. Therefore, 0.5 mL of an inclusion complex in the acidic medium was selected to be added to the solutions by the specific GSH concentrations for future studies.
Analytical performance
Under the optimum conditions, dynamic ranges were obtained for the range of 5.0 × 10⁻⁸ to 4.0 × 10⁻⁶ mol L–1
of GSH. The CL intensity could be fitted by the equation I = 0.9954CGSH – 0.0738 (r
2 = 0.9885), where GSH
concentration was equal to CGSH × 10–6 mol L–1 and Iwas
the CL signal intensities (Figure. 7). The limit of detection was 1.5 × 10⁻⁸ mol L–1 (3S
b/m, Sb is standard deviation of
blank and m is slope of the calibration curve) in the presence of β-CD/MnFe2O4 MNPs in the acidic medium and
the relative standard deviation was 2.8% for 9 repeated measurements for GSH of 8.0 × 10⁻⁷ mol L–1.
Interference study
In order to decrease the effects of interference substances in the analysis, the effect of diverse ions and some amino acids commonly present in the blood samples
Figure 6. Effect of the amount of the inclusion complex ofβ-CD/MnFe2O4 MNPs and MnFe2O4 MNPs on the CL intensity in different media; conditions: [GSH] = 8.0 × 10⁻⁷ mol L–1; [ luminol] = 5.0 × 10⁻⁵ mol L–1 (in 0.02 mol L–1 KOH solution); [DPA] = 2.5 × 10⁻⁴ mol L–1.
Figure 7. Calibration curve of GSH under the optimum conditions: [DPA] = 1.0 × 10⁻⁴ mol L–1; [luminol] = 3.0 × 10⁻⁵ mol L–1 (in 0.02 mol L–1
in the plasma, the GSH is measured in erythrocyte after removing serum, thus these do not have any significant effect on the determination of GSH. It is necessary to mention that, in human blood, more than 99.5% of GSH is present in erythrocytes,43 thus, it is possible to determine
the GSH without any serious interference.
Procedure for the preparation of the blood samples
In order to determine the GSH in human blood, erythrocytes should be separated from thewhole blood by removing the plasma. At first, the human blood (5.0 mL) was centrifuged for 10 min at 3000 rpm. Then, supernatant (plasma) was discarded and the rest was mixed with the 3.0 mL of NaCl 0.9% m/v. The mixture was centrifuged for 15 min at 1500 rpm and washing procedure was repeated by mixing with NaCl solutions three times in order to completely remove the plasma. Then the rest
of GSH and 5,5’-dithiobis-2-nitrobenzoic acid) or DTNB (Ellman’s reagent).
Thiols react with DTNB to produce 2-nitro-5-thiobenzoate which is ionized to the TNB2– dianion
in neutral and alkaline media. In the spectrophotometric method, TNB2– is quantified by measuring the absorption
of light at 412 nm.44 For the chemiluminescence method,
0.5 mL of the supernatant was diluted to 100.0 mL. Then, 5.0 mL of this solution were diluted to 50 mL until GSH concentration entered the dynamic range. Then the amount of GSH available in the solution was determined under optimum condition by the proposed CL method.
Applications
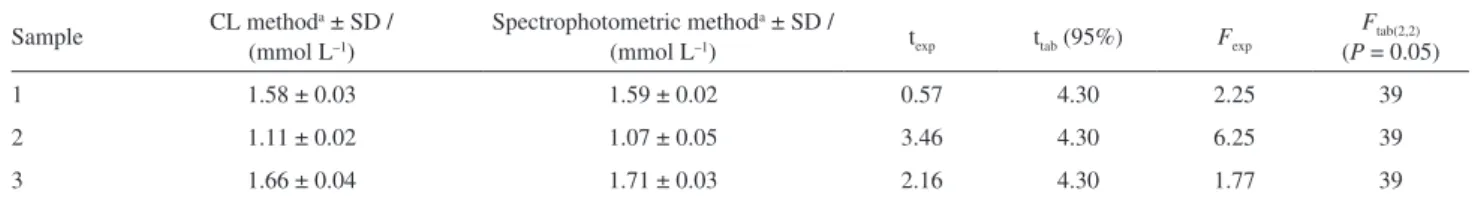
To evaluate the application of the proposed method, GSH was measured in the human blood samples. At first, the proposed CL technique was used for determination of GSH in the erythrocyte samples of humans. Also, the standard spectrophotometric method (Ellman’s standard method) was used for determination of GSH in erythrocyte samples of humans. For each sample of blood, the GSH determination was repeated three times and the mean and the standard deviation of the results were recorded. The results, presented in Table 2, were compared with t-test and F-test for evaluation of the accuracy and precision of the proposed method. There is a good agreement between the results and this is a good evidence for reproducibility and accuracy of the proposed method. The obtained values were in the normal range of GSH concentration in human blood.45
Table 1. Effect of foreign substances on the determination of GSH under optimized conditions
Substances Substance concentration/
glutathionea ratio
NaNO3, KCl, KNO3, urea, aspartic acid 1000
Glucose, fructose 750
L-Cystine, NaBr, D-leucine 500
Phenylalanine, cysteine, glycine 250
Tryptophan 10
Methionine, ascorbic acid 1
aGlutathione concentration of 8.0 × 10⁻⁷mol L–1.
Table 2. Concentration values obtained from the reported and reference method for glutathione analysis in human blood for three normal cases
Sample CL method
a ± SD /
(mmol L–1)
Spectrophotometric methoda ± SD /
(mmol L–1) texp ttab (95%) Fexp
Ftab(2,2)
(P = 0.05)
1 1.58 ± 0.03 1.59 ± 0.02 0.57 4.30 2.25 39
2 1.11 ± 0.02 1.07 ± 0.05 3.46 4.30 6.25 39
3 1.66 ± 0.04 1.71 ± 0.03 2.16 4.30 1.77 39
Study of the chemiluminescence spectra
The determination of GSH was based on the increasing effect on the light emissiongenerated by the oxidation of luminol by DPA in a basic medium. In order to investigate the kinetic characteristics of the reaction, CL reaction kinetics was studied. After mixing the DPAsolution with luminol under the optimum condition, a baseline CL signal was created. Whenthe baseline became stable, the GSH sample solutions were injected to that mixture and the CL reaction took place after being mixed with the reagents. The CL signal intensity reached the maximum value within about 10 s. The typical CL signals for three different concentrations of GSH were shown in Figure 8a. In order to study the role of β-CD/MnFe2O4 MNPs in the acidic medium (catalyst),
0.5 mL of this solution was mixed with an appropriate amount of GSH stock solution, which were mixed in the volumetric flask and diluted to 25 mL. Thus, different concentrations of GSH including catalyst were prepared and then injected into the solution containing the mixture of reagents in the cell and the CL signal was recorded. The CL intensity signal reached the maximum value within 1 s. Typical CL signals of 5.0 × 10⁻⁸ mol L–1 GSH is shown in
Figure 8b with and without catalyst under the optimum conditions. As can be seen, the application of this catalyst dramatically made the CL intensity increase and response time decrease about ten times.
CL mechanism
The proposed CL mechanism for the CL reaction catalyzed by β-CD containing the inclusion complex of MnFe2O4 MNPs is shown in Scheme 1. In the first step,
hydroxide ions present in the alkaline medium deprotonated DPA. In the second step, monoperiodateargentate(III) could be produced by replacement of a ligand, as shown in previous studies,46 and then AgIII oxidized GSH to produce
a GSHfree radical. In the previous studies, in DPA-luminol system for determination of some drugs, oxidation was occurred by DPA and a free radical was produced.24,47 Based
on the above discussion, reactions 1, 2 and 3 are proposed. It was recognized that luminol can form the anion, as shown in reaction 4 in the alkaline medium, and can be oxidized by AgIII to the semidione structure (reaction 5). Based on
the CL enhancement of GSH in the DPA-luminol reaction, it was recommended that GSH radical could oxidize the luminol anion to semidione structure, as shown in reaction 6, and it was a competitive reaction with reaction 5.
The semidione reacts with solute oxygen to produce the peroxy radical (reaction 8). Then, it decomposes to reach an electronically excited state by loss of nitrogen and generates
CL emission (reaction 9). It is possible that the basis of the CL mechanism would be without catalyst.When an inclusion complex of β-CD/MnFe2O4 MNPs in the acidic medium
(catalyst) was added to GSH solution and then injected into the DPA-luminol system, CL intensity significantly increased. It can be due to the interaction between β-CD/MnFe2O4 MNPs inclusion complexes with the reactants
or intermediates of the reaction of luminol with GSH. When β-CD/MnFe2O4 MNPs inclusion complex was introduced
into the luminol-DPA system as the catalyst, luminol free radicals might be stabilized on the surface of β-CD/MnFe2O4
Figure. 8. (a) Typical CL signal for three different concentrations of GSH (5.0 × 10⁻⁸, 5.0 × 10⁻⁷, and 1.0 × 10⁻⁶ mol L–1) under the optimum
conditions:[DPA] = 1.0 × 10⁻⁴ mol L–1; [luminol] = 3.0 × 10⁻⁵ mol L–1
(in 0.02 mol L–1 KOH). (b) Comparison signal intensity of GSH
(5.0 × 10⁻⁸ mol L–1) with and without the catalyst (β-CD/MnFe 2O4 MNPs
in 0.010 mol L–1 H
Scheme 1. Possible CL process of luminol-DPA-GSH with and without β-CD/MnFe2O4 MNPs. O N O N .
+ O2
O N O N O2 . (8) (7) (5) (6)
R CH NH.+ OH- +
COOH COOH + N N. O O NH2 + N N. O O NH2
Ag(III)* + AgOH+ H
3IO6 2- + 2 H2O + OH
-NH2 NH
2 NH NH O O NH2
O N O
N
H2N
O N O N . NH2 2 2 O N O NH NH2 O N O N . NH2
R CH NH2+ H2O
O O O O NH2 O O O O * O O O O
NH2 NH
2
(10)
*
N CH2SH
O O
N COOH
H H
R:
B-CD MnFe2O4
O O O O NH2 O O O O * O N O N O2 (9) + Ag (III)*
.
NH2 NH2 N2 + light + AgOH+ H3IO6 2-O N O N O2 NH2 *
+ OH
-2 2 O N O N O2
NH2 *
+
MNPs inclusion complex by adsorption and consequently, formation of luminol free radicals are accelerated. So, the probability of interaction of luminol free radical with oxygen which has dissolved in the solvent is increased (reaction 7). Furthermore, hydrophobic-hydrophobic interactions between the OH groups of β-CD and anion of luminol can help this process.
Moreover, the solved oxygen can be absorbed on the surface of β-CD/MnFe2O4 MNPs and makes the formation
of the dianion radical molecules easy and then makes excited molecule decay very fast to emit CL photon (reaction 10). In addition, the cyclodextrin cavity can protect the excited state of the dianion of luminol from species normally occurring in an aqueous solution, which could inactivate and quench it.
When an inclusion compound of β-CD/MnFe2O4
MNPs is prepared in H2O and/or in KOH, there would
not be significant increase in the CL intensity because negative molecules of β-CD were formed in the water or in the alkaline medium repulsing the anion of luminol. Furthermore, naked MnFe2O4 MNPs could not cause
significant increase in the CL intensity by itself; this indicated that, in the present CL reaction, MnFe2O4 MNPs
had no catalytic effects by itself.
Response characteristic
In the proposed method, β-CD/MnFe2O4 MNPs is
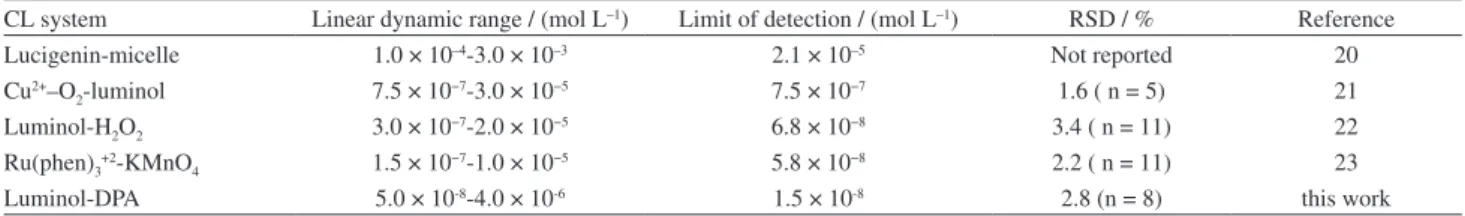
recommended as a novel catalyst which has an enhanced role in the CL intensity of luminol-DPA reaction and also decreases the speed of GSH analysis time more than ten times. The results of the proposed method for GSH determination is compared with the other CL methods presented in Table 3. As it is shown, the proposed method had a better dynamic range and lower limit of detection and, most importantly, its response time was shorter in comparison with the proposed methods.
Conclusion
In this study, a novel class of inclusion compounds is presented. They are inclusioncomplexes of β-CD/MnFe2O4
MNPs in the acidic medium as catalysts for the CL system using luminol-DPA as a model. The use of this catalyst increases dramatically (9 times) the CL intensity and the response time (the time that peak has reached its maximum level) decreases about ten times. The current investigation has demonstrated the potential of inclusion complexes based on β-CD/MnFe2O4 in the acidic medium as an
efficient enhancement reagent for the luminol CL system. Measurement of GSH level in human blood is a benefit as it serves as a biomarker for some diseases. The present method is capable of measuring GSH in blood and is statistically precise in comparison with the Ellman’s reference method. These facts suggest the luminol-DPA CL reaction can be a promising detection system for HPLC or capillary electrophoresis in GSH determinations in biological medium. The proposed method has prominent advantages including instrumental simplicity, high sensitivity and selectivity and an easy handling procedure.
Acknowledgements
The authors express thanks to the Research Council and Center of Excellency in Sensor and Nano of Isfahan University of Technology (IUT) for supporting this work. Also, thanks to Dr. P. Kameli, Department of Physics in Isfahan University of Technology.
References
1. Hu, C.; Hu, S.; J. Sensors 2009, 2009, 1.
2. Havel, K.; Pritts, K.; Wielgos, T.; J. Chromatogr., A1999, 853, 215.
3. Pastore, A.; Piemonte, F.; Locatelli, M.; Russo, A. L.; Gaeta, L. M.; Tozzi, G.; Federici, G.; Clin. Chem. 2001, 47, 1467. 4. Griffith, O. W.; Anal. Biochem. 1980, 106, 207.
5. Swatditat, A.; Tsen, C. C.; Anal. Biochem. 1972, 45, 349. 6. Eyer, P.; Podhradsky, D.; Anal. Biochem. 1986, 153, 57. 7. Wang, L.; Wang, L.; Xia, T.; Bian, G.; Dong, L.; Tang, Z.;
Wang, F.; Spectrochim. Acta, Part A2005, 61, 2533.
8. Gotti, R.; Andrisano, V.; Gatti, R.; Cavrini, V.; Candeletti, S.; Biomed. Chromatogr. 1994, 8, 306.
Table 3. Comparison of linear dynamic ranges and limit of detections obtained by various methods
CL system Linear dynamic range / (mol L–1) Limit of detection / (mol L–1) RSD / % Reference
Lucigenin-micelle 1.0 × 10⁻⁴-3.0 × 10⁻³ 2.1 × 10⁻⁵ Not reported 20
Cu2+–O
2-luminol 7.5 × 10⁻⁷-3.0 × 10⁻⁵ 7.5 × 10⁻⁷ 1.6 ( n = 5) 21
Luminol-H2O2 3.0 × 10⁻⁷-2.0 × 10⁻⁵ 6.8 × 10⁻⁸ 3.4 ( n = 11) 22
Ru(phen)3+2-KMnO
4 1.5 × 10⁻⁷-1.0 × 10⁻⁵ 5.8 × 10⁻⁸ 2.2 ( n = 11) 23
15. Moore, R. R.; Banks, C. E.; Compton, R. G.; Analyst2004, 129, 755.
16. Stricks, W.; Kolthoff, I. M.; J. Am. Chem. Soc. 1952, 74, 4646. 17. Jin, W. R.; Zhao, X.; Xiao, L.; Electroanalysis2000, 12, 858. 18. Ensafi, A. A.; Taei, M.; Khayamian, T.; Karimi-Maleh H.;
Hasanpour, F.; J. Solid State Electrochem. 2010, 14, 1415. 19. Wang, S.; Ma, H.; Li, J.; Chen, X.; Bao, Z.; Sun, S.; Talanta
2006, 70, 518.
20. Hinze, W. L.; Reihl, T. E.; Singh, H. N.; Baba, Y.; Anal. Chem.
1984, 56, 2180.
21. Kamidate T.; Watanabe, H.; Talanta1996, 43, 1733. 22. Wang, L.; Li, Y. X.; Zhao, D. H.; Zhu, C. Q; Microchim. Acta
2003, 141, 41.
23. Han, H. Y.; He, Z. K.; Zeng, Y. E.; Microchim. Acta2006, 155, 431.
24. Yang, C.; Zhang, Z.; Wang, J.; Luminescence2010, 25, 36. 25. Shi, H.; Xu, X.; Ding, Y.; Liu, S.; Li, L.; Kang, W.; Anal.
Biochem.2009, 387, 178.
26. Ma, L.; Fan, M.; Xu, X.; Kang, W.; Shi, H.; J. Braz. Chem. Soc.
2011, 22, 1463.
27. Garcia-Campana, A. M.; Baeyens, W. R. G.; Chemiluminescence in Analytical Chemistry; Marcel Dekker: New York, USA, 2001,
ch. 5.
28. Maeztu, R.; Tardajos, G.; lez-Gaitano, G. G.; J. Phys. Chem. B
2010, 114, 2798.
29. Lin, J. M.; Liu, M. L.; J. Phys. Chem. B2008, 112, 7850. 30. Duan, C. F; Cui, H.; Chem. Commun. 2009, 18, 2574.
Microchim. Acta2008, 163, 263.
37. Hildebrand, H.; Mackenzie K.; Kopinke, F. D.; Environ. Sci. Technol.2009, 43, 3254.
38. Abu-Rezig, R.; Alper, H.; Wang, D.; Post, M. L.; J. Am. Chem. Soc.2006, 128, 5279.
39. G a r c i a - C a m p a n a , A . M . ; B a ey e n s - Wi l l y, R . G . ; Chemiluminescence in Analytical; Marcel Dekker: New York,
USA, 2001, ch. 11.
40. Nowicki, A.; Zhang, Y.; Leger, B.; Rolland, J. P.; Bricout, H.; Monflier E.; Roucoux, A.; Chem. Commun. 2006, 296, DOI: 10.1039/B512838B.
41. Bocanegra-Diaz, A; Mohallem, N. D. S.; Sinisterra, R. D.; J. Braz. Chem. Soc.2003, 14, 936.
42. He, S.; Shi, W.; Zhang, X.; Li, J.; Huang, Y.; Talanta2010, 82, 377.
43. Ensafi, A. A.; Khayamian, T.; Hasanpour, F.; J. Pharm. Biomed. Anal. 2008, 48, 140.
44. Ellman, G. L.; Arch. Biochem. Biophys. 1959, 82, 70. 45. Monostori, P.; Wittmann, G.; Karg, E.; Turi, S.; J. Chromatogr.,
B: Anal. Technol. Biomed. Life Sci. 2009, 877, 3331.
46. Hiremath, D. C.; Hiremath, C. V.; Nandibewoor, S. T.; E-J. Chem. 2006, 3, 13.
47. Xu, X.; Shi, H.; Ma, L.; Kang W.; Li, S.; Luminescence2009, 26, 93.
Submitted: October 25, 2012