Printed in Brazil - ©2004 Sociedade Brasileira de Química 0103 - 5053 $6.00+0.00
Article
* e-mail: [email protected]
# Present address: Curso de Química, Universidade Estadual do Oeste do Paraná, CP 521, 85903-000 Toledo - PR, Brazil
Determination of Chloramphenicol in Tablets by Electrogenerated Chemiluminescence
Cleber Antonio Lindino*,# and Luís Otávio S. Bulhões
Departamento de Química, Universidade Federal de São Carlos, CP 676, 13565-905 São Carlos - SP, Brazil
O antibiótico cloranfenicol foi determinado em drágeas por quimiluminescência eletrogerada acoplada a sistemas FIA utilizando-se como espécie luminescente o complexo Ru(bipi)32+. O
cloranfenicol provoca um decréscimo na intensidade luminescente do complexo de rutênio que é proporcional à concentração sendo linear entre 5 x 10⁻⁵ e 1 x 10⁻³ mol L-1. Para 12 medidas sucessivas
o desvio padrão relativo obtido foi ≤ 1,5 % na concentração de 1 x 10⁻⁴ mol L-1. O cloranfenicol foi
determinado em drágeas com sucesso, sem interferência dos excipientes contidos na matriz. Os resultados obtidos com o método proposto não diferem estatisticamente dos obtidos por espectroscopia na região do ultravioleta ao nível de confiança de 95 %.
Chloramphenicol was determinate by electrogenerated chemiluminescence coupled to FIA using Ru(bpy)32+ luminescent complex. Chloramphenicol cause a decrease in luminescence intensity from
the ruthenium complex that is proportional to its concentration between 5 x 10⁻⁵ and 1 x 10⁻³ mol L -1. The relative standard deviation was estimated as ≤ 1.5 % for 1 x 10⁻⁴ mol L-1 chloramphenicol
solution of 12 successive injections. The chloramphenicol was determined in tablets with success and the soluble components of the matrix did not interfere in the luminescent emission. Results obtained with the luminescent procedure were not statistically different from those obtained by UV-spectrophotometry at the 95 % confidence level.
Keywords: electrogenerated chemiluminescence, FIA, chloramphenicol, pharmaceutical tablets
Introduction
The antibiotic chloramphenicol was isolated from cultures of Streptomyces venezuele and was obtained by chemical synthesis in 1948.1 It presents high lipossolu-bility, characteristic that facilitates to cross the lipid barriers easily being recommended for the treatment of meningitis. Its toxicity is derived from its action on the mitochondria synthesis of proteins and may cause serious secondary effects.
The recommended methods in pharmacopoeias for determining chloramphenicol in pharmaceuticals involve UV-spectrophotometry and HPLC, but present limited selectivity and are often subjected to interferences from components of the matrix.2,3 Chloramphenicol has also been determined by electroanalytical methods exploiting partial reduction of the nitro group in an irreversible process, with poisoning of the electrodes.4,9 Electrochemiluminescence (ECL) has not been yet used, but it can contribute to the
chloramphenicol determination. ECL involves light emission by electrochemical reactions in the surface of an appropriate electrode. With the sensitivity of the chemiluminescence, ECL increases the control of the mechanism and the speed of the reaction, being possible to obtain analytical information by electrochemical response of the species. The light emission is centralized close to the electrode surface that can be appropriately positioned in relation to the detector for maximum sensitivity.10
transitions between a d-orbital of the ruthenium and a π* antibonding orbital of the ligand.12 This transfer transition indicates a triplet-excited state with emission at 620 nm.
This paper reports an ECL-FIA procedure for the direct determination of the chloramphenicol in commercial pharmaceuticals. Flow injection analysis (FIA) was coupled to ECL in order to obtain faster determinations and low reagent consumption.
Experimental
All solutions were prepared with analytical grade reagents (Sigma) and destilled/deionized water (Milli-Q system by Milli-Pore Inc.; water resistance 18 MΩ). Chloramphenicol P.A. was obtained from Sigma. The complex Ru(bpy)3Cl2. 6H2O was synthesized starting from RuCl3.13
The buffer solution was prepared with 0.2 mol L-1 boric acid, 0.1 mol L-1 sodium phosphate and, for the different studied pH values, was adjusted with citric acid.6
The commercial tablets containing chloramphenicol were triturated and the required amount was weighed being diluted in buffer solution pH 9.1 with 1.0 x 10⁻³ mol L-1 complex ruthenium. Insoluble particles were easy eliminated by filtration through a Whatman # 5 paper filter. The electrochemiluminescence in situ system in that both reagent production and further chemiluminescence reaction detection occur within the electrochemical cell was used. The ECL system consists of a photomultiplier tube (model 1151 SSR Instruments) and a flow cell inside in a light-tight box to avoid the interference of diffuse light. The photomultiplier tube shows a fluctuation in the dark current of 0.54 ± 0.04 nA. The current generated by the photomultiplier tube is measured by a model 616 KEITHLEY electrometer and the signal is registered in a plotter. The potential was applied to the flow cell with an EG & G model 283 potentiostat/galvanostat coupled to a computer. The flow rate was controlled with an ISM 761 Ismatec peristaltic pump furnished with Tygon pumping tubes. A manual injector/commutator was used. The housed-acrylic resin flow cell (Figure 1) contained a platinum disc working electrode with an area of 0.2 cm2, an Ag/AgCl reference electrode and a stainless steel counter electrode attached to the flow cell outlet. Before each measurement, the system was cleaned with buffer solution and the platinum electrode was polished. A platinum electrode treated and polished gave a more reproducible electrochemiluminescence signal. Figure 2 shows the diagram of the flow injection manifold and the ECL system. The UV spectrophotometric determinations were accomplished in a Varian Cary spectrophotometer model 5G.2
Results and Discussion
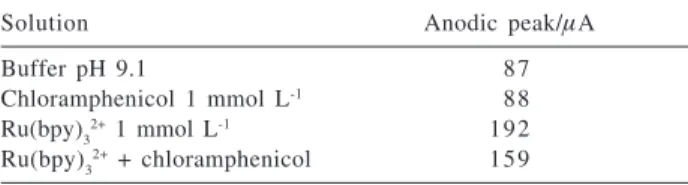
Chloramphenicol causes the decrease of the [Ru(bpy)32+]* emission in the studied pH by quenching with decrease the quantum yield of the ruthenium complex. Energy exchange should take place between eletronic, vibrational, rotational and translational energy modes and include collisional ‘short-range’ transfer, a bimolecular process by collision that depends on the contact between the excited molecule and other species with transfer of non-radiant energy of the complex in the form excited for the chloramphenicol molecule.14 This process is controlled by diffusion. At pH 9.1 the ratio Ru(bpy)32+ /chloram-phenicol is minimum with maximum sensitivity and lowest baseline noise. Amperometric method was used during the ECL measurements for investigating the quenching effect from chloramphenicol. Data were obtained in potentials between 0.5 and 1.1 V (Ag/AgCl/KCl 3.0 mol L-1) in the buffer solution pH 9.1 with platinum as working electrode. Results are shown in Table 1.
Table 1. Anodic peak current for solutions of the Ru(bpy)32+
/chloram-phenicol
Solution Anodic peak/µA
Buffer pH 9.1 08 7
Chloramphenicol 1 mmol L-1 08 8
Ru(bpy)32+ 1 mmol L-1 192
Ru(bpy)32+ + chloramphenicol 159
Temperature of 25.0 °C.
Figure 2. Flow diagram of system for chloramphenicol determination. P = peristaltic pump; I-C = injector/commutator; L = sampling loop; DET = detector; W = waste; C = carrier (buffer); S = sample. The filled area indicates the following position of the injector/ commutator.
Figure 1. Picture of flow cell, superior view. WE = working electrode; RE = reference electrode (Ag/AgCl/KCl 3 mol L-1); AE auxiliary
Chloramphenicol causes a decrease in the current of anodic peak during the oxidation of the Ru(bpy)32+. As chloramphenicol does not oxidize under anodic potentials, possibly adsorption of the chloramphenicol in the electrode surface is occurring, blocking the ruthenium complex oxidation and consequently quenching the light emission.
Thus, two processes should occur in the quenching of [Ru(bpy)32+]* by chloramphenicol: the non-radiant energy transfer from complex to chloramphenicol and the poisoning electrode by its adsorption.
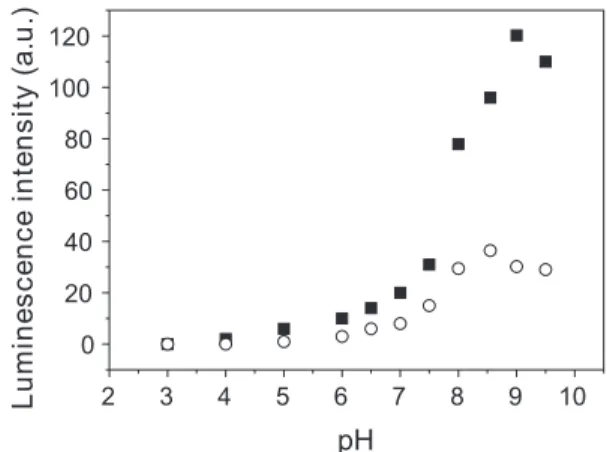
Figure 3 shows the dependence of luminescent intensity on the flow rate of the carrier. The linear velocity must be optimized relatively to the reaction time course. In general, the maximum ECL emission is obtained at low linear velocities for slow reactions and at high linear velocities for fast reactions.15 The flow rate of carrier stream was fixed as 4.2 mL min-1 and its give the best response with highest luminescence intensity. The sampling loop was fixed as 470 µL, with good analytical signal, low baseline noise and low consumption of sample. The dispersion coefficient was calculated as 1.8 and the residence time as 8.5 s. The highest light emission was observed at pH 9.1 and decay in pH higher than 9.2. At pH values above 7.0 hydroxide ions are known to produce chemiluminescence with ruthenium complex.16,17 The optimum pH measured represent the best stability and reactivity of the Ru(bpy)32+ reagent.18 Figure 4 shows the influence of pH on the luminescent intensity.
The species Ru(bpy)32+ is oxidized under the potential of 1.1 V in buffer solution (pH > 7.0), in a reversible process involving one electron, generating the radical species that yields the radiation emission. In the presence of analyte, the chemiluminescence reaction is started by the heterogeneous transfer of electrons from the Ru(bpy)32+ species and to the electrode, proceeded by a homogeneous reaction among the oxidized species Ru(bpy)33+ and the analyte in the diffusion layer.19 The chemiluminescence intensity is dependent upon the efficiency and mechanism of the reduction to the excited state [Ru(bpy)32+]* species. Only a fraction of the total Ru(bpy)32+ is oxidized in the surface of the electrode and the Ru(bpy)33+ is the limiting reagent in chemiluminescence reactions. For this reason, the concentration of the complex was kept as 1.0 x 10⁻³ mol L-1. Figure 5 shows the voltammetric behavior of the ruthenium complex. Potential was scanned from 0.5 to 1.2 V at a scan rate of 50 mV s-1. The oxidation wave with Ep = 1.1 V it Ag/AgCl and the reduction peak at 1.04 V in this voltammogram correspond to the Ru(bpy)32+/3+ system. After all the parameters were optimized, the ECL res-ponse to chloramphenicol within the range from 5 x 10⁻⁵
and 1 x 10⁻³ mol L-1 (16.15 mg mL-1 and 323.1 mg mL-1) was obtained. The obtained analytical calibration curve is described by the equation: y = -554.32 + 103.79 log x, where y is the luminescence intensity (in arbitrary units)
Figure 3. Flow rate influence in luminescence intensity in pH 9.1 buffer solution.
Figure 5. Cyclic voltammogram of 1 x 10⁻³ mol L-1 Ru(bpy) 32+ at
platinum working electrode in pH 9.1. Scan rate = 50 mV s-1;
refe-rence electrode = Ag/AgCl; temperature = 25.0 °C.
Figure 4. Variation of ECL intensity with pH. Temperature of 25.0 °C; applied potential = 1.1 V; flow rate = 4.2 mL min-1; sample volume
= 470 µL. Ru(bpy)32+* { Ru(bpy) 3
and x is the chloramphenicol concentration in mg mL-1. The correlation coefficient was estimated as 0.996 (n = 5). The limit of detection20 was calculated as 1 x 10⁻⁵ mol L-1 and the relative standard deviation was estimated as ≤ 1.5% for 1 x 10⁻⁴ mol L-1 chloramphenicol solution of the 12 successive injections. For measurements in different days and on same prepared solutions, the stability of the electrochemiluminescence system is 3.3% for five measurements of each sample.
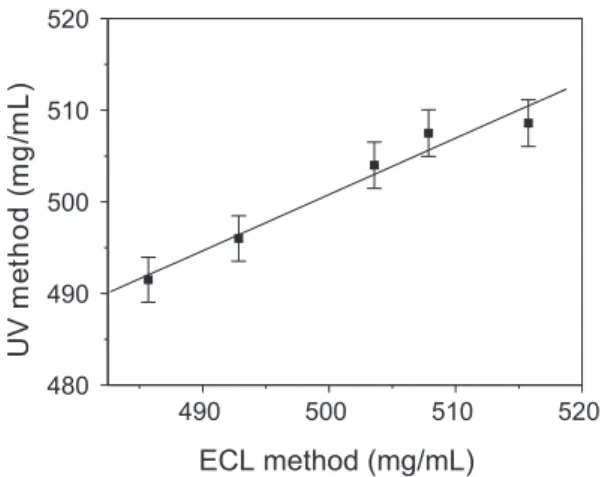
Commercial samples of pharmaceuticals (tablets; 500 mg chloramphenicol) were analyzed by ECL and the results were compared with alternative UV-spectropho-tometric method.2,3 The samples were processed and analyzed in triplicate. Results obtained with the ECL procedure were not statistically different from those obtained by UV-spectrophotometry at the 95% confidence level (t-test). The differences between the nominal and determined values are in accordance to the Brazilian legislation.21 The data obtained by the ECL method compared with the UV method (Table 2) shows that there is good agreement in the obtained results, with deviation of 1.4%. Figure 6 shows the correlation between the content of chloramphenicol in tablets obtained by UV method and
Table 2. Comparative results. Data in mg mL-1, refer to ECL-FIA
and UV-spectrophotometry
Samplea ECL-FIA UV- Error 1 Error 2
spectrophotometry
1 486 ± 15 491 ± 10 - 5 -14
2 508 ± 70 507 ± 60 +1 +80
3 503 ± 2o 504 ± 20 - 1 +30
4 516 ± 15 509 ± 70 +7 +16
5 493 ± 80 496 ± 50 - 3 -70
a three replicate measurements; Error 1: absolute error between ECL
and UV-spectrophotometry; Error 2: absolute error between ECL and nominal value (500 mg/tablets).
Figure 6. Correlation between ECL method and UV-spectrophotometry for chloramphenicol determination. Error bars 0.5%.
ECL method, with correlation coefficient of 0.982 (n = 5) and deviation of 0.5% in the results. This indicates that, within of the error of both methods, ECL can be an alternative in the chloramphenicol determination in pharmaceuticals with intricate matrix.
The response of the chloramphenicol in samples containing other products such as excipients was compared with the response of a solution containing only the analyte.22 The values of recovery were between 97.0 and 103.5% without interference from the matrix components. The system permits up to 50 samples to be analyzed per hour and requires about 0.36 mg ruthenium complex and 470 µL sample per determination.
Conclusions
The ECL-FIA method can be successfully used for the determination of chloramphenicol in tablets with advantages in time of analysis, simplicity, cost and accuracy, without requering extensive pretreatment. This technique can be used in the determination of compounds with low molar absorptivity that limit or reduce the reliability in analyses by UV-spectrophotometry. The effect of matrix of the samples is small with recoveries are within 97 and 104 %.
Acknowledgements
The authors thank FAPESP and CNPq for the financial support.
References
1. Fonseca, A. L.; Antibióticos na Clínica Diária, 5th ed., EPUC:
Rio de Janeiro, 1994.
2.The US Pharmacopoeia XXIII, The National Formulary: MD, USA, 1995.
3.British Farmacopoeia, Her Majesties Stationary Office: Lon-don, 1993.
4. Hess, G.B.; Anal.Chem. 1950, 22, 649.
5. Yarnitzky, C.; Smith, W.F.; Int. J. Pharm.1991, 75, 161. 6. Sreedhar, N.Y.; Reddy, S.J.; Bull. Electrochem.1992, 8, 341. 7. Feng, M.; Long, D.J.; Fang, Y.Z.; Anal. Chim. Acta 1998,
363, 67.
8. Zhao, M.; Hu, J.B.; Lai, Y.C.; Li, Q.L.; Wu, Z.D.; Anal. Lett.
1998, 31, 237.
9. Bautista, J.A.G.; Mateo, J. V. G.; Calatayud, J. M.; Anal. Chim. Acta 2000,404, 141.
10. Knight, A.W.; Trends Anal. Chem.1999, 18, 47.
11. Gerardi, R.D.; Barnett, N.W.; Lewis, S.W.; Anal. Chim. Acta
12. Lee, W. Y.; Mikrochimica Acta1997, 127, 19.
13. Broomhed, J.; Young, C.; Inorganic Syntheses, John Wiley and Sons: New York, 1982, vol. XXI.
14. Wayne, C.E.; Wayne, R.P.; Photochemistry, Oxford University Press: Oxford, UK, 1999.
15. Shultz, L.L.; Stoyanoff, J. S.; Nieman, T. A.; Anal. Chem.
1996, 68, 349.
16. Lee, W-Y.; Nieman, T.A.; Anal. Chem. 1995, 67, 1789. 17. Rubinstein, I.; Martín, C. R.; Bard A. J.; Anal. Chem. 1983, 55,
1580.
18. Brune, S. N.; Bobbitt, D.R.; Talanta1991, 38, 419. 19.Farmacopéia Brasileira , 4th ed., Atheneu Editora: São Paulo,
1988.
20. Bard, A.J.; Faulkner, L. R.; Electrochemical Methods: Funda-mentals and Applications, John Wiley and Sons: New York, 1980.
21. Ruzicka, J.; Hansen, E. H.; Chemical Analysis, John Wiley and Sons: New York, 1988, vol. 62.
22. Green, J. M.; Analytical Chemistry News and Features1996, 305 A.
Received: July 26, 2002
Published on the web: February 13, 2004