0103 - 5053 $6.00+0.00
A
r
ti
c
le
* e-mail: [email protected]
Application of the Semi-Empirical Topological Index in Quantitative
Structure-Chromatographic Retention Relationship (QSRR) Studies of Aliphatic Ketones and
Aldehydes on Stationary Phases of Different Polarity
Berenice da S. Junkes, Renata D. de M. C. Amboni, Rosendo A. Yunes and Vilma E. F. Heinzen*
Departamento de Química, Universidade Federal de Santa Catarina, Campus Universitário, Trindade, 88040-900 Florianópolis - SC, Brazil.
O índice semi-empírico topológico, desenvolvido previamente por Heinzen e Yunes, foi aplicado para predizer a retenção cromatográfica de cetonas e aldeídos alifáticos, em fases estacionárias de diferentes polaridades (HP-1, HP-50, DB-210 e Innowax). Foram estabelecidas regressões lineares simples entre os índices de retenção experimentais e os índices semi-empíricos topológicos (RIExp = a + bIET) para cada fase estacionária separadamente, sendo que os parâmetros estatísticos obtidos foram de qualidade satisfatória. A polaridade das fases estacionárias indicada pela polaridade de McReynolds (PR), encontra-se refletida nos coeficientes das equações (a e b) obtidos para HP-1,
HP-50, DB-210 e Innowax, os quais aumentam linearmente a medida que a polaridade também aumenta (intercepto). As análises estatísticas indicaram que os modelos de correlação quantitativa estrutura-retenção cromatográfica (QSRR) obtidos em fases estacionárias de baixa a média polaridade (HP-1 e HP-50) têm maior estabilidade e habilidade de predição do que os obtidos em fases estacionárias polares (DB-210 e Innowax). Sendo assim, pode-se concluir que, em fases estacionárias consideradas de baixa a média polaridade, o método semi-empírico topológico empregando somente um descritor obteve melhores resultados do que métodos que utilizaram descritores múltiplos.
The semi-empirical topological index, previously developed by Heinzen and Yunes, has been applied to predict the chromatographic retention of aliphatic ketones and aldehydes on stationary phases of different polarities (HP-1, HP-50, DB-210 and Innowax). Simple linear regressions between the retention indices and the semi-empirical topological indices (RI = a + bIET) were established for each stationary phase separately, showing satisfactory statistical parameters. The polarity of the stationary phases, indicated by McReynolds polarity (PR), is reflected in the coefficients
of the equations (a and b) obtained for HP-1, HP-50 and DB-210, which linearly vary as the polarity of the stationary phase increases (intercept). Statistical analyses showed that the quantitative structure-chromatographic retention relationship (QSRR) models obtained on stationary phases of low-to-medium polarity (HP-1 and HP-50) have higher stability and predictive ability than those on polar stationary phases (DB-210 and Innowax). Thus, it can be concluded that the semi-empirical topological method, using only one descriptor, yielded better results on low-to-medium polarity stationary phases than methods that used multiple descriptors.
Keywords: QSRR, topological descriptor, semi-empirical topological index, aldehydes, ketones
Introduction
Correlations between gas chromatographic retention indices and molecular parameters provide significant information on the effect of molecular structure on retention time and possible mechanisms of absorption and elution. In recent years, our group has contributed with a number of quantitative structure-chromatographic retention relationship (QSRR) studies.1-5 The influence of
the stationary phase polarity on the correlation and prediction of the retention of a variety of compounds by using different molecular descriptors has been the focus of several publications.6-20
The most recently published articles on QSRR are summarized as follows. Héberger and co-workers14-16
ketones and aldehydes, on different stationary phases at four temperatures. From the results obtained, the following conclusions were drawn by the authors: (i) the retention behavior of ketones and aldehydes can not be completely distinguished from each other;14 (ii) the models obtained
using physico-chemical properties were slightly better than those obtained by MLR using chemical-quantum descriptors; (iii) the variables used in the last model suggested that the role of the steric factors must be more important for retention than the polar effects.16 Guo et al.17
employed the MLR and the artificial neural network (ANN) techniques to predict the chromatographic retention of saturated alcohols on stationary phases of different polarities using molecular topological indices. Good QSRR models were obtained to predict the retention index of 98 saturated esters on seven different polar stationary phases by MLR using the chemical descriptors proposed by Wang et al..18
The molecular interactions are complex and generally involve forces such as dispersion, orientation, induction, and electron donor-acceptor, including hydrogen-bonding forces.17,22,23 The steric hindrance of substituent groups
within the solute molecule can also affect the chromato-graphic behavior.23,24 The dispersion forces have a
predominant role in the interactions between non-polar molecules and non-polar stationary phases. Therefore, with polar molecules, such as aldehydes and ketones, the polar effects should be taken into account especially with polar stationary phases.
The contribution of the stationary phase to chromato-graphic retention should be reflected by the polarity, which is the most representative chromatographic property. Over the years, the system of stationary phase selectivity constants introduced by Rohrschneider and extended by McReynolds has become the most quoted and widely used indicator for evaluation of gas chromatographic polarity and selectivity.11,25
We have recently developed a new topological index, called semi-empirical topological index (IET), based on new considerations on the chromatographic behavior of apolar and low-polarity stationary phases. This index was initially developed to predict the chromatographic retention for linear and branched alkanes and linear alkenes with the objective of differentiating their cis- and
trans-isomers and to obtain QSRR models.3 Subsequently, it was
successfully extended to other classes of compounds.4,5
The equation obtained to calculate IET was generated using the molecular graph, the values attributed to the carbon atoms, and the functional group, observing the experi-mental chromatographic behavior, and further supported by theoretical considerations. The main advantage of the
use of the semi-empirical topological method is that it is able to differentiate isomeric compounds3,26,27 and to predict
chromatographic retention from simple linear regression using a single topological index.
The main goal of the present study is to verify the predictive ability of the semi-empirical topological index, IET, on stationary phases having different polarities for ketones and aldehydes. A second goal is to use IET in an attempt to obtain insights about the mechanism of chromatographic retention with more polar phases.
Experimental
Calculation of semi-empirical topological indices
The generation of semi-empirical topological indices, IET, for linear and branched ketones and aldehydes was described in a previous paper.4 In the present approach,
the molecules are represented by hydrogen-suppressed molecular graphs based on the chemical graph theory,28
where the carbon atoms and the C=O groups (ketones and aldehydes) were considered as vertexes of the molecular graph of these compounds. The contribution coming from carbon atoms and from C=O groups to the chromatographic retention was represented by a single symbol, Ci, as may be observed from equation 1. Thus, the semi-empirical topological index (IET) is expressed as:
(1)
where Ci is the value attributed to C=O fragments and/or to each carbon atom i in the molecule; and δi is the sum of
the logarithm of the values of each adjacent carbon atom (C1, C2, C3, and C4) and/or the logarithm of the value of the adjacent C=O group.
The values attributed to the carbon atoms and to the functional groups (Ci) for aldehydes and ketones were calculated by numerical approximation, based on experimental retention indices and supported by theoretical considerations (Table 1).4
Data set
The Kováts indices of aliphatic ketones and aldehydes were taken from the report by Hérberger and co-workers.16
Regression analysis
The Origin®,30 and Bilin (a program developed by
Kubiny)31 computer programs were used in the regression
analysis. To test the quality of the regression equations, the determination coefficient (r2), and the standard
deviation (SD) were utilized as statistical parameters. The
Bilin computer program was used to perform
cross-validation tests (r2
CV) by the “leave-one-out” method 32 in
order to verify the validity and stability of the QSRR models obtained.
Results and Discussion
The semi-empirical topological index (IET) was developed for a large set of organic compounds on low polarity stationary phases.3-5,26,27 For aldehydes and
ketones, one of the most important aspects in chromatographic retention is the dispersion interaction between the surfaces of the solute and the stationary phase, which is related to steric factors and molecular size.
However, it is necessary to take into consideration the permanent dipole moment of the carbonyl group, which should provoke dipole-induced dipole interactions with any apolar stationary phase.4 Obviously, the interactions
Table 1. Values of Ci attributed to the primary, secondary, tertiary and quaternary carbon atoms, in the α, β, and γ positions attached to the C=O group, and to the C=O group for aliphatic ketones and aldehydes (Ci)
Fragment Fragment position Ci
HC=O aldehyde 2.094
C=O 2 1.71
C=O 3 1.69
C=O Middle of the chaina 1.60
-CH3 - 1.00b
-CH2 - 0.90b
>CH- α 0.73
>CH- β 0.70
>CH- γ 0.765
>C< α 0.61
>C< β 0.61
a For compounds with more than 6 carbon atoms in the carbon
chain; b reference 3.
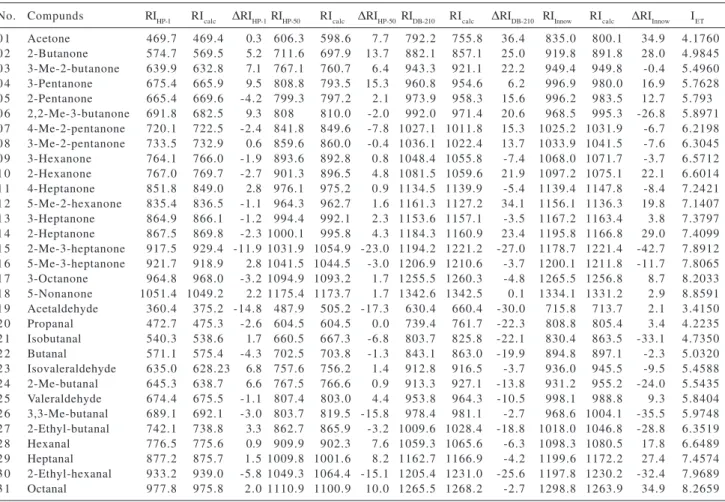
Table 2. Values of experimental retention indices on HP-1 (RIHP-1), HP-50 (RIHP-50), DB-210 (RIDB-210), and Innowax (RIInnow), calculated retention indices (RIcalc) and ∆RI (= RI –RIcalc) for each stationary phase, respectively, and calculated values of semi-empirical topological index (IET) for ketones and aldehydes
No. Compunds RIHP-1 RIcalc ∆RIHP-1RIHP-50 RIcalc ∆RIHP-50RIDB-210 RIcalc ∆RIDB-210 RIInnow RIcalc ∆RIInnow IET
between polar molecules and more polar stationary phases must be much stronger and more complex due to the high dipole moment of the molecules and possible hydrogen-bonding interactions.
The simple linear correlation obtained between the experimental retention index and the semi-empirical topological index for each stationary phase is illustrated in Figure 1. The QSRR models (RIExp = a + bIET) of the corresponding graphs are summarized in Table 4. The “a” and “b” constants of the models obtained reflect the interactions between the molecule of the solute and the stationary liquid phase and are important in the prediction of the retention index. Since QSRR studies are generally carried out on non-polar stationary phases, it is important to observe how an increase in column polarity will affect the intermolecular interaction and alter the equation of
the QSRR model or its constants. As can be noted from Table 4, the “a” value changes according to the extent of interactions between the structure of the solute and the different molecules of stationary phase. Thus, as expected, the intercept values “a” increase with increasing the polarity of the stationary phase.
The correlation between the “a” coefficient and the McReynolds polarity (PR) indicates that HP-1, HP-50, DB-210 columns represent a different group of stationary phases from Innowax (Figure 2). The good linear correlation between coefficient “a” and PR observed for all three polysiloxane phases (r = 0.9992; SD = 7.74) revealed the similarity between the structures of these phases, whereas for the Innowax (polyethylene glycol) phase a considerable deviation from this linearity can be seen from Figure 2. This analysis suggested a different mechanism Table 3. Stationary phases and their McReynolds polarity
Number Notation Stationary phase McReynolds polarity a
0 1 HP-1 Dimethylpolysiloxane 222
0 2 HP-50 50% Phenylmethylpolysiloxane 884
0 3 J& W DB-210 50% Trifluoropropylmethylpolisiloxane 1520
0 4 HP- Innowax Polyethylene glycol 2308
a Sum of the first five McReynolds constants.29
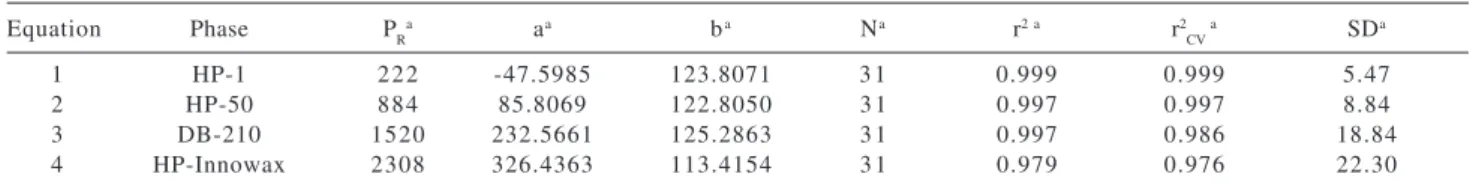
Table 4. Summary of the coefficients and statistical parameters for stationary phases of different polarity for RIExp = a + b IET
Equation Phase PRa aa ba Na r2 a r2
CV
a SDa
1 HP-1 222 -47.5985 123.8071 3 1 0.999 0.999 5.47
2 HP-50 884 85.8069 122.8050 3 1 0.997 0.997 8.84
3 DB-210 1520 232.5661 125.2863 3 1 0.997 0.986 18.84
4 HP-Innowax 2308 326.4363 113.4154 3 1 0.979 0.976 22.30
aa and b = equation coefficients; N = number of ketones and aldehydes; r2 = determination coefficient; SD = standard deviation; r2
CV =
cross-validated correlation coefficient; PR = McReynolds polarity.
Figure 1. Simple linear regression between experimental retention indices (RIExp) and semi-empirical topological indices (IET) on sta-tionary phases of different polarities (HP-1, HP-50, DB-210 and Innowax).
of absorption and elution between the molecules of the solute and the last stationary phase. As observed by Zhang and Lu,13 in stationary phases, which differ in structure,
the molecular interactions would be different and consequently so would be the orientation of molecular interactions. This behavior was also observed in another paper,14 where the authors used Principal Component
Analysis- PCA to extract this information.
As expected, the retention indices of the compounds shifted to higher values as the polarity of the phase increased. Since IET was developed in low polarity stationary phases, the standard deviation increased as the polarity increased (Table 4). This fact is in agreement with the enhanced role of specific molecular interactions on highly polar phases, as previously noticed by Héberger et al.15
In multiple linear regressions, each coefficient describes the sensitivity of a property to each of the individual indices. Therefore, the coefficient of these parameters would measure the relative importance of each index.33 In simple linear regression, this kind of
conside-ration is unnecessary. However, comparisons between coefficient “ b” of the QSRR models generated (Table 4) can describe the sensitivity of retention indices with respect to IET for each stationary phase with increasing polarity (HP-1< HP-50 < DB-210 < Innowax). The highest value of “b”, the angular coefficient, observed in the QSRR models from Table 4, is provided by the DB-210 stationary phase, i.e., DB-210 is the most sensitive one. The most polar, Innowax is the least sensitive phase. Similar results were found analyzing the selectivities of these stationary phases.14-16 According to the authors, such behavior was
not surprising, since the DB-210 column is specially designed for separation of oxygenated compounds. The trifluoropropyl group has a high dipole moment, hence strong electron-acceptor capability, which results in an unusual retention order. In this column, carbonyl and nitro groups are more strongly retained compared to alcohols or esters, i.e., DB-210 has the unique property of retaining carbonyl groups more strongly than the hydroxyl group.15
Thus, the most selective stationary phase recommended by these authors for the separation of oxo compounds is DB-210 and the least selective one is Innowax.
It is expected that factors related to polarity, such as dipole-dipole interactions or the protic nature of the compounds, have a great influence on the retention process in polar stationary phases. Therefore, IET was not able to encode the degree of interaction of the molecules of solute with the molecules of the polar stationary phase, as well as with the molecules of less polar stationary phases. From Table 2, it can be noted that, for compounds such as butanone, 3-pentanone, pentanone, hexanone,
2-heptanone, hexanal, heptanal, and octanal (all linear compounds), the experimental retention indices (RI) are higher than the calculated values (RICalc), showing a positive increase of ∆RI values as the polarity of the stationary phase increases. This fact indicates a higher interaction of the carbonyl groups with polar stationary phases. On the order hand, observing the residual values (∆RI) for most of branched molecules, which present branching near C=O moiety (2,2- dimethyl-3-butanone, 2-methyl-3-heptanone, 5-mehyl-3-hetanone, isobutanal, 2-methyl-butanal, 3,3-dimethyl butanal, 2-ethyl butanal and 2-ethyl-hexanal), a negative increase is showed as the polarity of the stationary phase increases. Obviously, branching prevents close contact with neighboring molecules in space by means of the steric effect. These results suggest that, the more polar is the stationary phase, the greater is the predominance of polar interactions with respect to the dispersion interactions on the retention of the compounds. For this reason, the steric effect on the polar moiety (C=O) of the molecule plays a more important role on polar stationary phases than on low polarity stationary phases.
The QSRR models individually generated for RI on four stationary phases of different polarities were validated by the cross validation using the leave-one method (Table 4).32 The statistical parameters (r and SD) of the models are
also shown in Table 4. In general, the quality of the quantitative structure-property relationship (QSPR) models can be conveniently measured by the correlation coeffi-cient (r) and the standard deviation (S.D). Mihalic and Trinajstic suggested that a good QSPR must have r > 0.995, and SD depends on the property studied.34 According to
this statement, the models obtained on HP-1 and HP-50 represent an excellent QSRR model.
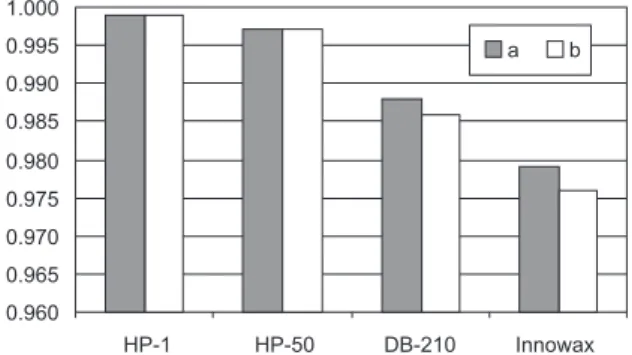
The cross-validated correlation coefficient (r2 CV)
compared to the correlation coefficient (r2) indicates the
stability of the QSRR model. From Figure 3, it can be seen that the proposed model has higher statistical stability for HP-1 and HP-50 than for the more polar phases.
Figure 3. Determination coefficient, r2 (a), and cross-validated
cor-relation coefficient, r2
CV (b), for the calculated retention indices on
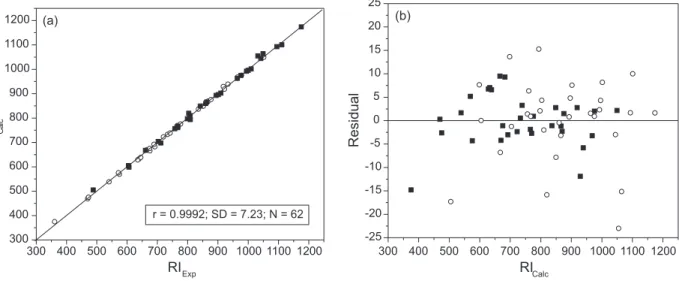
A graphical indication of the quality of QSRR models obtained on HP-1 and HP-50 columns can be seen in Figure 4. Figure 4a is a plot of calculated versus experimental retention index values for aliphatic ketones and aldehydes. The plot of the residuals versus calculated retention index values (Figure 4b) falls, as expected, within a horizontal band centered on zero.
Compared to the previously obtained structure-retention models for the same set of 31 ketones and aldehydes using quantum-chemical and physico-chemical descriptors, the QSRR models reported in this paper are significantly better on HP-1 and HP-50 stationary phases, with a standard deviation 2.0 and 1.5 times smaller, respectively (Table 5). In this analysis, it is necessary to take into account that our models were generated using a
Table 5. Comparison of statistical parameters for QSRR models obtained with physico-chemical descriptors,15 quantum-chemical descriptors16
and the semi-empirical topological index (IET)
Stationary phase Statistical characteristics Quantum-chemical descriptorsa Physico-chemical descriptorsb Topological descriptorc
HP-1 Descriptor Sw and µ TBP,MW, log P IET
r 0.99787 0.9980 0.9995
SD 10.93 10.93 5.47
N 3 1 3 5 3 1
HP-50 Descriptor Sw, µ, α TBP IET
r 0.9965 0.9970 0.9986
SD 13.84 12.72 8.84
N 3 1 3 5 3 1
DB-210 Descriptor Sw, µ, E(LUMO), α, β TBP, log P IET
r 0.9980 0.9979 0.9939
SD 10.69 11.23 18.84
N 3 1 3 5 3 1
Innowax Descriptor Sw, µ, α, β TBP, Vm IET
r 0.9953 0.9930 0.9896
SD 15.02 18.39 22.30
N 3 1 3 5 3 1
a Quantum-chemical descriptors: S
w = solvent accessible surface area, µ = dipole moment, E(LUMO) = energy of the lowest unoccupied molecular
orbitals, α = isotropic average polarizability, β = average hyperpolarizability; b Physico-chemical descriptors: T
BP =boilingpoint, MW = molecular
mass, log P = octanal-water partition coefficient, Vm = molecular volume; c Topological descriptor: I
ET = semi-empirical topological index.
single topological descriptor, IET, while the other authors employed from 2 to 5 different descriptors.
Although correlations between IET and the retention indices showed satisfactory statistical parameters, the SD values for DB-210 and Innowax stationary phases were higher than those obtained using physico-chemical and quantum-chemical descriptors, as illustrated in Table 5. It should be noted that IET was not generated to reflect some specific interactions between polar molecules and polar stationary phases, as it was observed in this study.
Finally, it is interesting to point out that the correlations obtained in this study provided insights as to the mechanism of the retention process using merely one topological descriptor.
Conclusions
The present study demonstrated the successful application of semi-empirical topological indices to predict the chromatographic retention of aliphatic ketones and aldehydes on stationary phases of low-to-medium polarity.
Statistical analyses showed that the application of the QSRR model to HP-1 and HP-50 stationary phases has high internal stability, as established by cross-validation (r2
CV), and good predictive ability.
It should be pointed out that our topological index, using a simple linear regression, was able to encode structural features of the solute, and consequently to indicate which types of interactions are responsible for the retention of these compounds with the stationary phases studied.
Finally, the semi-empirical topological method, using only one topological descriptor, yielded better results on low-to-medium polarity stationary phases than methods that use multiple descriptors.
Acknowledgements
The authors thank CNPq (Brazil) for its financial support.
References
1. Heinzen V. E. F.; Yunes, R. A.; J. Chromatogr. A1993, 654, 83.
2. Heinzen V. E. F.; Yunes, R. A.; J. Chromatogr. A1996, 719, 462.
3. Heinzen, V. E. F.; Soares, M. F.; Yunes, R.A.; J. Chromatogr. A 1999, 849, 495.
4. Amboni, R. D. M. C.; Junkes, B. S.; Yunes, R. A.; Heinzen, V. E. F.; J. Mol. Struct. (Theochem)2002, 586, 71.
5. Junkes, B. S.; Amboni, R. D. M. C.; Yunes, R. A.; Heinzen, V. E. F.; Anal. Chem. Acta2003,477, 29.
6. Mira, J. M.; Gascó Sánchez, L.; Anal. Chim. Acta1970, 50, 315.
7. Saura Calixto, F.; Garcia Raso, A.; Chromatographia 1982, 15, 771.
8. Bermejo, J.; Guillen, M. D.; J. Chromatogr. 1985, 318, 187.
9. Bermejo, J.; Guillén, M. D.; Anal. Chem.1987, 59, 94. 10. Anker, L. S.; Jurs, P. C.; Anal. Chem. 1990, 62, 2676. 11. Kollie, T.O.; Poole, C.F.; J. Chromatogr. 1991, 556, 457. 12. Woloszyn, T. F.; Jurs, P. C.; Anal. Chem.1992, 64, 3059. 13. Zhang, X.; Lu, P.; J. Chromatogr. A1996, 731, 187. 14. Héberger, K.; Görgényi, M.; J. Chromatogr. A1999, 845,
21.
15. Héberger, K.; Görgényi, M.; Sjörström, M.; Chromatographia 2000, 51, 595.
16. Körtvélyesi, T.; Görgényi, M.; Héberger, K.; Anal. Chim. Acta 2001, 428, 73.
17. Guo, W.; Lu, Y.; Zheng, X. M.; Talanta2000, 51, 479. 18. Wang, Y.; Yao, X.; Zhang, X.; Zhang, R.; Liu, M.; Hu, Z.; Fan,
B.; Talanta 2002, 57, 641.
19. Peng, C. T.; J. Chromatogr. A2000, 903, 117. 20. Fatemi, M. H.; J. Chromatogr. A2002, 955, 273.
21. Kaliszan, R.; Quantitative Structure-Chromatographic Reten-tion RelaReten-tionships, Wiley-Interscience: New York, 1987. 22. Yao, X.; Zhang, X.; Zhang, R.; Liu, M.; Hu, Z.; Fan, B; Talanta
2002, 57, 297.
23. Fritz, D. F.; Kováts, E.; J. Chromatogr. 1979, 186, 63. 24. Peng, C. T.; Ding, S. F.; Hua, R. L.; Yang, Z. C.; J. Chromatogr.
1988, 436, 137.
25. Morales, R.; Blanco, C.; Furton, K. G.; Talanta1993, 40, 1541.
26. Junkes, B. S.; Amboni, R. D. M. C.; Heinzen, V. E. F.; Yunes, R. A.; Chromatographia2002, 55, 75.
27. Junkes, B. S.; Amboni, R. D. M. C.; Yunes, R. A.; Heinzen, V. E. F.; Chromatographia 2002, 55, 707.
28. Hansen, P. J.; Jurs P.C.; J. Chem. Educ. 1988, 65, 574. 29. McReynolds, W.O.; J. Chromatogr. Sci. 1970, 8, 685. 30.MicroCal Origin®, version 5.0, serial number
G43S5-9478-7055154, 1997.
31. Kubinyi, H. In QSAR: Hansch Analisis and Related Approaches, Mannhold, R.; Krogsgaard-Larsen, P.; Timmerman, H., Eds., VCH: Weinheim, 1993.
32. Waterbeemd, H.V; Chemometric Methods in Molecular Design, VCH: Weinheim, 1995.
33. Ren, B.; J. Mol. Struct. (Theochem.)2002, 586, 137. 34. Mihalic, Z.; Trinajstic, N.; J. Chem. Educ. 1992, 69, 701.
Received: March 6, 2003