Article
Printed in Brazil - ©2016 Sociedade Brasileira de Química0103 - 5053 $6.00+0.00
*e-mail: [email protected]
A Systematic Procedure to Develop a Capillary Electrophoresis Method Using a
Minimal Experimental Data
Daniel A. Spudeit,a Samantha Gonçalves,a Lizandra C. Bretanha,a Carlos A. Claumann,b
Ricardo A. F. Machadob and Gustavo A. Micke*,a
aDepartamento de Química and bDepartamento de Engenharia Química, Universidade Federal de
Santa Catarina, 88040-900 Florianópolis-SC, Brazil
The choice of an appropriate background electrolyte (BGE) and its components for capillary electrophoresis analysis is the main step in capillary electrophoresis method development. The use of an inadequate co-ion component could lead to asymmetrical peaks and selecting an inappropriate counter-ion could affect the buffer capacity and the pH of the BGE, leading to unreliable analysis. In this paper, we describe a systematic procedure for the development of a capillary electrophoresis method, based on the effect of varying pH on the ion effective mobility, to optimize the BGE composition. The method was applied to the separation of L-ascorbic acid in different samples. The optimized background electrolyte composition was 40 mmol L−1 tris(hydroxymethyl) aminomethane and 20 mmol L−1 2-morpholinoethanesulfonic acid, at pH 8.1. Sorbic acid was used as the internal standard and separation was carried out in a fused-silica capillary (32 cm total length and 8.5 cm effective length, 50 µm inner diameter), with a short-end-injection configuration and direct ultraviolet (UV) detection at 266 nm. The separation was performed in 26 s. The method shows good linearity (R2 > 0.999), excellent values for inter-day and intra-day precision and good recovery (in the range of 94-107%). The values obtained for limit of detection (LOD) and limit of quantification (LOQ) were 0.14 and 41 mg L−1, respectively. The systematic procedure applied shows to be a very useful tool for the first step method development for capillary electrophoresis.
Keywords: capillary electrophoresis, effective mobility curves, optimization, L-ascorbic acid
Introduction
Capillary zone electrophoresis (CZE) is the simplest and most widely used form of capillary electrophoresis (CE).1 In this mode, a capillary is filled with an electrolyte
(run buffer), the sample is introduced in the inlet and an electrical field is applied. Separations are accomplished through the movement of ions in the electric field. This movement is governed by the electrophoretic mobility of the ion (µe), this mobility being defined as the average
velocity in which an ion moves under the influence of an applied potential field (normalized to the electric field strength).2 The difficulty, however, lies with determining the
optimal conditions of the background electrolyte (BGE), which the charge-to-size ratio of the analytes is appreciably different from one another.3
The choice of buffer is critical to obtaining the successful separation of analytes by CZE. Once the optimal wavelength for detection has been established, a buffer that
does not interfere with the ability to detect the analytes of interest must be selected, maintaining the solubility of the analytes, the buffering capacity through the analysis, and producing the desired separation. Since a variation in the pH of the BGE could affect either the electroosmotic flow (EOF) or effective mobility (meff) of the solute, successful
separations are usually obtained when the conditions optimize both the EOF and the solute mobility properties.2
A good approach is to start with the use of a simple and effective tool: the effective mobility vs. pH curve, that can be constructed knowing µ0and the Ka values for each
compound, and can provide some important information, such as the pH range in which separation can occur, that is, where the effective mobility of each analyte is different. By considering that good peak, symmetry is usually obtained when the analyte mobility matches the co-ion mobility, an appropriate co-ion can also be selected from the inspection of the mobility vs. pH curves. The applicability of these curves has been already demonstrated for different kind of matrix as soft drinks and sweeteners,4 biodiesel,5 biological
L-Ascorbic acid (L-AA, vitamin C) is a natural antioxidant present in food and biological systems with important nutritional benefits for human health.7
Fruit juices, pharmaceutical formulations and vitamin supplements (e.g., tablets and powdered juices containing L-AA) are sources of vitamin C. The determination of L-AA in these samples is very important with regard to the standardization of nutrient composition and to monitoring the L-AA stability during processing and storage.
Several different analytical methods have been employed to study L-AA including cyclic voltammetric,8
c h e m i l u m i n e s c e n c e ,9 h i g h - p e r f o r m a n c e l i q u i d
chromatography (HPLC),10 fluorimetry,11 microchip
electrophoresis12,13 and capillary electrophoresis.14-16 The
CE technique offers attractive advantages including simple sample preparation, low consumption of chemical reagents, good resolution, reduced residue generation and reduced analysis time. Several previous publications report methods using capillary zone electrophoresis and a basic borate buffer (pH 8.0-9.2) as the BGE for the determination of L-AA in pharmaceutical formulations,16 beverages,17,18
vegetables,19,20 fruits21 and biological fluids.22
In this work, a simple systematic procedure based on effective mobility vs. pH curves is shown aiming a method development with minimal experimental data. The procedure was applied in the development of a fast method for the determination of L-AA vitamin supplements (liquid and effervescent tablet preparations) and in orange juice.
Experimental
All experiments were performed on an Agilent Technologies HP3DCE instrument (Palo Alto, CA, USA),
equipped with a diode array detector set at 266 nm. The measurements were performed at 25 °C in an uncoated fused-silica capillary 32 cm × 50 µm i.d. × 375 µm o.d. (effective length 8.5 cm) obtained from Polymicro Technologies (Phoenix, AZ, USA). Between runs, the capillary was rinsed for 1 min with running buffer. Standard solutions and samples were introduced from the outlet capillary extremity and injected hydrodynamically at 50 mbar for 4 s (50 mbar = 4996.2 Pa) with negative pressure. The applied separation voltage was 30 kV, with positive polarity (anode) on the injection side. Data acquisition and treatment were performed with HP ChemStation software (Palo Alto, CA, USA).
Reagents and solutions
All chemicals used in the buffer preparation were of analytical reagent grade. Chromatographic grade
acetonitrile (ACN), methanol (MeOH) and sodium hydroxide were obtained from Merck (Darmstadt, Germany), tris(hydroxymethyl)aminomethane (Tris), 2-morpholinoethanesulfonic acid (MES), L-ascorbic acid and sorbic acid (SA) were purchased from Sigma-Aldrich (St. Louis, MO, USA). Deionized water (Milli-Q deionizer, Millipore, Bedford, MA, USA) was used to prepare the solutions. L-ascorbic acid standard stock solution (1000 mg L−1) was prepared in deionized water daily. Sorbic
acid (internal standard, IS) solution (200 mg L−1) was used.
Stock solutions of Tris and MES, both of 100 mmol L−1,
were used to prepare the background electrolyte. The optimized electrolyte composition was 40 mmol L−1 Tris
and 20 mmol L−1 MES, at pH 8.1.
Samples
The samples were purchased from local supermarkets and subjected to sample pretreatment before injection: (i) for effervescent tablets vitamin C, the tablets were macerated to homogenize the sample and 3.551 g was dissolved in 100 mL of deionized water; (ii) for liquid vitamin C, 100 µL of the liquid sample was dissolved in 100 mL of deionized water; and (iii) for orange juice, the juice was extracted from the fruit by pressure and diluted 1:1 (v/v) with deionized water.
A 100 µL aliquot of each sample solution was transferred to a 1.5 mL microtube and 200 µL of deionized water, 100 µL of internal standard (sorbic acid 200 mg L–1)
and 600 µL of ACN were added. The tube was centrifuged at 2,000 rpm for 5 min. After centrifugation, 500 µL of the upper phase was transferred to a vial. Each sample was injected into the CE equipment.
Results and Discussion
Method development
The steps of the method development are shown in Figure 1 and can be described as follows.23,24 The first step
is to construct the effective mobility (µeff) vs. pH. In the
µeff = µ0α (1)
where α is the molar fraction or distribution function and µ0 is the ionic mobility of each individual species. The
values for the absolute mobility and pKa used to construct
the curves were obtained from a database compiled by Hirokawa et al.25
Since the SA is a monoprotic acid and L-AA is monoprotic till pH 9, the distribution function can be expressed in terms of the dissociation constant and the medium acidity (equation 2):
(2)
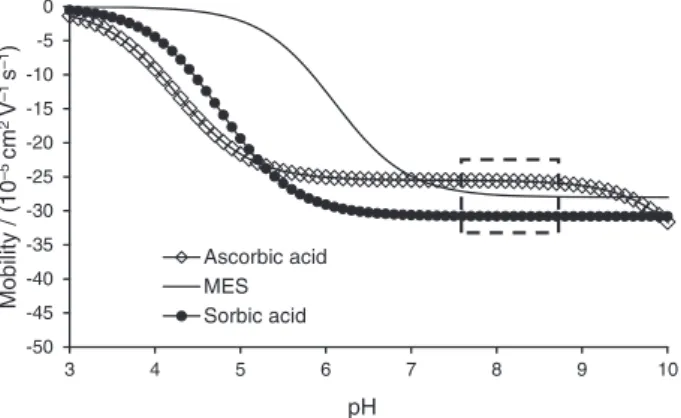
From these equations and the data compiled by Hirokawa et al.,25 effective mobility vs. pH curves could
be constructed (Figure 2).
Determination of pH and operation mode BGE composition
The inspection of such curves gives a preliminary assessment of an appropriate pH range where the separation
is likely to occur, i.e., where relative differences of mobility are maximized. As it can be inferred from inspection of the Figure 2, above pH 3 the separation of the analytes can be approached experimentally. However, the optimal pH value for the method was determined in the range of 7-9 (enclosed area Figure 2) once; at this pH range, both L-AA and SA will be fully ionized, which means that µeff is higher
and differences of mobility, in this case, are maximized. At this pH, the mode of operation could be co-electroosmotic, which means that analytes and EOF are migrating toward the anode, condition that could be achieved by adding a cationic EOF modifier on the BGE. Another option is to perform the analysis on counter-electroosmotic mode. In this mode, two situations are possible: (i) µeff of the analytes are higher than the EOF
mobility, ensuring the anion migration past the detector (i.e., inorganic anions); or (ii) the EOF mobility is higher than the µeff, ensuring that the analytes will be carried
toward the detector. Since at the pH range selected the EOF mobility has a high magnitude (40-60 × 10−5 cm2 V−1 S−1),26
the counter-electroosmotic mode was selected.
Determination of BGE composition
In the selection of an appropriate background electrolyte, several characteristics should be considered, including good buffering capacity and adequate co- and counter-ions, to minimize peak asymmetry and anomalous dispersion effects.24 Several important parameters are
readily obtained from PeakMaster,27 which allows
determination of the electromigration dispersion (EMD), system zone phenomena, effective mobility, transference ratio and analyte parameters.
The first BGE parameter to be selected in this proposed procedure is the co-ion type. As is well established for analysis performed with CZE system using a absorbance detector, good peak symmetry is usually obtained when the analyte mobility matches the co-ion mobility. Due to the similarity of the effective mobility between MES and L-AA and SA, MES was chosen as BGE co-ion. Since MES has no buffering capacity in the pH range selected, Tris (with a pKa of 8.15) was selected as the BGE counter-ion. Once the
co- and counter-ion had been selected, other BGE parameters were calculated using the PeakMaster software.27 The
optimized running electrolyte was composed of 40 mmol L−1
Tris and 20 mmol L−1 MES, at pH 8.1.
Choice of internal standard
The selection of the internal standard was based on the following criteria: the compound is fully dissociated at the
Figure 1. Flowchart showing the generic steps for method development.
-50 -45 -40 -35 -30 -25 -20 -15 -10 -5 0
3 4 5 6 7 8 9 10
Mobility
/
(1
0
–
5cm 2V
–
1s
–1
)
pH
Ascorbic acid MES Sorbic acid
Figure 2. Effective mobility vs. pH curve for ascorbic acid, sorbic acid
chosen pH, which leads to a more robust and reproducible method since its µeff will not vary with any pH change; and
the effective mobility is close to the mobility of the co-ion but different to the effective mobility of L-AA. Sorbic acid was the compound selected because it satisfies the established criteria (Figure 2), and has a high value for the absorptivity coefficient at 266 nm (λmax of L-AA). Figure 2
shows the effective mobility vs. pH curve for SA. For this selection, a PeakMaster database was used and it was possible to sort the database components according to their ionic mobility and choose analyte with suitable properties.
Solvent addition effect
In order to remove macromolecules, such as proteins and polysaccharides, which may be present in the samples, MeOH or ACN was added on the sample to promote the precipitation of these compounds, since they can interact with the capillary walls and alter the EOF.28
The addition of solvent increases the plate number due to a decrease in the conductivity of the sample plug, favoring the occurrence of normal stacking.29 Figure 3
shows the plate number per meter (N m−1) for the L-AA
when 0-80% of MeOH or ACN was added on the sample. The effect of ACN (dielectric constant 37.5 at 20 °C and viscosity 0.38 cP at 20 °C) was greater than that of MeOH (dielectric constant 32.7 at 20 ºC, viscosity 0.59 cP at 20 °C). The higher efficiency achieved with the addition of ACN does not appear to be related only to the dielectric constant value, but also to a change in the electrophoretic velocity caused by a change in viscosity, since the sample ions move from the low viscosity zone (ACN) to the BGE zone, which has no organic solvent.29
The best efficiency was obtained using 80% of ACN, however, with this amount of solvent current breakdown occurred in several runs, probably due to the generation of bubbles from solvent evaporation in the plug sample caused by the high electric field in the plug. An amount of 60%
(v/v), which provided high efficiency and macromolecule precipitation without current breakdown, was therefore used in the sample preparation.
Electrophoretic separation
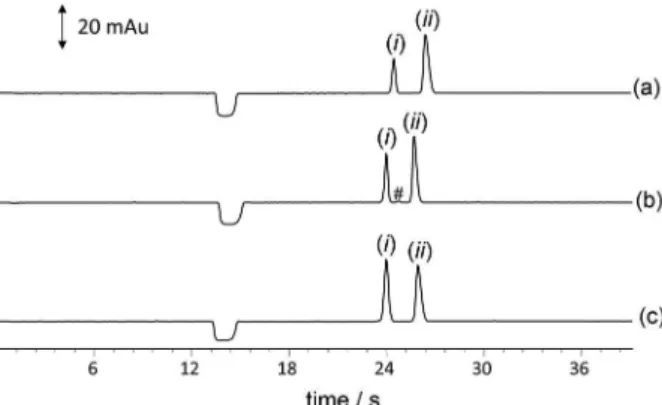
To perform the electrophoretic separations, all samples were submitted to the procedure described above (Samples sub-section). The results for the separation of working standards and samples, under optimized conditions, are shown below (Figures 4a-c), where the fast separation of L-AA and SA (< 30 s) can be noted. This was possible due to the difference in the effective mobility values and performing the injection at short-end (Ldet 8.5 cm), the polarity was
reversed that means positive polarity at the injection side, with a high electrical field (937.5 V cm−1). Since high
resolutions (Rs) could be applied between multiple injections
of L-AA and SA (Rs 2.05), the total analysis time was further
reduced, leading to an increase in the analytical frequency.
Method validation
The evaluation of the proposed method optimized for the determination of L-AA was performed in accordance with the US Food and Drug Administration (FDA),30,31
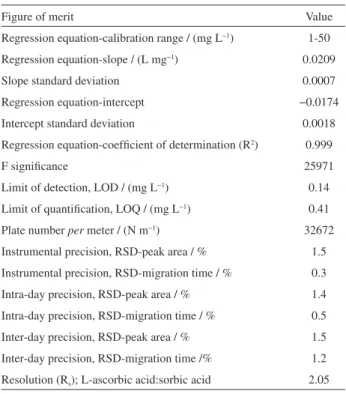
using the validation parameters: linearity, recovery, repeatability, precision, LOD, LOQ and selectivity. The results are shown in Table 1. In all cases, 20 mg L−1 of
internal standard was added.
In order to obtain quantification models through the use of ordinary least squares regression, external calibration curves with internal standard addition employing six levels of L-ascorbic acid (1-50 mg L−1) were constructed with
14000 19000 24000 29000 34000 39000 44000
0 20 40 60 80 100
Plate
number
per
m /
(N
m
–1)
Solvent / % Methanol
Acetonitrila
Figure 3. Effect of addition of the organic modifiers on the sample on
the plate number per meter.
Figure 4. Electropherogram of L-ascorbic acid (AA) and sorbic acid
(SA) in food samples. Orange juice (a); vitamin C (b); and working standard solution of 50 mg L−1 L-AA, 20 mg L−1 sorbic acid (c).
Electrolyte system composed of 40 mmol L−1 Tris and 20 mmol L−1
authentic replicates (n = 3). The linear mode showed a significance of F > 25000 and a good correlation coefficient (R2 > 0.999) were also achieved.
The precision was determined in order to evaluate the relative standard deviation (RSD) for the corrected peak area (ratio, analyte area / IS area) and the migration time of L-AA using a standard solution of 20 mg L−1 sorbic
acid. Instrumental precision was established through seven consecutive injections of a standard solution. Repeatability values for the migration time and peak area ratio were better than 0.3 and 1.5%. Intra-day precision was established through three independent preparations of samples and injection in triplicate. The RSD values for the migration time and peak area were better than 0.5 and 1.4%, respectively. Inter-day precision was established through three injections of a standard solution, on three different days. The values obtained for peak area and migration time were better than 1.2 and 1.5%, respectively. The values obtained for the precision were appropriate, considering the complexity of the sample matrix. The limits of detection and quantification obtained are considered to be suitable for the concentrations of L-AA in all samples.
The matrix effect of the proposed method was evaluated using the method of standard addition, due to difficulties associated with obtaining a matrix free of the active ingredient. The slopes of the standard addition curves (0.0218 ± 0.0009) and external standard calibration curves (0.0209 ± 0.0007) were compared.
The similarity of these slopes (the ratio between the slopes of the calibration curves was around unity) indicates that matrix did not influence the method.26 Moreover,
the recovery results showed good agreement (92-107% recovery) with the reference values. Thus, the method described herein showed appropriate selectivity for L-AA in natural and synthetic samples.
Application to real samples
To demonstrate the applicability of the electrophoretic procedure developed, some samples were analyzed, including a sample of orange juice. The electropherograms for the real samples and standards are shown in Figure 4. Each sample was prepared in duplicate and injected in triplicate. A notable observation from this figure is that even though this is a real sample, the electropherogram is clear, which demonstrates that the clean-up step with the addition of ACN was efficient. The results for the quantification of L-AA in the samples and the value informed on the label are shown in Table 3.
The values informed and determined are matching for orange juice and effervescent tablets, which indicates the applicability of the method for analysis of L-AA. The difference between values found for vitamin C liquid and the declared value can be related to a several possibilities as bad packaging, exposure to sun light and so on, that could affect the stability of the L-AA.
Table 3. Results for the determination of L-ascorbic acid in
commercial samples using the optimized capillary zone electrophoresis (CZE)-ultraviolet (UV) method
Sample Concentration / (mg L
−1)
Declared Determined
Orange juice 1.66 1.64 ± 0.03
Vitamin C (effervescent tablet) 290 306.3 ± 13.8
Vitamin C (liquid) 200 168.8 ± 8.6
Table 2. Verification on the selectivity of the method for the determination
of L-ascorbic acid in commercial products using the standard addition method
Added / (mg L−1)
Vitamin C sample recovery / %
Effervescent
tablet Liquid Juice
5 107 103 106
15 97 98 107
20 102 101 98
Table 1. Figures of merit for the proposed method
Figure of merit Value
Regression equation-calibration range / (mg L−1) 1-50
Regression equation-slope / (L mg−1) 0.0209
Slope standard deviation 0.0007
Regression equation-intercept −0.0174
Intercept standard deviation 0.0018
Regression equation-coefficient of determination (R2) 0.999
F significance 25971
Limit of detection, LOD / (mg L−1) 0.14
Limit of quantification, LOQ / (mg L−1) 0.41
Plate number per meter / (N m−1) 32672
Instrumental precision, RSD-peak area / % 1.5
Instrumental precision, RSD-migration time / % 0.3
Intra-day precision, RSD-peak area / % 1.4
Intra-day precision, RSD-migration time / % 0.5
Inter-day precision, RSD-peak area / % 1.5
Inter-day precision, RSD-migration time /% 1.2
Conclusions
In this study, an electrolyte composition for the determination of L-AA was optimized using a systematic procedure. Satisfactory precision data were obtained using sorbate as the internal standard. The proposed method was found to be simple, fast and reliable, and baseline resolution was achieved within 26 s. The optimized procedure allows the determination of L-AA in different types of samples. The proposed steps for the systematic development of a CE method represent a convenient approach to the selection of the co-ion, operation mode and internal standard and may be considered for application in routine optimization procedures.
Acknowledgments
The authors wish to thank the Conselho Nacional de Pesquisa e Desenvolvimento (CNPq, Brazil), Instituto Nacional de Ciência e Tecnologia de Catálise (INCT-catálise) and Farma Service Bioextract for financial support.
References
1. Terabe, S.; Otsuka, K.; Nishi, H.; J. Chromatogr. A 1994, 666, 295.
2. Landers, J. P.; Handbook of Capillary and Microchip
Electrophoresis and Associated Microtechniques, 3rd ed.; CRC
Press: Boca Raton, 2008.
3. Johns, K. F.; Breadmore, M. C.; Brudo, R.; Haddad, P. R.;
Electrophoresis 2009, 30, 839.
4. Vistuba, J. P.; Dolzan, M. D.; Vitali, L.; de Oliveira, M. A. L.; Micke, G. A.; J. Chromatogr. A 2015, 1396, 148.
5. Piovezan, M.; Costa, A. C. O.; Jager, A. V.; de Oliveira, M. A. L.; Micke, G. A.; Anal. Chim. Acta 2010, 673, 200.
6. Vitali, L.; Favere, V. T.; Micke, G. A.; J. Chromatogr. A 2011, 1218, 2327.
7. Meister, A.; Biochem. Pharmacol. (Amsterdam, Neth.) 1992, 44, 1905.
8. Nasirizadeh, N.; Shekari, Z.; Tabatabaee, M.; Ghaani, M.;
J. Braz. Chem. Soc. 2015, 26, 713.
9. Alwarthan, A. A.; Analyst (Cambridge, U. K.) 1993, 118, 639. 10. Bottegal, M.; Lang, L.; Miller, M.; McCord, B.; Rapid Commun.
Mass Spectrom. 2010, 24, 1377.
11. Park, H. W.; Alam, S. M.; Lee, S. H.; Karim, M. M.; Wabaidur, S. M.; Kang, M.; Choi, J. H.; Luminescence 2009, 24, 367. 12. Fischer, D. J.; Hulvey, M. K.; Regel, A. R.; Lunte, S. M.;
Electrophoresis 2009, 30, 3324.
13. Zhao, S. L.; Huang, Y.; Liu, Y. M.; J. Chromatogr. A 2009, 1216, 6746.
14. Dong, S. Q.; Zhang, S.; Cheng, X.; He, P. G.; Wang, Q. J.; Fang, Y. Z.; J. Chromatogr. A 2007, 1161, 327.
15. Wang, X. L.; Li, L. J.; Li, Z. Y.; Wang, J.; Fu, H. Y.; Chen, Z. Z.;
J. Electroanal. Chem. 2014, 712, 139.
16. Marra, M. C.; Silva, P. L.; Munoz, R. A. A.; Ritcher, E. M.;
J. Braz. Chem. Soc. 2014, 25, 913.
17. Tang, Y. J.; Wu, M. J.; Talanta 2005, 65, 794.
18. Choi, O. K.; Jo, J. S.; J. Chromatogr. A 1997, 781, 435. 19. Fukushi, K.; Takeda, S.; Wakida, S.; Yamane, M.; Higashi, K.;
Hiiro, K.; J. Chromatogr. A 1997, 772, 313.
20. Davey, M. W.; Bauw, G.; VanMontagu, M.; Anal. Biochem. 1996, 239, 8.
21. Galiana-Balaguer, L.; Rosello, S.; Herrero-Martinez, J. M.; Maquieira, A.; Nuez, F.; Anal. Biochem. 2001, 296, 218 22. Zinellu, A.; Carru, C.; Sotgia, S.; Deiana, L.; Anal. Biochem.
2004, 330, 298.
23. Goncalves, L. C.; Micke, G. A.; J. Chromatogr. A 2007, 1154, 477.
24. Costa, A. C. O.; da Costa, J. L.; Tonin, F. G.; Tavares, M. F. M.; Micke, G. A.; J. Chromatogr. A 2007, 1171, 140.
25. Hirokawa, T.; Nishino, M.; Aoki, N.; Kiso, Y.; Sawamoto, Y.; Yagi, T.; Akiyama, J.; J. Chromatogr. A 1983, 271, D1. 26. Vitali, L.; Della Betta, F.; Costa, A. C. O.; Vaz, F. A. S.; Oliveira,
M. A. L.; Vistuba, J. P.; Favere, V. T.; Micke, G. A.; Talanta 2014, 123, 45.
27. Gas, B.; Jaros, M.; Hruska, V.; Zuskova, I.; Stedry, M.; Lc GC
Eur. 2005, 18, 282.
28. Ragozina, N. Y.; Putz, M.; Heissler, S.; Faubel, W.; Pyell, U.;
Anal. Chem. (Washington, DC, U. S.) 2004, 76, 3804.
29. Quirino, J. P. ; Terabe, S.; J. Chromatogr. A 2000, 902, 119. 30. Vitali, L.; Valese, A. C.; Azevedo, M. S.; Gonzaga, L. V.; Costa,
A. C. O.; Piovezan, M.; Vistuba, J. P.; Micke, G. A.; Talanta 2013, 106, 181.
31. Zimmer, D.; Bioanalysis 2014, 6, 13.
Submitted: November 12, 2015