Article
0103 - 5053 $6.00+0.00*e-mail: [email protected]
Validation of a Capillary Zone Electrophoresis Method for the Determination of Ciprofloxacin,
Gatifloxacin, Moxifloxacin and Ofloxacin in Pharmaceutical Formulations
Adriana F. Faria,a Marcus V. N. de Souzab and Marcone A. L. de Oliveira*,a
aDepartamento de Química, Instituto de Ciências Exatas, Universidade Federal de Juiz de Fora,
Cidade Universitária, 36036-330 Juiz de Fora-MG, Brazil
bInstituto de Tecnologia em Fármacos-Far Manguinhos, Fundação Oswaldo Cruz, 21041-250 Rio de Janeiro-RJ, Brazil
Um método alternativo por eletroforese capilar de zona (CZE) para determinação de ciprofloxacina (CPFLX), gatifloxacina (GTFLX), moxifloxacina (MFLX) e ofloxacina (OFLX)
foi validado. O sistema de eletrólito utilizado consistiu da mistura de 25 mmol L-1 de TRIS/ HCl
e 15 mmol L-1 de tetraborato de sódio em meio aquoso resultando em pH 8,87. A análise foi
realizada sob detecção direta por UV em 282 nm com tempo de análise de 3 min. Os parâmetros analíticos de validação avaliados foram: linearidade (r > 0,998), seletividade (comparação entre a inclinação da curva de calibração de padronização externa e curva de calibração de adição de padrão), repetitividade em área para amostras (RSD %: < 3,94% para CPFLX, < 3,87% para GTFLX, 1,30% para MFLX e < 1,88% para OFLX), precisão intermediária em área para amostras (RSD%: < 3,59% para CPFLX, < 3,09% para GTFLX, 2,67% para MFLX e < 2,25% para OFLX), exatidão (média da faixa de recuperação: 101,2% para CPFLX, 101,0% para GTFLX, 101,3% para
MFLX e 99,9% para OFLX), limite de detecção (mg L-1: 2,72 para CPFLX, 1,92 para GTFLX,
0,795 para MFLX e 1,05 para OFLX), limite de quantificação (mg L-1: 9,06 para CPFLX, 6,40
para GTFLX, 2,65 para MFLX e 3,50 para OFLX) e robustez. Devido à simplicidade, seletividade, precisão, exatidão e rapidez, o método pode ser uma alternativa interessante para auxiliar o controle da qualidade dessas drogas na indústria farmacêutica.
An alternative capillary zone electrophoresis (CZE) method for the determination of ciprofloxacin (CPFLX), gatifloxacin (GTFLX), moxifloxacin (MFLX) and ofloxacin (OFLX)
through a simple aqueous electrolyte system consisting of 25 mmol L-1 of TRIS/ hydrochloride and
15 mmol L-1 of sodium tetraborate buffer mixture (pH 8.87) using direct UV detection at 282 nm
within 3 min was validated. The analytical parameters of validation evaluated were: linearity (r > 0.998), selectivity (comparison between slope of the calibration curve of external standard and calibration curve of standard addition), repeatability in area for sample (RSD%: < 3.94% for CPFLX, < 3.87% for GTFLX, 1.30% for MFLX and < 1.88% for OFLX), intermediate precision in area for sample (RSD%: < 3.59% for CPFLX, < 3.09% for GTFLX, 2.67% for MFLX and < 2.25% for OFLX), accuracy (mean of recovery range: 101.2% for CPFLX, 101.0% for
GTFLX, 101.3% for MFLX and 99.9% for OFLX), limit of detection (mg L-1: 2.72 for CPFLX,
1.92 for GTFLX, 0.795 for MFLX and 1.05 for OFLX), limit of quantification (mg L-1: 9.06 for
CPFLX, 6.40 for GTFLX, 2.65 for MFLX and 3.50 for OFLX) and robustness. Due to its simplicity, selectivity, precision, accuracy and rapidity, the methodology can be an interesting alternative for quality assurance in the pharmaceutical industry of these drugs.
Introduction
Fluoroquinolones (FQs) comprise a group of antibiotics with a broad spectrum of activity and good tolerance, being used in the treatment of a variety of bacterial infections in human and veterinary medicine. They are effective against Gram-positive, Gram-negative and micobacterial organisms as well as anaerobes. The bactericidal activity generated by FQs is caused by their inhibition of two bacterial enzymes: DNA gyrase and topoisomerase IV enzymes. In accordance with World Health Organization (WHO), this class of antibiotics is considered the first-line therapy for complicated urinary tract and bacterial diarrhea and second-line for the treatment of tuberculosis in patients with resistance or intolerance to first line anti-tuberculosis therapy. They are also alternative agents for the treatment of many sexually transmitted diseases, as well as osteomyelitis, some cases of wound infection and selected respiratory infections.1
Quality control analyses in the pharmaceutical industry involve the determination of multiple parameters for both raw materials and end products. The analytical techniques that have been used in quality control analyses of FQs in pharmaceutical products are high performance liquid chromatography (HPLC),2-5 UV spectrophotometry 6 and
titrimetry.7
Within the context of capillary electrophoresis (CE), some methodologies have been described for FQs analysis in pharmaceutical formulations. Sun and Chen8 carried out
methodological optimization for the determination of 14 quinolones and FQs in pharmaceuticals at about 8.0 min by using a complex electrolyte system consisting of sodium borate/ sodium dihydrogenphosphate/ sodium cholate/ sodium heptanesulfonate/ acetonitrile. The separation was established using the overlapping resolution mapping scheme. After that, Sun and Wu,9 achieved the
separa-tion of 7 FQs using sodium borate/ sodium dihydrogen phosphate/ sodium cholate/ acetonitrile within 8.5 min of electrolyte running. Finally, Fierens et al.10 performed
partial separation of 10 quinolones and FQs at about 14 min
using sodium phosphate buffer (pH ≈ 7). Additionally, the reviews published by Flurer describing recent advances in the analysis of antibiotics by CE, among which the FQs, presented an overview about the determination of this kind of pharmaceutical in different matrixes.11-13
Due to the use of FQs for human infections and pro-phylactic treatment of some animal species used in food industry, the development and validation of methodology capable of improving the quality control of pharmaceutical formulations used for this purpose is very important.
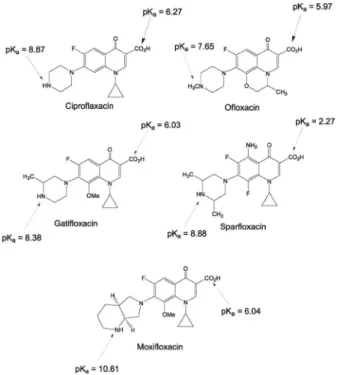
Within this context, this work describes a thorough validation of the CZE method for the determination of ciprofloxacin, (CPFLX), gatifloxacin (GTLFX), moxi-floxacin (MFLX) and omoxi-floxacin (OFLX) in pharmaceutical formulations by using sparfloxacin (SPFLX) as internal standard - IS (Figure 1). This methodology, in comparison with others previously described in the literature for the analysis of FQs pharmaceutical formulations, presents the
Figure 1. Chemical structure of the fluoroquinolones studied.
Table 1. Excipients present in the FQs tablets
Pharmaceutical Formulation Excipients
CPFLX starch, microcrystalline cellulose, crospovidone, silicion dioxide, titanium dioxide, magnesium stearate, HPM cel-lulose and macrogol
GTFLX sorbic acid, microcrystalline cellulose, titanium dioxide, magnesium stearate, sodium starch glycolate, hydroxypropyl methylcellulose, methylcellulose, poliethylenoglycol, polysorbate 80 and simethicone
MFLX microcrystalline cellulose, titanium dioxide, magnesium stearate, hypromellose, lactose, macrogol and ferric oxide
analysis of more recent FQs such as GTLFX and MFLX, shorter analysis time and simpler reagents in the back-ground electrolyte.8-10 Table 1 shows the excipients present
in each tablet analyzed. The presence of these makes the use of a selective method necessary.
Experimental
Reagents and solutions
All reagents were of analytical grade and solvents were of chromatography purity. TRIS (2-amino-2- (hydroxymethyl)-1,3-propanodiol) was obtained from Pharmacia Biotech (Uppsala, Sweden) and sodium tetra-borate was obtained from Vetec (Rio de Janeiro, Brazil). Electrolyte solutions consisted of buffer mixture containing 25 mmol L-1 TRIS/ hydrochloride and 15 mmol L-1 sodium
tetraborate and were prepared fresh daily. The FQs standard CPFLX, GTFLX, MFLX, SPFLX and OFLX were obtained from Xiamen Mchem Pharma group (Xiamen, China).
Standard solution
Stock solutions containing 20.0 mg of each FQs (CP-FLX, GT(CP-FLX, MFLX and OFLX) and SPFLX (IS) were separately dissolved in 25.0 mL methanol and stored in a freezer. These solutions, after adequate dilution, were used for the validation study.
Sample solutions
For each FQ formulation, seven tablets were individually weighed and ground to homogeneously fine powders. The powder corresponding to 10.0 mg active ingredient of CPFLX, GTFLX MFLX and OFLX and 5.0 mg of IS was weighed and dissolved in 25.0 mL of methanol in a volumetric flask. After sonication for 10 min, the suspensions were filtered through a 0.45 µm Millipore filter (São Paulo, Brazil) to obtain clear solutions that were adequately diluted before injection.
Instrumentation
All experiments were performed in a capillary electrophoresis system (model HP3d CE, Agilent Technologies, Palo Alto, USA) equipped with a diode array detector set at 282 nm, a temperature control device maintained at 25 ºC and an acquisition and treatment data software (HP ChemStation, rev A.06.01). Samples were hydrodynamically injected (30 mbar for 5s and 50 mbar for 10s) and the electrophoretic system was operated under
normal polarity and constant voltage conditions of +25 kV. Fused-silica capillaries (Polymicro Technologies, Phoenix, AZ, USA) 48.5 cm (40 cm effective length) x 50 µm I.D. and 75 µm x 375 µm O.D. were used.
Analytical procedures
When a new capillary was used, it was conditioned by a pressure flush of 1.0 mol L-1 NaOH solutions (30 min),
de-ionized water (5 min) and electrolyte solution (10 min). In between runs, the capillary was replenished with 0.2 mol L-1
NaOH solutions (2 min), deionized water (2 min) and fresh electrolyte solution (3 min, pressure flush).
Results and Discussion
Applied separation method
The methodology applied to the present work was developed by Faria et al.14 using 25 mmol L-1 of TRIS/
hydrochloride and 15 mmol L-1 of sodium tetraborate
buffer mixture (pH 8.87) as electrolyte system. In this previous paper the study of a set of experiments was carried out considering FQs effective mobility curve versus pH to optimize the electrolyte system composition. The quantitative measurement for the separation performance equation (QMSP) was used to select the optimum separation, taking into account the total sum of the resolution of the adjacent pair peaks, migration time of the last peak, resulting pH and resulting ionic strength simultaneously. Figure 2 shows the characteristic profile of separation under optimum conditions.
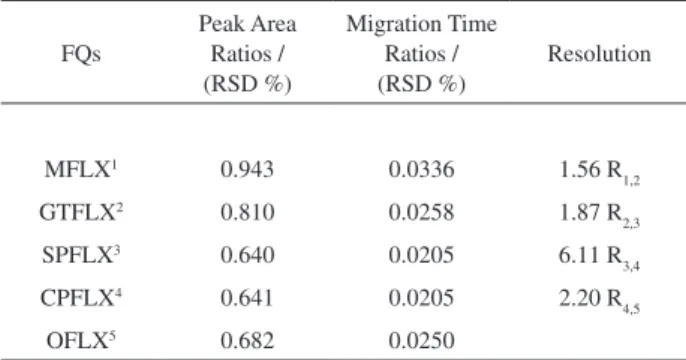
System suitability
Before the beginning of the validation experiments, the system used for analysis must be evaluated to provide data of acceptable quality. Therefore, it is necessary to perform system suitability tests.15 The system suitability considers
overall systems, including electrophoretic system and the calibration and maintenance of the equipments used. In this work, the system suitability was obtained by means of ten consecutive injections of standard mixture using internal standard through relative standard deviation (RSD) to repeatability in area and migration time and the adjacent pair peaks resolution (RS) calculated by equation 1 (Table 2).16 In the present case, R
A,B is adjacent pair peaks
1.50 for all adjacent pair peaks. Therefore, the system was suitable for carrying out the validation procedure.
(1)
Validation procedures
In order to significantly reduce the injection-related imprecision and to ensure better reproducibility and greater control over the sample amount injected, the use of an internal standard in the quantitative analysis is generally preferred.17 Therefore, it’s important to stress the use of
SP-FLX as IS during all validation procedures in this work.
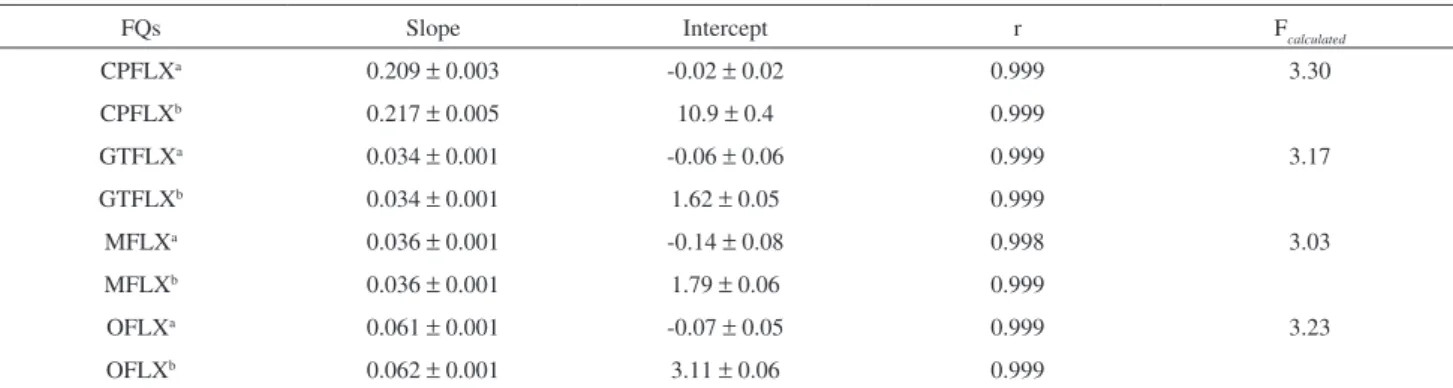
Selectivity and linearity
Due to the difficulty in obtaining a matrix free of the active ingredient, it was necessary to use the method of standard addition to evaluate the method selectivity. Therefore, calibration curves for the method of standard additions and calibration curves for the method of external standard were compared.18 The similarity in the slopes presented between
calibration curves (Table 3) indicates that the method presented appropriate selectivity for FQ analysis.
Linearity was evaluated taking into account the correlation coefficient (r). The correlation coefficient equal to or higher than 0.999 is considered evidence of ideal data fitting to line regression performed through least-square treatment.19
Another way to verify the linearity could be through the application of the linearity hypothesis test a priori.20
This test consists of comparing the deviations of the means from the calibration line (the residual standard deviation (syx) with that of the y values from their means (sy) by using equation 2, where mi is the number of measurement, p is the calibration points and m is the product between p and mi.
(2)
The test is carried out by the comparison between Fcalculated and Fα; f1= p-2; f2=m-p (Fcritical).If Fcalculated ≥ Fcritical,the linear model cannot be applied.In this case, the Fcritical value, that is, F 0,05; 3; 10 is equal to 3.71. Therefore, null hypothesis was not rejected, indicating that the linearity test was considered to be satisfactory, as summarized in Table 3. As a result, the method was found selective and its linearity was considered to be suitable in the concentration range studied.
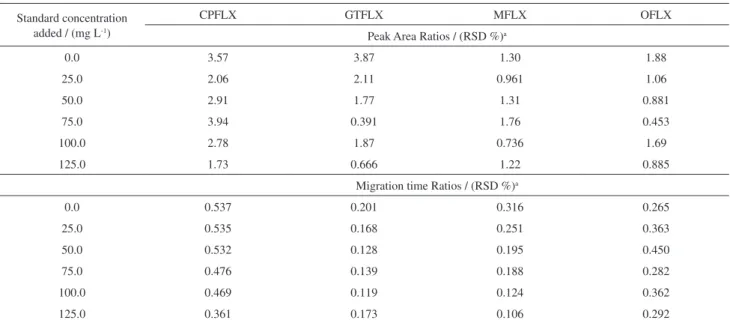
Precision
Precision can be determined through the estimate of the relative standard deviation (RSD).19 The precision in
the validation of this optimized method was performed in two levels: repeatability and intermediate precision. The repeatability of the method was obtained through evaluation of the RSD by measuring run-to-run for migration time ratios and peak area ratios using internal standard for three different standard preparations and seven different tablets of each FQ (Tables 4 and 5).
As it can be seen from Table 4, the RSD of the areas was lower than 1.00 % for all FQs standards and the highest RSD for the
Table 2. Repeatability (RSD) and resolution obtained from system suitability
FQs
Peak Area Ratios / (RSD %)
Migration Time Ratios / (RSD %)
Resolution
MFLX1 0.943 0.0336 1.56 R
1,2
GTFLX2 0.810 0.0258 1.87 R
2,3
SPFLX3 0.640 0.0205 6.11 R
3,4
CPFLX4 0.641 0.0205 2.20 R
4,5
OFLX5 0.682 0.0250
Figure 2. Simultaneous determination of standard mixture containing MFLX, GTFLX, SPFLX (IS), CPFLX and OFLX each 100.0 mg L-1.
Electrolyte composition: 25 mmol L-1 TRIS/ hydrochloride and 15 mmol
L-1 sodium tetraborate buffer mixture. Other conditions: 5s injection at
samples was 3.94 % (Table 5). The dispersion among results in the sample includes factors such as matrix effect, tablet mass variation and variations in the sample preparation. For migration time, all the results were lower than 1.00 % for standards and samples. Therefore, the results were considered acceptable.
The intermediate precision of the method was obtained through evaluation of the RSD by measuring day-to-day migration time ratios and peak area ratios using internal standard seven different tablets of each FQ. The evaluation of the analysis for intermediate precision was performed twelve days after the first analysis. The results shown in Table 6 reveal that the highest value for the area was 3.59 % and for migration time it was lower than 1.00 %. These values are considered to be acceptable, since the calculations were based on the analysis of each tablet in independent preparations. This type of procedure simultaneously evaluates the precision of this method and the analytical concentration dispersion of the active ingredients in the tablets.
Accuracy
Accuracy represents the level of compliance between individual results obtained and a reference value. In this work, accuracy was obtained through recovery.19
In order to calculate the recovery percentage (R%), standard injections of samples spiked in the range of 25.0 to 125.0 mg L-1 were carried out, and equation 3, where A
a
is the analyte area, As is the standard area and Aa+s is the analyte area with standard addition was used.
(3)
Table 7 shows the recovery results for all the samples within the range of 95 to 105% obtained for the tablets analyzed.
Table 3. Statistical results obtained from linearity calculation
FQs Slope Intercept r Fcalculated
CPFLXa 0.209 ± 0.003 -0.02 ± 0.02 0.999 3.30
CPFLXb 0.217 ± 0.005 10.9 ± 0.4 0.999
GTFLXa 0.034 ± 0.001 -0.06 ± 0.06 0.999 3.17
GTFLXb 0.034 ± 0.001 1.62 ± 0.05 0.999
MFLXa 0.036 ± 0.001 -0.14 ± 0.08 0.998 3.03
MFLXb 0.036 ± 0.001 1.79 ± 0.06 0.999
OFLXa 0.061 ± 0.001 -0.07 ± 0.05 0.999 3.23
OFLXb 0.062 ± 0.001 3.11 ± 0.06 0.999
acalibration curve of external standard (n=3); bcalibration curve of standard additions (n=7).
Table 4. RSD (%) in area and in migration time for standards obtained from repeatability study
Concentration / (mg L-1) CPFLX GTFLX MFLX OFLX
Peak Area Ratios / (RSD %)a
25.0 0.250 0.751 0.748 0.301
50.0 0.497 0.705 0.374 0.766
75.0 0.910 0.613 0.0523 0.332
100.0 0.408 0.173 0.203 0.327
125.0 0.392 0.435 0.621 0.305
Migration time Ratios / (RSD %)a
25.0 0.101 0.245 0.0577 0.0208
50.0 0.0307 0.307 0.0152 0.0434
75.0 0.0174 0.184 0.0392 0.0265
100.0 0.0254 0.120 0.0514 0.0108
125.0 0.0243 0.272 0.0719 0.0296
Limit of detection (LOD) and limit of quantification (LOQ)
LOD and LOQ represent the lower concentration of the substance under evaluation that can be detected and measured using a certain experimental procedure. They can be calculated in three different ways: visual method, signal-noise relation and calibration curve parameter evaluation.19
In this work, the signal-noise relation through the standard deviation calculation of the baseline (noise) and the height of the peak (signal) of the analytes were used.
Table 5. RSD (%) in area and in migration time for samples obtained from repeatability study
Standard concentration added / (mg L-1)
CPFLX GTFLX MFLX OFLX
Peak Area Ratios / (RSD %)a
0.0 3.57 3.87 1.30 1.88
25.0 2.06 2.11 0.961 1.06
50.0 2.91 1.77 1.31 0.881
75.0 3.94 0.391 1.76 0.453
100.0 2.78 1.87 0.736 1.69
125.0 1.73 0.666 1.22 0.885
Migration time Ratios / (RSD %)a
0.0 0.537 0.201 0.316 0.265
25.0 0.535 0.168 0.251 0.363
50.0 0.532 0.128 0.195 0.450
75.0 0.476 0.139 0.188 0.282
100.0 0.469 0.119 0.124 0.362
125.0 0.361 0.173 0.106 0.292
an=7 (independent preparation for each sample).
Table 6. RSD (%) in area and in migration time for samples obtained from intermediate precision
Concentration Added / (mg L-1)
Peak Area Ratiosa /
RSD (%)
Migration Time Ratiosa / RSD (%)
CPFLX
0.0 3.59 0.397
50.0 3.17 0.426
GTFLX
0.0 3.09 0.142
50.0 2.52 0.150
MFLX
0.0 2.67 0.221
50.0 1.15 0.155
OFLX
0.0 2.25 0.270
50.0 0.811 0.358
an=7.
LOD and LOQ was calculated within the concentration corresponding to signal-noise relation equal to 3 (equation 4) and 10 (equation 5) respectively, where Sb is the standard deviation of the baseline, CS is the concentration of analyte, Hmax is the maximum peak height and Hmin is the baseline level. The limit of detection (mg L-1) was 2.72 for CPFLX,
1.92 for GTFLX, 0.795 for MFLX and 1.05 for OFLX and the limit of quantification (mg L-1) was 9.06 for CPFLX,
6.40 for GTFLX, 2.65 for MFLX and 3.50 for OFLX.
(4)
(5)
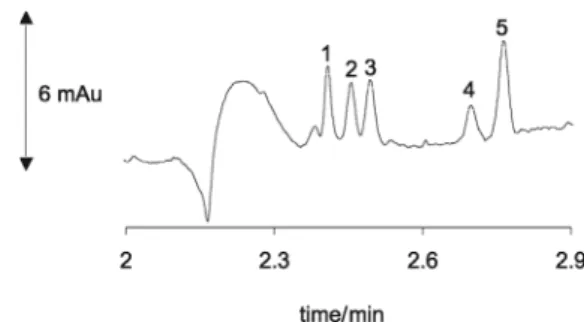
In general, lower LOD and LOQ values are not necessary for pharmaceutical analysis. However, in the case of food, environment or biological matrixes, in which the FQs can be found in low quantity, the sensitivity improvement is important. In order to show that the methodology can be adjustable for analysis in lower concentrations, we carried out an injection of FQs standard mixture in concentration of 1.0 mg L-1 after
changing the injection from 30 mbar for 5s to 50 mbar for 10 s and the internal capillary diameter from 50 µm to 75 µm. Figure 3 shows the electropherogram obtained.
Robustness or ruggedness
Table 7. Percentage of recovery for CPFLX, GTFLX, MFLX and OFLX
Concentration Added / (mg L-1)
Concentration
Found / (mg L-1)a Recovery / (%)
CPFLX
22.6 71.3 ± 1.5 99.7
45.0 95.9 ± 2.8 98.5
67.7 115.1 ± 4.5 100.5
90.3 143.8 ± 3.9 105.0
112.9 161.7 ± 2.8 102.2
101.2b
GTFLX
25.6 73.2 ± 1.8 98.7
50.5 96.2 ± 1.9 102.8
75.3 121.7 ± 0.6 102.8
100.9 145.9 ± 2.7 100.3
125.8 176.1 ± 0.9 100.6
101.0b
MFLX
22.6 70.4 ± 0.7 101.6
45.9 92.8 ± 1.2 102.8
63.7 112.7 ± 1.9 101.1
91.9 141.3± 1.0 100.9
115.3 166.9 ± 2.0 100.2
101.3b
OFLX
24.9 73.8 ± 0.8 98.4
50.6 101.2 ± 0.9 100.1
76.3 126.0 ± 0.6 99.9
101.3 151.8 ± 2.6 99.8
126.9 178.4 ± 1.6 101.5
99.9b
aMean ± s.d. (n=7); bmean of recovery range.
Table 8. Selected parameters for robustness
Parameters Experiments
1 2 3
1- Voltage / kv 23 25 27
2- Temperature / ºC 23 25 27
3- Buffer composition: TRIS/HCl and sodium Tetraborate / (mmol L-1) 23/13 25/15 27/17
4- wavelength / nm 280 ± 2 282 ± 2 284 ± 2
5- Injection / (mbar x s) 30 x 4 30 x 5 30 x 6
6- Sonication time / min 8 10 12
Figure 3. Simultaneous determination of standard mixture containing (1) MFLX, (2) GTFLX, (3) SPFLX, (4) CPFLX and (5) OFLX each 1.0 mg L-1. Electrolyte composition: 25 mmol L-1 TRIS/ hydrochloride and
15 mmol L-1 sodium tetraborate buffer mixture. Other conditions: 10s
injection at 50 mbar pressure, +25 kV applied voltage, 25 ºC cartridge temperature, direct detection at 282 nm and capillary 48.5 cm (40 cm effective length) × 75 µm I.D.
and to provide an indication of its reliability during normal usage.19,21
The parameters selected to evaluate robustness were: electrolyte composition, injection, voltage, temperature, wavelength and sonication time in the sample preparation. If the changes in these experimental parameters remained within acceptable limits of selectivity, accuracy and precision, the method was considered to be robust.15 Table 8
shows the experiments performed for robustness evaluation. The OFLX was chosen to evaluate robustness randomly. The experiments were performed in triplicate.
(experiment 3) showed significant error in the quantification of the compounds in the 95% reliability interval.
Conclusions
All validation parameters of the method evaluated have obeyed the variation limits permitted by the control organs such as ICH, WHO, US-FDA and USP. Therefore, the validated method can be useful for quality assurance in the pharmaceutical industry of these formulations, which present simple electrolyte system, short analysis time, and simple sample preparation as advantages.
Acknowledgments
The authors are grateful to Coordenação de Aperfeiçoamento de Pessoal de Nível Superior (CAPES), Conselho Nacional de Desemvolvimento Científico e Tecnológico (CNPq - 400618/2004-4 and 154931/2006-3), at Universidade Federal de Juiz de Fora (UFJF) and Fundação de Amparo à Pesquisa do Estado de Minas Gerais (FAPEMIG) of Brazil for fellowships and financial support.
References
1. Da Silva, A. D.; De Almeida, M. V.; De Souza, M. V. N.; Couri, M. R. C.; Curr. Med. Chem. 2003, 10, 21.
2.Marona, H. R. N.; Schapoval, E. E. S.; J. Pharm. Biomed. Anal. 1999, 20, 413.
3.Joshi, S.; J. Pharm. Biomed. Anal. 2002, 28, 759.
4.Shervington, L. A.; Abba, M.; Hussain, B.; Donnelly, J.; J. Pharm. Biomed. Anal. 2005, 39, 769.
5.Santoro, M. I. R. M.; Kassab, N. M.; Singh, A. K.; Kedor-Hackmam, E. R. M.; J. Pharm. Biomed. Anal. 2006, 40, 179. 6.Pascual-Reguera, M. I.; Parras, G. P.; Díaz, A. M.; Microchem.
J. 2004, 77, 79.
7. British Pharmacopoeia, vol. 1; Her Majesty`s Stationary Office: London, 1999, pp. 369, 1034.
8.Sun, S.; Chen, L.; J. Chromatogr., A 1997, 766, 215. 9. Sun, S.; Wu, A.; J. Liq. Chromatogr. Relat. Technol. 1999, 22, 281. 10. Fierens, C.; Hillaert, S.; Van den Bossche, W.; J. Pharm. Biomed.
Anal. 2000, 22, 763.
11. Flurer, C. L.; Electrophoresis 1999, 20, 3269. 12. Flurer, C. L.; Electrophoresis 2001, 22, 4249. 13. Flurer, C. L. Electrophoresis 2003, 24, 4116.
14. Faria, A. F.; De Souza, M. V. N.; De Almeida, M. V.; De Oliveira, M. A. L.; Anal. Chim. Acta 2006, 579, 185.
15. Ribani, M.; Bottoli, C. B. G.; Collins, C. H.; Jardim, I. C. S. F.; Melo, L. F. C.; Quim. Nova 2004, 27, 771.
16. United States Food and Drug Administration (US-FDA), Guidance for Industry, Analytical Procedures and Methods Validation, 2000.
17. Dose, E. V.; Guiochon, G. A.; Anal. Chem. 1991, 63, 1154. 18. United States Pharmacopeia Convention; US Pharmacopeia 24,
Validation of Compendial Methods 1225, Rockville, 1999. 19. ICH Guideline, Q2B, Validation of Analytical Procedures:
Methodology, 1995.
20. Danzer, K.; Currie, L. A.; Pure Appl. Chem. 1998, 70, 993. 21. Heyden, Y. V.; Nijhuis, A.; Smeyers-Verbeke, J.; Vandeginste, B.
G. M.; Massart, D. L.; J. Pharm. Biomed. Anal. 2001, 24, 723.
Received: May 14, 2007
Web Release Date: February 7, 2008 Table 9. Robustness results
Analytical parameters Experiments
1 2 3
Correlation coefficient / r 0.997 0.998 0.999
Recovery % 95.1 100.9 97.2
Sample 1 378.5 403.8 381.1
Sample 2 380.0 390.6 389.0
Sample 3 393.2 397.0 377.0
Amount found / mgb 383.9 ± 2.1 397.1 ± 1.6 382.3 ± 1.6
teste-t (p-value)a 0.075 0.530 0.038