Article
Printed in Brazil - ©2016 Sociedade Brasileira de Química0103 - 5053 $6.00+0.00*e-mail: [email protected]
#These authors contributed equally to this work
New Dereplication Method Applied to NMR-Based Metabolomics on Different
Fusarium
Species Isolated from Rhizosphere of
Senna spectabilis
Denise M. Selegato,a,# Rafael T. Freire,b,# Alberto Tannúsb and Ian Castro-Gamboa*,a
aNúcleo de Bioensaios, Biossíntese e Ecofisiologia de Produtos Naturais (NuBBE),
Instituto de Química, Universidade Estadual Paulista “Júlio de Mesquita Filho” (UNESP), 14800-900 Araraquara-SP, Brazil
bCentro de Imagens e Espectroscopia in vivo por Ressonância Magnética (CIERMag),
Instituto de Física, Universidade de São Paulo (USP), São Carlos-SP, Brazil
The search for new sources of natural products steadily increased the use of bioinformatic tools that enabled efficient analysis of complex matrices. In this context, dereplication methods emerged as a fast way of identifying known compounds, accelerating the identification of bioactive chemotypes. Although 1H NMR is widely used as an analytical technique, few studies have been reported using it as a dereplication tool, primarily because of the spectral complexity. This work aims to create a new computational method that analyses 1H NMR data from Fusarium solani and F. oxysporum isolated from Senna spectabilis’srhizosphere through principal component analysis (PCA). The algorithm uses loading values to select important peaks that distinguish both species in PCA, allowing compound dereplication, even in highly similar profiles. As a result, the method, associated with other NMR experiments and information from an in-house Fusarium’s metabolite library was able to distinguish different mycotoxins produced by both fungi, identifying fusaric acid and beauvericin for F. oxysporum and the depsipeptide HA23 from F. solani.
Keywords: dereplication method, Fusarium, PCA, NMR based metabolomics, Senna spectabilis
Introduction
The holistic view of natural product (NP) chemistry has a key role in the discovery of novel bioactive metabolites, allowing the detection and understanding of synergistic and antagonistic relationships in complex matrices through state of the art techniques. In order to achieve an accurate response, the development of analytical tools became of fundamental importance in the current bioprospecting programs, aiming mainly to increase the identification of new potentially active compounds.1,2
In this context, dereplication tools emerge as a rapid way of identifying known compounds in crude extracts, not only for speeding up the detection of chemotypes, but also for accelerating the selection of new and unknown compounds.3,4 When compared to the reductionist approach,
dereplication tools also present themselves advantageous, due to its versatility and reduced use of organic solvents.1,2
Classic dereplication methods use biological screening processes followed by databases queries in order to evaluate the data obtained on the state of the art technologies and hyphenated protocols, such as liquid chromatography coupled to a diode array detector with high-resolution mass spectrometry (LC-DAD-HRMS) and LC-DAD-NMR (nuclear magnetic resonance), LC-DAD-MS/MS (tandem mass spectrometry).4-8 More recently, several other tools
have been developed, aiming to achieve efficient and more factual paths for metabolite elucidation through analysis of high-resolution metabolite profiling.7 Among
the enhancements in the dereplication process, we highlight 2D 13C NMR, high throughput screening (HTS),
bioinformatics, MS/MS molecular networking applied to the omics sciences (genomics, proteomics, metabolomics), as well as chemometrics and other statistical tools, such as partial least-square discriminant analysis (PLS-DA), statistical total correlation spectroscopy (STOCSY).6,7,9-11
appear as an interesting source of new active compounds, mainly due to their high molecular complexity and potential to produce heterogeneous secondary metabolites.12,13
Furthermore, microbes also possess the ability to use different solid substrates as a result of their biochemistry and biological evolution, enabling the survival in different environments through mutualistic association with plants and other organisms, allowing the production of different active metabolites in a single strain.12,13
Senna spectabilis belongs to the Fabaceae family and refers to a plant widely used in folk herbal medicine and extensively studied towards their chemical diversity, majorly composed of pentacyclic triterpenes and piperidine alkaloids.
S. spectabilis’s rhizosphere has a well-known cytotoxic activity. Over the years, the Núcleo de Bioensaios, Biossíntese e Ecofisiologia de Produtos Naturais (NuBBE, Universidade Estadual Paulista “Júlio de Mesquita Filho”, Araraquara, Brazil)has isolated over 150 microorganisms from this small root area, mainly fungi from the Fusarium
species, a well-known pathogen associated with several diseases on the Leguminosae family, primarily due to their mycotoxin diversity, including picolonic acid derivates, depsipeptide and naphthoquinones.
In order to analyze this complex Fusarium extracts, this work aims to create a new computational dereplication method that analyses 1H NMR data based on the principal
component analysis (PCA) loadings values from F. solani
and F. oxysporum isolated from S. spectabilis, in order to rationally explore the selected microorganisms, as well as observe unknown microbial interactions.
The algorithm rapidly selects peaks that distinguish both metabolic profiles from a complex NMR matrix dataset, allowing the extraction of these peaks, and, through the comparison with an in-house1H NMR libraries and
online databases, the identification of important bioactive metabolites in mixture.
Experimental
Fungi isolation and identification
The fungi F. solani and F. oxysporum were isolated from a healthy rhizosphere region of Senna spectabilis according to reported isolation methods.14
The genetic identification was done through internal transcribed spacer region (ITS) analysis using primers ITS1 and ITS4. All PCR products sequencing protocols were based on modified Sanger method,15 and the sequences
obtained were analysed by basic local alignment search tool (BLASTn).16
Fermentation and extraction
Each fungus was cultivated separately in eight Erlenmeyer flasks, each containing 300 mL of Czapek broth. The medium was first autoclaved at 121 °C for 20 min and, after sterilization, F. solani or F. oxysorum were inoculated and incubated while stationary at 26 °C for 28 days.
All cultivations were done with samples triplicated (replicates a, b and c), in which the same inoculated petri dish was used for all three Erlenmeyer.
At the end of the incubation period, the flasks were vacuum filtered to remove mycelium and extracted with ethyl acetate (3 × 500 mL). The solvent was evaporated and the extracts were then submitted to a clean up process with solid phase extraction (SPE) in cartridge filled with C-18 reversed phase silica after reconstitution in methanol HPLC grade (Strata X, C18), followed by filtration in 0.22 µM membrane.
Nuclear magnetic resonance (NMR) analysis
Each triplicate was prepared in instrumental duplicate using 3.0 ± 0.1 mg of crude extract re-suspended in 750 µL of deuterated methanol, using volumetric pipette. All samples were solubilized in ultrasound for 3 minutes, centrifuged for 15 minutes at 6000 rpm to remove any suspended particles, filtered in 0.22 µM membrane and transferred to a 5 mm NMR tube.
NMR spectra were recorded on Bruker Ascend (14.1T) CryoProbe spectrometer (Billerica, Massachusetts, USA) using non-deuterated residual signal as reference.
For 1H NMR acquisition (600 MHz), analysis
parameters were: time domain (TD) 65k, number of scans (NS) 64, relaxation delay (d1) 1.00 s, spectral width (SW) 13 ppm, and temperature: 22 ºC. Saturation on the residual deuterated water signal, at d4.9 ppm was performed by presaturation pulse sequence using composite pulse.
Two-dimensional experiments gradient-selected heteronuclear single quantum coherence (HSQC) and gradient-selected heteronuclear multiple bond correlation (HMBC), as well as unidimensional total correlation spectroscopy (1D TOCSY) and nuclear Overhauser effect spectroscopy (1D NOESY) were performed on all extracts of F. oxysporum and F. solani for molecule elucidation purposes.
Pulse sequences used on 2D NMR analysis were (i) 1H-13C HSQC: phase-sensitive ge-2D
multiplicity-edited HSQC using PEP and adiabatic pulses with gradients in back-inept (hsqcedetgpsisp2.4, Bruker) and (ii) 1H-13C HMBC: phase-sensitive ge-2D HMBC using
1D NOESY was performed using selnogpzs, which minimizes artifacts in NOESY spectra arising to the evolution of zero-quantum coherence of J-coupled spins during the mixing time. Lastly, 1D TOCSY was obtained using seldigpzs, in which a selective echo refocuses the selected spin, which is then transferred down the spin system by the DIPSI-II isotropic mixing sequence.
For HMBC and HSQC acquisition, analysis parameters were, respectively for 1H (f2) and 13C (f1), spectrometer
frequency 600.13 and 150.91 MHz; time domain (TD) 512 and 512; spectral width (SW) 13 and 230 ppm. Number of scans (NS) 32; relaxation delay (d1) 1.50 s and temperature 295.2 K were parameters for both 1H (f2) and 13C (f1). The
long range coupling constant used for HMBC was 8.0 Hz. For 1D TOCSY and 1D NOESY acquisition, analysis parameters were time domain (TD) 65k, number of scans (NS) 512; relaxation delay (d1) 1.00 s, spectral width (SW) 13 ppm and temperature 295.2 K.
Pre-processing, chemometric and computational treatment
No pre-processing functions were applied on the free induction decays (FIDs). After Fourier transformation (FT), spectra were referenced, manually phased and exported in American Standard Code for Information Interchange (ASCII) format files using MestReNova 10.0.2 software17
(Metrelab Research SL, Santiago de Compostela, Spain). The text files were inserted as tables on MATLAB R2015a software18 (Infometrix, Mathworks, Natick,
Massachusetts, USA) for further matrix pre-processing, chemometric and computational analysis.
Only NMR information from d 0.5 to 11.0 ppm was selected for pre-processing treatments. Additionally, NMR information from d 3.00 to 4.17 ppm, which comprises sugars components from Czapek liquid media, was removed.
Baseline was corrected using airPLS algorithm19 and
then normalized to total area. Alignment was performed using ICOSHIFT algorithm20 and no data reduction by
bucketing or binning was performed.
Hierarchical clustering analysis (HCA) was calculated using Euclidean distance as the pairwise distance and ward distance for linkage. For mean-centered PCA, NIPALS algorithm (nonlinear iterative partial least squares) was applied at a 95% of confidence interval.
Dereplication algorithm
The algorithm was entirely written in MATLAB language and the input data was the loading values of PC2 obtained in PCA.
In-house Fusarium database
In order to compare the selected peaks from the dereplication algorithm, an in-house Fusarium database was compiled with chemical shifts reported from the major metabolites found in both F. solani and F. oxysporum. The database included 1H NMR data of 47 secondary metabolites
from F. oxysporum and 32 secondary metabolites from
F. solani, including jasmonates, tricothecenes, enniatins, naphthoquinones, and others. The structures were drawn using ChemDraw Ultra 12.0 (PerkinElmer Informatics, Massachusetts, USA) and 1H NMR prediction was made
using MestReNova 10.0.217 (Metrelab Research SL,
Santiago de Compostela, Spain), in CDCl3.
Confirmatory LC-HRMS/MS analysis
High-resolution mass spectra were measured for all replicates on a LC-DAD-HRMS-quadrupole time-of-flight (Q-TOF) Micromass spectrometer in the electrospray ionization (ESI) mode. For the LC analysis, UV SPD detector system and Kinetex C18 100R column (150 × 4.60 mm) were used. For MS analysis, cone voltage 4500 kV, desolvation temperature 450 °C, nebulizing gas 10 psi and collision energy 25 eV were used.
For tandem MS (MS/MS) in the automated mode, a MS (MS1) was acquired, selecting the major ions of each retention times followed by a real time fragmentation experiment. All LC-MS/AutoMS2 experiments were done in AmaZon speed (Bruker Corporation, Massachusetts, EUA), using the following parameters: nebulizer pressure 70 psi, drying gas flow 12 L min-1 and drying gas
temperature of 350 °C.
Results and Discussion
Fungi genetic identification
Both fungi were identified as Fusarium, the major genus found in S. spectabilis’s rhizosphere. DNA extraction of F. solani yielded 21.8 ng µL-1 at a 1.8 purity and 98%
identity, while F. oxysporum yielded double (50.6 ng µL-1)
at a 1.9 purity and 99% identity.
Fungi extraction
F. oxysporum produces 6 times more extract than F. solani
by higher density and more intense color on F. oxysporum
sobrenatants after vacuum filtration.
Chemometric Analysis
Hierarchical clustering analysis (HCA)
1H NMR spectra were pre-processed and plotted,
revealing the high complexicity of both metabolic profile (Figure 1). Aditionally, spectra of both species present high overall similarity, highlighting the necessity of an algorithm that recognizes important peaks from complex data.
Firstly, hierarchical clustering was applied as the first unsupervised chemometric analysis, employed to check the similarity on the chemical data and to assure that the
1H NMR replicates of both fungi were similar among
themselves and reliable for comparison among each other. HCA results, abridged as a dendrogram (Figure 2), show two major clusters, each related to one Fusarium species, illustrating the statistical difference between them, further explored on PCA. Moreover, all sample and instrumental replicates presented very high similarity among themselves, indicating low standard deviation and, consequently, little difference on metabolite production.
Principal component analysis (PCA)
When conducting PCA without binning the data, it is possible to observe the projection of a real NMR peak shape, expressed on the loading values of the respective principal component (PC). On this unsupervised analysis, chemical composition from metabolic profiles influences the PCs,
enabling the separation of samples in a multidimensional space, observed on PCA scores.
In general, different PCs comprise different loading values, which means that each loading component could have one or more chemical substances that are responsible to organize the samples in a multidimensional space.21
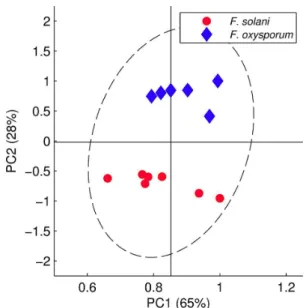
The grouping pattern observed on HCA was repeated on PCA, with two distinguished groups easily observed in the score plot for PC1 and PC2 values (total variance of 93%). Principal component 2 was the PC that best chemically differentiates both fungi, with samples from F. oxysporum
arranged in the positive values and samples from F. solani
arranged in the negative PC2 values (Figure 3).
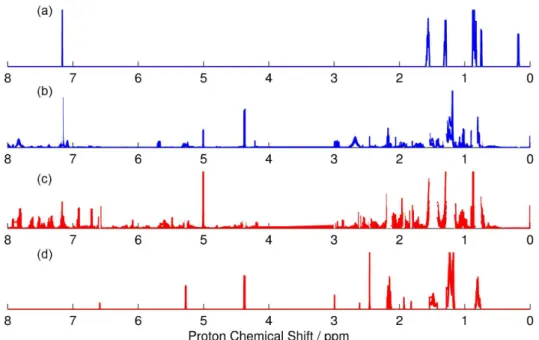
Additionally, PC2 loading values clearly reveal that the positive loading values are highly similar to the original
1H NMR spectra of F. oxysporum, while the negative ones
are remarkably close to F. solani’s (Figure 4), confirming once again that PCA is a reliable tool for the screening Figure 1. 1H NMR spectra of replicates from F. oxysporum and F. solani after pre-processing treatment. Region from 3 to 4 ppm was removed for
chemometric analysis. (a) Overlap of 6 spectra from F. oxysporum’s replicates; (b) overlap of 7 spectra from F. solani’s replicates.
Figure 2. HCA dendrogram of 1H NMR spectra of F. solani and F.
step in which important chemical shifts are identified and further analyzed by the dereplication algorithm.
Dereplication algorithm description
The dereplication method uses as input data the loading values of PCA or PLS-DA analysis. For this particular example, loading values of PC2 best separated both
Fusarium species and were used for further computational analysis.
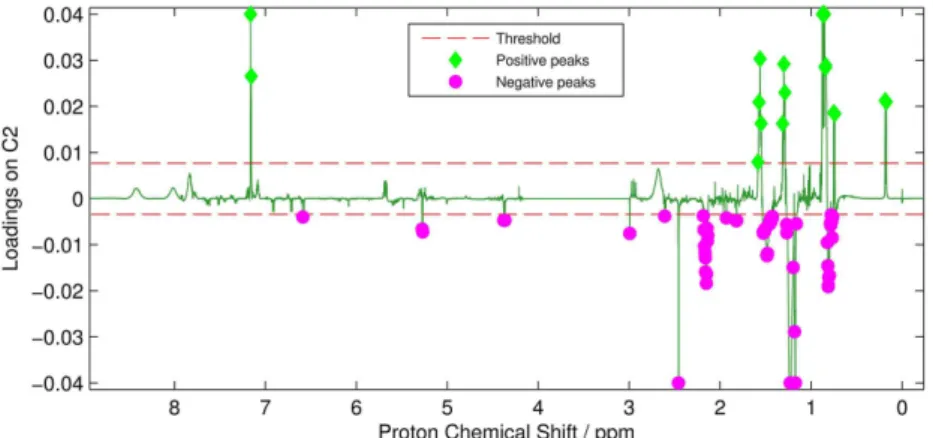
(i) The first step of the algorithm is to make a cut on the positive and negative loading values of the selected PC based on the threshold cut. This is made to avoid noise and
minor signals, aiming to select only possible peaks from compounds that best chemically separate the samples at a particular PC. The pre-selected threshold can be optimized for each analysis and is determined based on the number of peaks you wish to analyze. As the threshold can be any value between the minimum and the maximum for the respective loadings, different tests can be performed, to obtain an optimum cut that comprises the most intense signals, possibly relating it to metabolites responsible for this separation.
For PC2 loading, threshold cuts were performed at 20% of the maximum, for positive values, and 8% of the minimum, for negative ones.
(ii) The second step is to identify the maximum and minimum values in the selected regions after the threshold cut. The maximum values are used in the algorithm to create ppm blocks, which are ranges of chemical shifts based on the maximum difference, in ppm, between all maximum values identified. In addition, the maximum values are used to determine the peaks and, possibly, the multiplicity. The minimum values are used to identify the starting and the ending point of a ppm block. The ppm blocks generated based on the loadings will be later compared to the correspondent spectral regions on the real 1H NMR
spectra.
Figure 5 shows the selected peaks from positive (green diamond) and negative (pink circle) loading values of PC2 and the threshold cut (red dashed line) used for both parts. The maximum difference between peaks to create the signal blocks was d 0.05 ppm, totaling six regions from positive values and 12 regions from negative numbers, which will be further submitted to step (iii).
Figure 3. PCA score plots of 1H NMR spectra of F. solani and F.
oxysporum extracts (PC1 × PC2, total variance of 93%); 95% of confidence interval.
Figure 4. PCA C2 loadings plot of 1H NMR spectra of F. solani and F. oxysporum matrices (total variance of 28%), in black; 1H NMR spectra of replicates
(iii) The third step is crucial for the dereplication analysis and consists in extracting, from the entire 1H NMR
spectra, the exact chemical shift region of each ppm block identified on the previous step. Then, the intensities of the extracted blocks are correlated individually with the loadings intensities that have the same chemical shift values.
As expected, all six regions extracted from the positive loading values were highly correlated to F. oxysporum
1H NMR spectra (Figures 6a-6f), while all 12 regions from
the negative PC2 loading values were highly correlated to
F. solani 1H NMR spectra (Figures 6g-6r). Only four of the
twelve regions selected from the negative values were used for further evaluation, since excluded regions corresponds to signals from Czapek broth medium (identified by comparison with Czapek blank spectrum). Further details are found in the Supplementary Information.
(iv) Lastly, once the correlations values between loadings and 1H NMR matrix are established, the samples
are separated in two groups: highly and poorly correlated to the loading regions. The correlation threshold to stipulate the groups is set in the algorithm input and can be optimized according to the matrix complexity.
The correlation threshold between the PC2 loadings blocks and the samples blocks was 75 and 71% to the positive and negatives loading values, respectively. Highly correlated from positive and negative loading analysis can be observed in Figures 7a-7f and Figures 8a-8d, respectively.
At the end of the method, and as a direct result of PCA separation, ten important 1H NMR regions were
extracted from positive and negative loading values, which were submitted to molecule elucidation. An optional and sequential step for the algorithm is to set the intensity of the highly correlated 1H NMR signals to the noise intensity
and then re-run the algorithm, enabling the dereplication of additional molecules on the sample. Figure 9 shows the
results of the algorithm at the end of the first run. (a) and (d) are the isolated 1H NMR peaks with high PC2 correlations;
(b) and (c) are the matrices for both fungi species after the peaks subtractions. The peaks are selectively removed from each fungi matrix showing how the algorithm can successfully dereplicate a complex mixture. In fact, this whole procedure, from the PCA calculation to signal isolation, can continue automatically until most of the signals are identified and grouped, providing a reliable and statistical dereplicate procedure.
Molecule elucidation
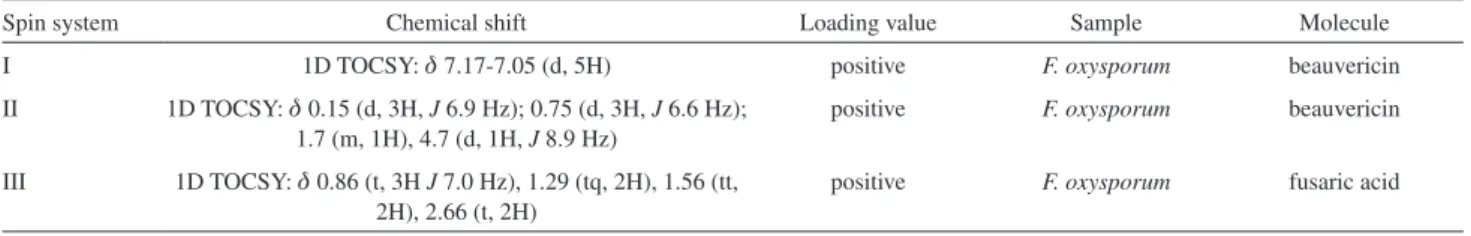
Peaks selected on the dereplication method were submitted to one-dimensional TOCSY, enabling the identification of spin systems from the corresponding molecule. Those spin system were then compared to the
in-house Fusarium database for molecule elucidation and confirmed through 2D NMR experiments, high resolution MS and tandem MS.
Positive loading values
Six peaks were selected from the positive loading values (F. oxysporum): d0.16 (d, 3H, J 7 Hz), 0.76 (d, 3H,
J 6.6 Hz), 0.86 (t, 3H J 7.0 Hz), 1.29 (m, 2H), 1.56 (m, 2H) and 7.16 ppm (m, 5H).
1D TOCSY experiments from all six peaks revealed three spin systems, showed in Table 2. TOCSY data was then compared to the created Fusarium database, suggesting the presence of two secondary metabolites commonly found in F. oxysporum. Spin systems I and II matched to beauvericin, a hexadepsipeptide from the enniatin family formed altering hydroxy-iso-valeryl (spin system II) and methylphenylalanyl (spin system I, aromatic portion), while spin system III was compatible to the saturated long chain substituent of fusaric acid, a picolinic acid derivative mycotoxin (Figure 10).
Figure 6. In color, the 1H NMR chemical shift blocks identified and extracted from spectra matrix (gray). The colors from blue to red, in a jet scale, represent
the correlation values between spectra regions and PC2 loadings region in percentage values. (a)-(f) Chemical shift regions identified by the positive part of the PC2 loadings; (g)-(r) chemical shift regions identified by the negative part of the PC2 loadings.
For confirmatory analysis, the presence of additional molecule signals and their spin-spin interactions were evaluated using HSQC, HMBC, 1D TOCSY and 1D NOESY from crude extract.
Beauvericin showed additional spin systems from alanyl group, which correlates to system I on HMBC and it is formed by two diasterotopic hydrogens at d 2.94 (dd, 1H,
J 14.7, 12.8 Hz) and 3.29 (dd, 1H, J 14.7, 4.6 Hz), as well as one hydrogen bonded to a terciary carbon at d5.70 (dd, 1H, J 12.7, 4.5 Hz). 1D NOESY showed the correlation between the singlet at d 3.05 ppm (s, 3H) and spin system II.
Fusaric acid also revealed an additional spin system from the pyridine ring correlated with system I on HMBC, which comprises in both aromatic signals d 7.80 (d, 1H,
J 8.2 Hz) and 8.01 (d, `1H, J 8.2 Hz), suggesting a para -substituted pyridine ring.
Confirmatory LC-DAD-HRMS-electrospray ionization (ESI) of F. oxyporum extract was performed according to the seven golden rules by Kind and Fiehn,22 and showed
that fusaric acid appears at 12.3 minutes on an exploratory 50-minute gradient, with two intense peaks [M + H]+
m/z 180.0959 and [M + Na]+m/z 202.0770 and two neutral
loss fragmentation m/z 162.0860 and m/z 134.0921 related to a loss of water [M − H2O + H]+ and carboxyl group
[M − COOH + H]+, respectively. ESI-MS/MS analysis of
fusaric acid revealed a dominant fragment of m/z 152.05, agreeing with data previously described in literature.23
Beauvericin appeared at 35.8 minutes with intense peaks [M + H]+ m/z 784.3895 and [M + Na]+ m/z 806.3698.
Tandem MS showed three main fragments m/z 541.29, 523.27 and 262.10, related to [dimer + H + H2O]+,
Negative loading values
Since the growth of F. solani in Czapek broth is slower than F. oxysporum, easily observable by the difference in mycelium size and density, it was expected that crude extracts from F. solani showed a higher concentration of free sugars from liquid medium and fatty acid esthers derivate from fungus primary metabolites that could interfere on the PCA analysis. In fact, out of the twelve peaks selected by the dereplication method, only four were secondary metabolites signals. Table 1 shows the molecules
elucidated from the eight excluded regions by comparison with NMR data from Human Metabolome Database,25
following the procedure described by Bubb.26
Further evaluation revealed the spin system of the stereoisomers beta-glucose through the anomeric proton irradiation at d 5.01 ppm, revealing the spin system d5.01 (d, 1H, J 3.8 Hz), 3.67 (m), 3.57 (m, 1H), 3.25 (dd, 1H,
J 3.8 Hz), 3.19 (m, 1H).
1D TOCSY proved to be greatly challenging, due to the very small intensity of the four remaining peaks. HMBC Figure 7. Regions isolated from the positive part of the PC2 loadings overlapped with the 1H NMR spectra. The two groups of signal statically identified shows
in the first row (a)-(d) peaks with high correlation (> 71%) and the second row (a1)-(d1) shows the peaks with low correlation (< 71%) with the loadings.
Figure 8. Region for the negative part of the PC2 loadings overlapped with the 1H NMR spectra. The first row (a)-(f) shows peaks with that had high
suggested the presence of a 1,4-disubstituted phenyl ring system through the correlation of d6.59 (d, J 6.8 Hz, 2H) with d 6.93 (d, J 6.8 Hz, 2H). Additionally, d6.93 also correlated with the diastereotopic hydrogen at d 2.61 (m, 1H).
Comparison with 1H NMR data from the in-house
Fusarium database suggested the depsipeptide HA 23 (Figure 11), isolated by Feng et al.27 This unusual peptide
is formed by a pipecolinic acid and O-prenyl- substituted tyrosine residues and a polyketide chain.
Confirmatory LC-DAD-HRMS-ESI of F. solani extract
Figure 9. (a) 1H NMR signals extracted by the correlation with the positive part of PC2 loadings and are related to the F. oxysporum; (b) overlapped 1H NMR spectra of F. oxysporum crude extracts after extraction of the selected peaks; (c) 1H NMR signals extracted from the correlation with the positive
part of PC2 loadings and are related to the F. solani; (d) overlapped 1H NMR spectra of F. solani crude extracts after extraction of the selected peaks.
showed HA23 depsipeptide at 43.0 minutes on a exploratory 50-minute gradient, with three intense peaks [M + H]+
m/z 601.3465, [M + Na]+ m/z 623.3262 and [M + K]+
m/z 639.2986. No fragmentation pattern has ever been reported for this molecule, thus, for molecular confirmation, purification and isolation procedure are necessary.
Figure 10. Chemical structure of secondary metabolites from F. oxysporum. (a) Beauvericin; (b) fusaric acid.
Table 1. Chemical shifts of primary metabolites found in F. solani AcOEt extract
Chemical shift Molecule
d 1.24 (m, 16H), 1.50 (m, 5H), 2.15 (m, 18H), 0.88 (m), 2.45 (s, 4H) fatty acid esther
d3.02 (dd, 4H, J 9.2, 7.8 Hz), 4.37 (d, 4H, J 7.8 Hz), 3.75 (dd, J 11.3 Hz, 4H), 3.55 (m, 4H), 3.18-3.24 (m) α -glucose
d5.29 (d, 1H, J 3.8 Hz), 3.67 (m, 1H), 3.57 (m, 1H), 3.25 (m, 1H), 3.19 (mm, 1H) fructose
Table 2. 1D NMR of selected peaks from dereplication method
Spin system Chemical shift Loading value Sample Molecule
I 1D TOCSY: d7.17-7.05 (d, 5H) positive F. oxysporum beauvericin
II 1D TOCSY: d 0.15 (d, 3H, J 6.9 Hz); 0.75 (d, 3H, J 6.6 Hz); 1.7 (m, 1H), 4.7 (d, 1H, J 8.9 Hz)
positive F. oxysporum beauvericin
III 1D TOCSY: d 0.86 (t, 3H J 7.0 Hz), 1.29 (tq, 2H), 1.56 (tt, 2H), 2.66 (t, 2H)
positive F. oxysporum fusaric acid
Conclusions
PCA was sucessifully chosen as a dereplication tool, enabling the evaluation of higher loads of PC2. Using selected loading values, the algorithm automatically identified and extracted 1H NMR shifts from a complex
chemical profile, enabling the identification of known metabolites (i) hexadepsipeptide beauvericin and (ii) fusaric acid, found in F. oxysporum, and (iii) depsipeptide HA23, found in F. solani. Additionally, the algorithm was also able to identify free sugars from Czapek broth (iv) α-glucose and (v) fructose, as well as esther fatty acid from primary fungi metabolim.
The development of an in-house Fusarium database was a crucial step for molecule elucidation, enabling the comparison of known spin system and the 1D NMR data obtained from a complexe matrix. Furthermore, the identification of three mycotoxin as major metabolites from fungi isolated from a healthy rhizosphere shows the region competitivity and the importance of future studies regarding the discovery of new bioactive compounds.
Additionally, as a result of PCA separation, the chemical shifts that best contributed to the Fusarium species chemical differences are related to compounds that are majorly found in one particular specie, being an excellent chemotaxonomy indicator.
Supplementary Information
Supplementary data (DNA sequence; 1H NMR, 13C NMR data; total ion chromatograms (LC-HRMS)
and tandem spectra) are available free of charge at http://jbcs.sbq.org.br as PDF file.
Acknowledgments
This work was funded by grants from Fundação de Amparo à Pesquisa do Estado de São Paulo (FAPESP): a PhD scholarship awarded to D. M. S. (2014/05935-0) and R. T. F. (2011/21623-0; BEPE 2012/22206-7), the Biota-FAPESP Program (2011/50816-1) and CEPID Program through CIBFar Project (2013/07600-3)
awarded to Additional research grant to I. C. G. (449523/2014-4), funded by Conselho Nacional de Desenvolvimento Científico e Tecnológico (CNPq) is also acknowledged.
References
1. Wolfender, J. L.; Glauser, G.; Boccard, J.; Rudaz, S.; Nat. Prod. Commun. 2009, 4, 1417.
2. Ng, J.; Bandeira, N.; Liu, W. T.; Ghassemian, M.; Simmons, T. L.; Gerwick, W. H.; Linington, R.; Dorrestein, P. C.; Pevzner, P. A.; Nat. Methods 2009, 6, 596.
3. Newman, D. J.; Cragg, G. M.; J. Nat. Prod. 2012, 75, 311. 4. Fanali, S.; J. Chromatogr. A 2015, 1382, 135.
5. Jarussophon, S.; Acoca, S.; Gao, J.; Deprez, C.; Kiyota, T.; Draghici, C.; Purisima, E.; Konishi, Y.; Analyst (Cambridge, U. K.) 2009, 134, 690.
6. Williams, R. B.; O’Neil-Johnson, M.; Williams, A. J.; Wheeler, P.; Pol, R.; Moser, A.; Org. Biomol. Chem. 2015, 13, 9957.
7. Gaudencio, S. P.; Pereira, F.; Nat. Prod. Rep. 2015, 32, 779. 8. Nielsen, K. F.; Mansson, M.; Rank, C.; Frisvad, J. C.; Larsen,
T. O.; J. Nat. Prod. 2011, 74(11), 2338.
9. Wolfender, J. L.; Queiroz, E. F.; Hostettmann, K.; Expert Opin. Drug Discov. 2006, 1, 237.
10. Nielsen, K. F.; Larsen, T. O.; Front. Microbiol. 2015, 6, 71. 11. Funari, C. S.; Eugster, P. J.; Martel, S.; Carrupt, P. A.; Wolfender,
J. L.; Silva, D. H.; J. Chromatogr. A 2012, 1259, 167. 12. Aly, A. H.; Debbab, A.; Kjer, J.; Proksch, P.; Fungal Divers.
2010, 41, 1.
13. VanderMolen, K. M.; Raja, H. A.; El-Elimat, T.; Oberlies, N. H.; AMB Express 2013, 3, 71.
14. Parkinson, D.; Thomas, A.; Can. J. Microbiol. 1965, 11(6), 1001.
15. Sanger, F.; Nicklen, S.; Coulson, A. R.; Proc. Natl. Acad. Sci. U. S. A. 1977, 74(12), 5463.
16. Altschul, S. F.; Madden, T. L.; Schaffer, A. A.; Zhang, J.; Zang, Z.; Miller, W.; Lipman, D. J.; Nucleic. Acids Res. 1997, 25(17), 3389. Available at http://blast.ncbi.nlm.nih.gov/Blast. cgi, accessed in May 2016.
18. MATLAB R2015a; Infometrix, Mathworks, Natick, Massachusetts, USA, 2015.
19. Zhang, Z.; Chen, S.; Liang, Y.; Analyst (Cambridge, U. K.) 2010, 135, 1138.
20. Savorani, F.; Tomasi, G.; Engelsen, S. B.; J. Magn. Reson. 2010, 202, 190.
21. Bro, R.; Smilde, A. K.; Anal. Methods 2014, 6, 2812. 22. Kind, T.; Fiehn, O.; BMC Bioinf. 2007, 8, 105.
23. Brown, D. W.; Butchko, R. A. E.; Busman, M.; Proctor, R. H.; Fungal Genet. Biol. 2012, 49, 521.
24. Hu, L.; Rychlik, M.; J. Agric. Food Chem. 2012, 60(29), 7129. 25. Wishart, D. S.; Tzur, D.; Knox, C.; Eisner, R.; Guo, A. C.;
Young, N.; Cheng, D.; Jewell, K.; Arndt, D.; Sawhney, S.; Fung, C.; Nikolai, L.; Lewis, M.; Coutouly, M. A.; Forsythe, I.; Tang, P.; Shrivastava, S.; Jeroncic, K.; Stothard, P.; Amegbey, G.; Block, D.; Hau, D. D.; Wagner, J.; Miniaci, J.; Clements, M.;
Gebremedhin, M.; Guo, N.; Zhang, Y.; Duggan, G. E.; Macinnis, G. D.; Weljie, A. M.; Dowlatabadi, R.; Bamforth, F.; Clive, D.; Greiner, R.; Li, L.; Marrie, T.; Sykes, B. D.; Vogel, H. J.; Querengesser, L.; HMDB: the Human Metabolome Database; Nucleic Acids Res. 2007, 35 (Database issue): D521-6. Available at http://www.ncbi.nlm.nih.gov/pubmed/17202168, accessed in May 2016.
26. Bubb, W. A.; Concepts Magn. Reson., Part A 2003, 19A(1), 1. 27. Feng, Y.; Blunt, J. W.; Cole, A. L. J.; Munro, M. H. G.; Org.
Lett. 2002, 4(12), 2095.
Submitted: February 23, 2016
Published online: May 5, 2016